- Distinguish between a population and a sample

Содержание
- 2. Distinguish between a population and a sample Things you should know from Chapter 1 ANSWERS Examples:
- 3. Distinguish between a parameter and a statistic Examples: Identify if each describes a parameter or a
- 4. Distinguish between a parameter and a statistic Examples: Identify if each describes a parameter or a
- 5. Distinguish between descriptive statistics and inferential statistics Example: A survey of 39 credit cards found that
- 6. Distinguish between descriptive statistics and inferential statistics Example: A survey of 39 credit cards found that
- 7. Distinguish between qualitative and quantitative data. Examples: The monthly salaries of the employees at an accounting
- 8. Distinguish between qualitative and quantitative data. Examples: The monthly salaries of the employees at an accounting
- 9. Classify data according to the four levels of measurement. Examples: A list of badge numbers of
- 10. Classify data according to the four levels of measurement. Examples: A list of badge numbers of
- 11. Know how data are collected – by doing an observational study, performing experiment, using a simulation,
- 12. Examples: Which method of data collection would you use: A study on the effect of low
- 13. Know good ways to design an experiment. - Sample size, sampling methods, control/placebo with blind studies,
- 14. Identify/describe the different sampling techniques: simple random sampling, stratified sampling, cluster sampling, convenience sampling, and systematic
- 15. Identify a biased sample Examples: Identify a bias that might occur in the following studies: A
- 17. Скачать презентацию
 Необходимость и значение национальной идеи в укреплении независимости
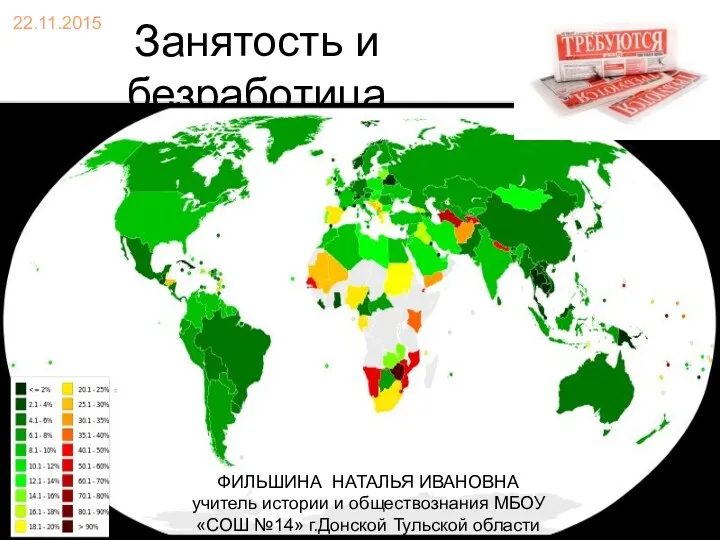 Занятость и безработица
 Политические режимы:авторитаризм,тоталитаризм. Презентация по обществознанию для 9 класса.
 Социология как наука
 Концепция духовно-нравственного развития и воспитания личности гражданина России
 Презентация к уроку по обществознанию в 9 классе на тему Власть (учебник Кравченко А.И., Певцова Е.А.)
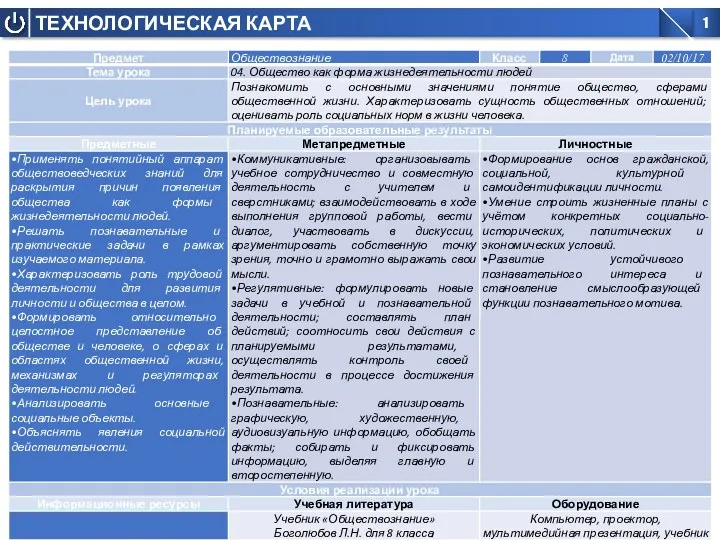 Общество как форма жизнедеятельности людей
 Традиционная, индустриальная и постиндустриальная цивилизация
 Конфликт. Признаки конфликта
 Обществознание
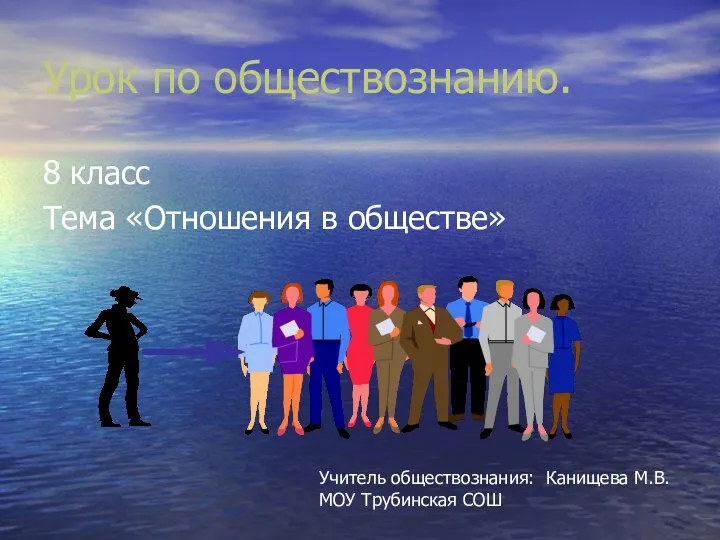 Презентация к уроку Отношения в обществе
 Формы и модели семьи. (Тема 3.2)
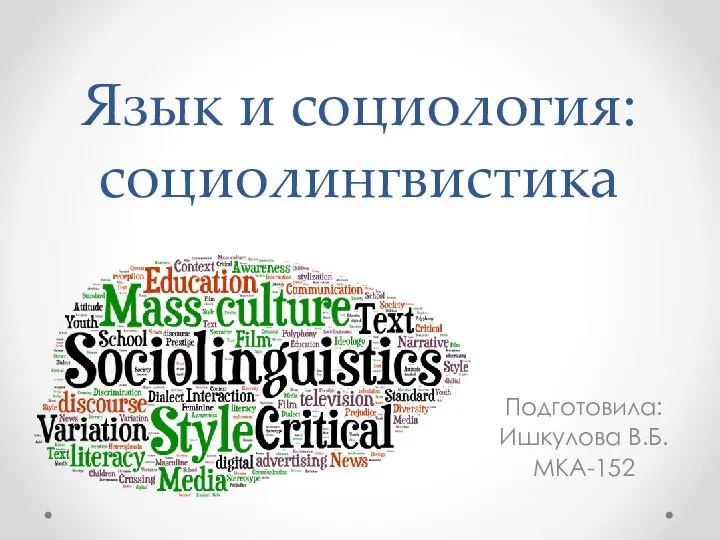 Язык и социология: социолингвистика
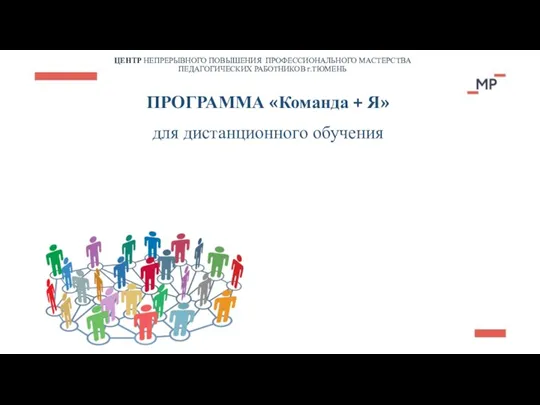 Программа Команда + Я
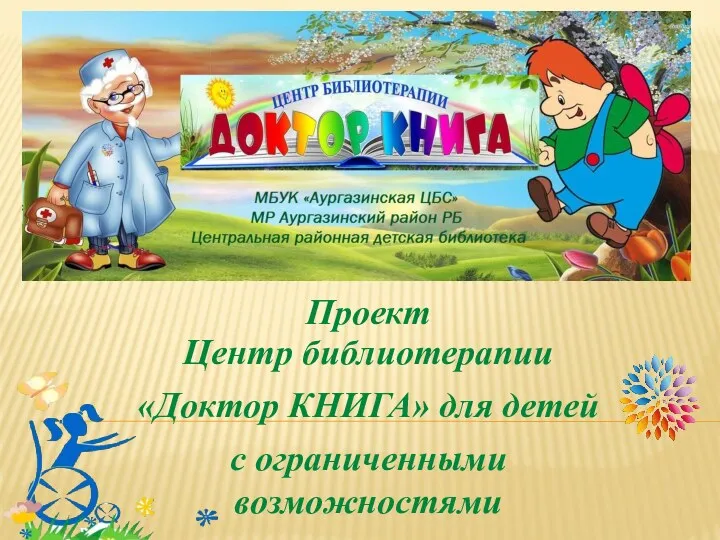 Доктор книга. Центр библиотерапии для детей с ограниченными возможностями
 Коледж моєї мрії
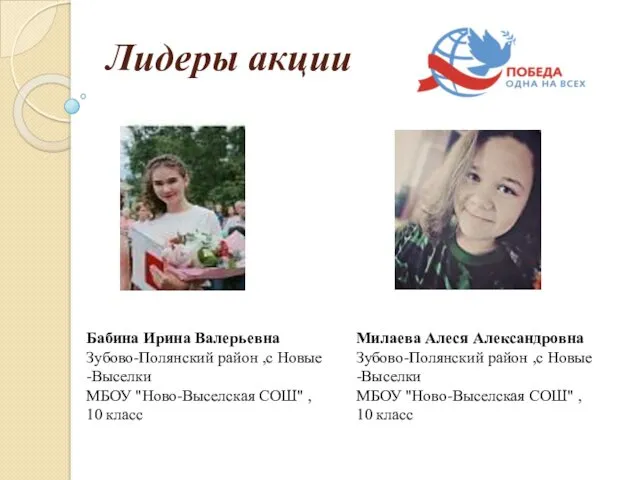 Лидеры акции
 Представление о гендерных ролях у нынешних старшеклассников и поколения их родителей
 Определение и понятия биографического метода
 история самоуправления
 Акция - месяц добрых дел
 Инструментальные обследования и сбор статистических данных предприятия
 Этика социального работника
 Главные вопросы экономики (презентация)
 Проект Мы вместе по социализации ребёнка с ОВЗ
 Презентация к уроку С добрым утром 5 класс
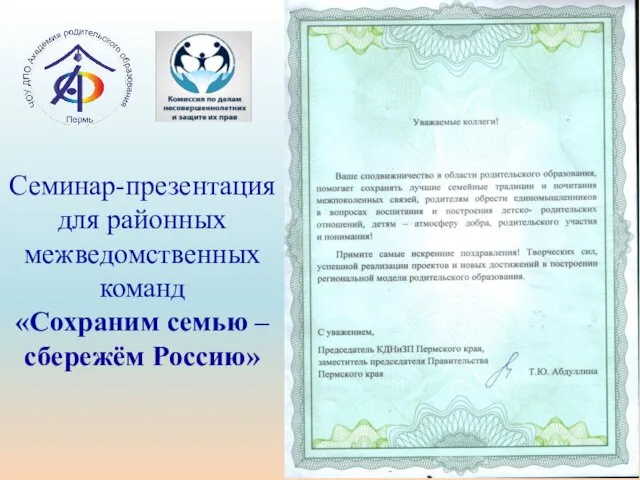 Сохраним семью – сбережём Россию. Семинар для районных межведомственных команд
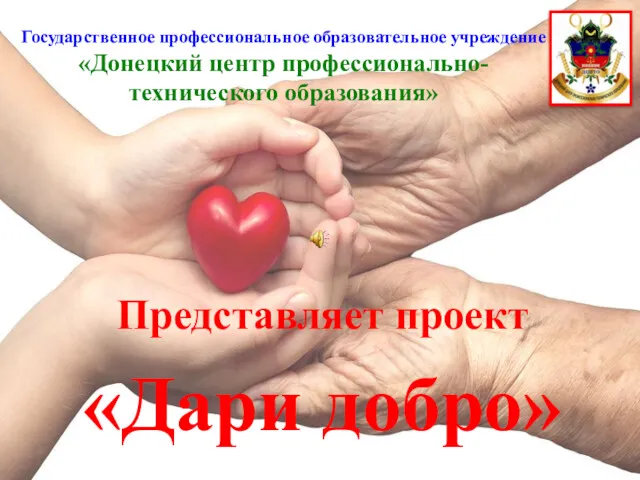 Конкурс Дари добро