- Article format

Содержание
- 2. ARTICLE FORMAT IS : TITLE AUTHORS ABSTRACT INTRODUCTION MATERIALS AND METHODS RESULTS TABLES AND GRAPHS DISCUSSION&
- 3. RESULTS 1. This is where you present the results you've gotten. Use graphs and tables if
- 4. 2. You don't necessarily have to include all the data you've gotten during the semester. This
- 5. 3. Use appropriate methods of showing data. Don't try to manipulate the data to make it
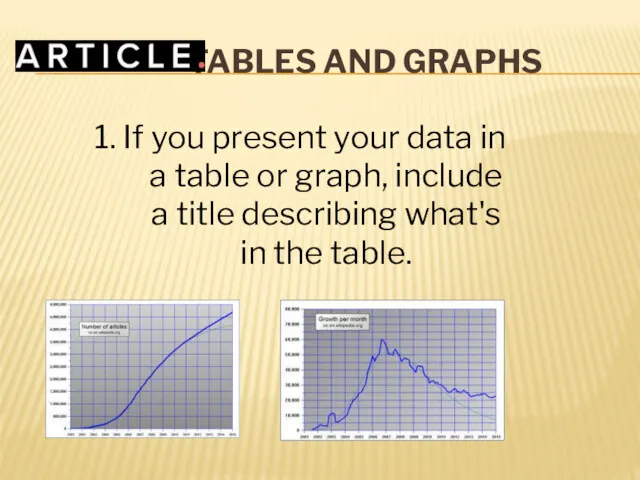
- 6. TABLES AND GRAPHS 1. If you present your data in a table or graph, include a
- 7. 2. Don't use a table or graph just to be "fancy". If you can summarize the
- 8. Numerical results should include standard deviations or 95% confidence limits and the level of statistical significance.
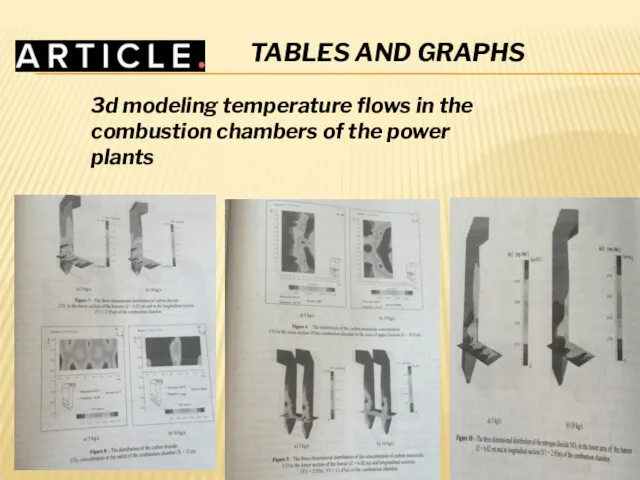
- 9. TABLES AND GRAPHS 3d modeling temperature flows in the combustion chambers of the power plants
- 11. Скачать презентацию
ARTICLE FORMAT IS :
TITLE
AUTHORS
ABSTRACT
INTRODUCTION
MATERIALS AND METHODS
RESULTS
TABLES AND GRAPHS
DISCUSSION& Conclusion
REFERENCES (LITERATURE CITED)
ARTICLE FORMAT IS :
TITLE
AUTHORS
ABSTRACT
INTRODUCTION
MATERIALS AND METHODS
RESULTS
TABLES AND GRAPHS
DISCUSSION& Conclusion
REFERENCES (LITERATURE CITED)
RESULTS
1. This is where you present the results you've
RESULTS
1. This is where you present the results you've
2. You don't necessarily have to include all the data you've
2. You don't necessarily have to include all the data you've
3. Use appropriate methods of showing data. Don't try to manipulate
3. Use appropriate methods of showing data. Don't try to manipulate
TABLES AND GRAPHS
1. If you present your data in a
TABLES AND GRAPHS
1. If you present your data in a
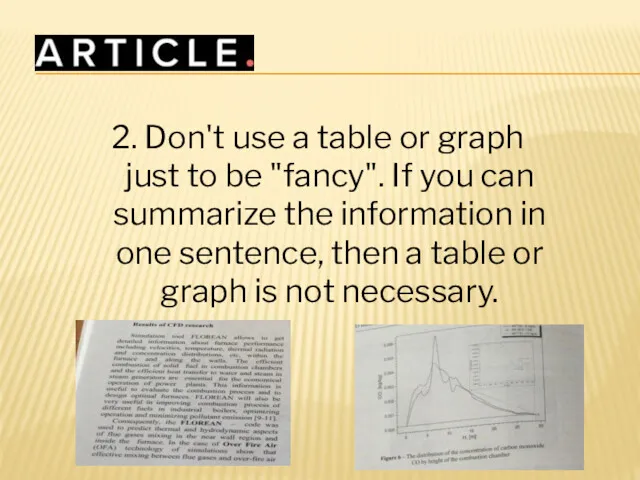
2. Don't use a table or graph just to be "fancy".
2. Don't use a table or graph just to be "fancy".
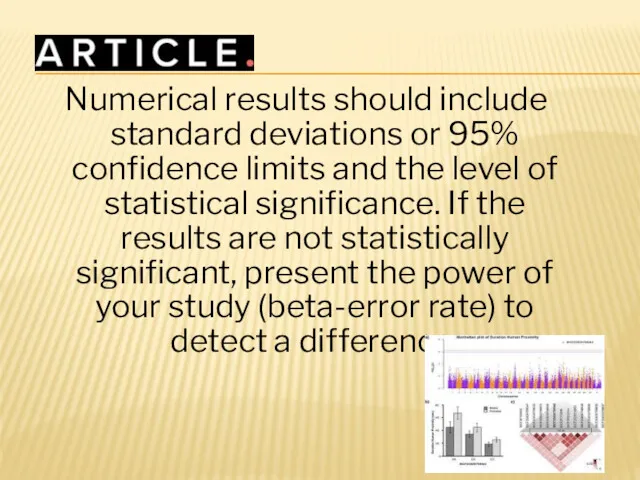
Numerical results should include standard deviations or 95% confidence limits and
Numerical results should include standard deviations or 95% confidence limits and
TABLES AND GRAPHS
3d modeling temperature flows in the combustion chambers of
TABLES AND GRAPHS
3d modeling temperature flows in the combustion chambers of
 Numbers 1-1000
 The Present Perfect Tense. Настоящее совершенное время
 Heading to Corsica
 Cat
Cat George Washington
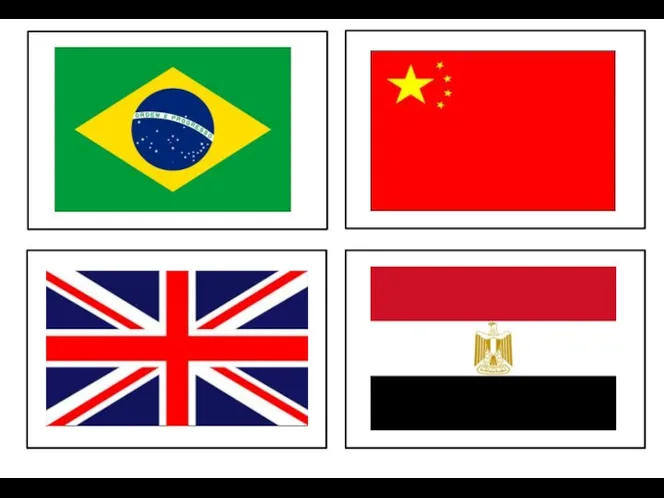 New English File Beginner
 Some/ any
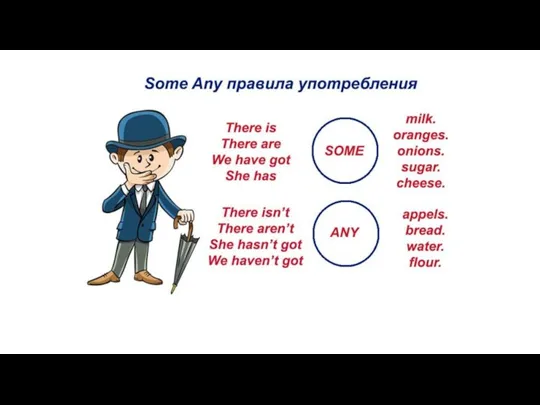 Some any, правила употребления
 The United Kingdom of Great Britain and Northern Ireland
 Guess these body idioms
 Cities in Кazakhstan
 Present simple. Настоящее простое время
 American Christmas
 Jaundice.The Gerund. Герундий - это неличная форма глагола
 Spotlight 5. Module 9. Modern living
 Время Past Continuous Tense
 Review of Past Tenses
 Enjoy English. School uniform (Lesson 13)
 Word formation
 Kant and Нegel. A comparative study on the notion of science and integral understanding of reality
 Тell us 3 things
 Giving directions in the game
 Dominican Republic
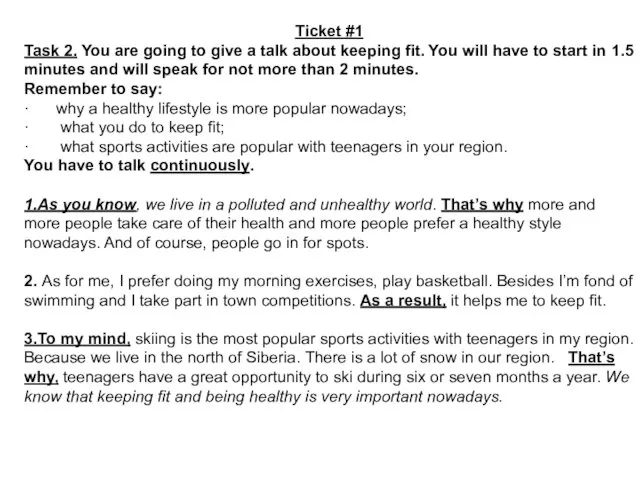 Oral topics in English. 8th grade
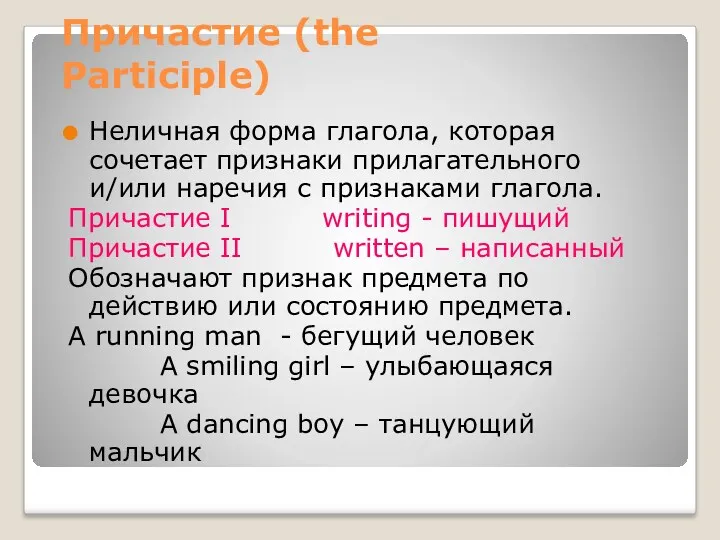 Причастие в английском языке
 Countries and nationalities
 Idioms and words connected to the theme of music
 Spotlight 7. Module 7. In the spotlight