- Macroeconomic environment and perspectives in Colombia

Содержание
- 2. Table of contents International context 1 Macroeconomic, fiscal situation, and perspectives 2 Colombia in the regional
- 3. International Context
- 4. The United States has consolidated its economic recovery… Source: Bureau of Economic Analysis y WEO abril
- 5. ... with a continued decline in the unemployment rate. However, despite a small uptick, inflation remains
- 6. The Euro Zone continues its recovery but with a weak dynamism Euro-zone Growth Source: IMF –
- 7. However, a very disimilar performance persists Growth of main countries in the Euro-zone Source: IMF –
- 8. The measures taken by the ECB have reduced, but not eliminated, the risk of deflation Source:
- 9. As for the emerging world, the fall in commodity prices has been widespread but there has
- 10. ... with an increase in risk perception, despite an important declining from the peak of 506
- 11. That in turn led to a depreciation of major currencies, with the Colombian peso and Brazilian
- 12. With a notable slowdown led by China, although the most unstable area is Latin America ...
- 13. ... Where the most affected countries were Venezuela, Brazil and Ecuador ... Source: FMI. Economic Growth
- 14. A major change in growth leadership with India’s service economy in first place instead of China,
- 15. Where are we coming from? – A long term view
- 16. Colombia has transformed from a low to an upper middle income economy Source: IMF and World
- 17. Inflation and unemployment rates have fallen from the two-digit levels from two decades ago Source: Colombian
- 18. Security indicators have also drastically improved… Source: Colombian Defense Ministry.
- 19. …As the levels of poverty and extreme poverty Monetary Poverty Extreme Monetary Poverty Source: Colombian National
- 20. Inequality, meanwhile, has remained relatively constant Inequality Source: Colombian National Institute of Statistics. DANE.
- 21. Currently, debt is mainly in local currency, which reduces the external exposure of the country National
- 22. The Colombian economy has gone from being purely rural, specializing in coffee, to a service oriented
- 23. While the amount of exports have grown substantially, it has remained relatively stable as share of
- 24. Exports are still concentrated in traditional products. The top product was coffee in the 70s and
- 25. Most imports are still intermediate goods, although consumer goods have gained ground Import’s Composition Source: Colombian
- 26. Macroeconomic, fiscal context, and perspectives
- 27. Macroeconomic and fiscal context Perspectives
- 28. Macroeconomic and fiscal context Perspectives
- 29. Source: U.S. Energy Information Aministration (EIA). Oil Price Evolution The oil price experienced a reduction close
- 30. This has had an impact on the risk perception of Colombia ... Source: Bloomberg. Emerging Markets
- 31. And on the sharp depreciation of the peso, reaching historical values and strongly rising currency volatility,
- 32. Which has fueled an acceleration of inflation thru tradable goods in the economy Source: Colombian National
- 33. ... El Niño caused an increase on food inflation and pushed general inflation to levels above
- 34. Motivating contractionary monetary policy response in order to anchor expectations Source: Colombian National Institute of Statistics.
- 35. The oil and monetary shock had an impact on all sectors of the economy Supply-side annual
- 36. On the demand side, investment has slowed down to negative levels of growth for the second
- 37. Consequently, since the middle of last year, Colombia began experimenting clear signs of slowdown Annual Growth
- 38. In addition, the external imbalance persists with a current account deficit of -6.4% in 2015 reducing
- 39. Trade Balance, monthly exports and imports (12 months cumulative) In part due to the marked deterioration
- 40. But unlike 1999, the CA has been financed properly, preventing further internal adjustment. However, It’s cause
- 41. Debt as a share of the GDP (%) The country's external debt has risen sharply to
- 42. Share of foreign funds as holders of TES While capital inflows of portfolio increase fiscal vulnerability
- 43. On the fiscal front, revenues have fallen substantially pushing the government deficit to an estimated 3.9%
- 44. While experts have said that the fiscal needs for 2020 are of about 3.3% of GDP
- 45. According to the government, the structural imbalance for 2016 will be approximately 2.1%, and the oil
- 46. Tax revenue in the country is low when compared with other countries in the region and
- 47. Taxation of natural persons is low because the threshold from which is taxed is very high,
- 48. Macroeconomic and fiscal situation Perspectives
- 49. The slowdown is deepening, with the exception of the industrial sector Cement shipments Retail Industrial production
- 50. The economy faces high levels of industrial confidence paired with historical low levels of consumer confidence
- 51. During 2016 the country will experience the worst economic growth since the financial crisis. By 2017
- 52. The slowdown will be experienced in almost all sectors. Real GDP Growth (%) Source: Colombian National
- 53. Colombia in the regional context
- 54. Despite the economic slowdown, Colombia continues to lead in terms of growth in the region alongside
- 55. The Colombian peso is among the most depreciated currencies in the region alongside Mexico Source: Bloomberg.
- 56. While inflation has risen more than in other countries in the region except Brazil Source: National
- 57. However, the unemployment rate has not changed significantly and remains in the single digits. Unemployment Rate
- 58. Regarding the external imbalance, the dynamic has been heterogeneous in the region, where Colombia suffered the
- 59. It is expected that by 2016 the Colombian economy will continue to lead in terms of
- 60. In the long term it is expected that Mexico will be the country with the largest
- 61. In fact, Venezuela will be the only country that will not increase its per capita income
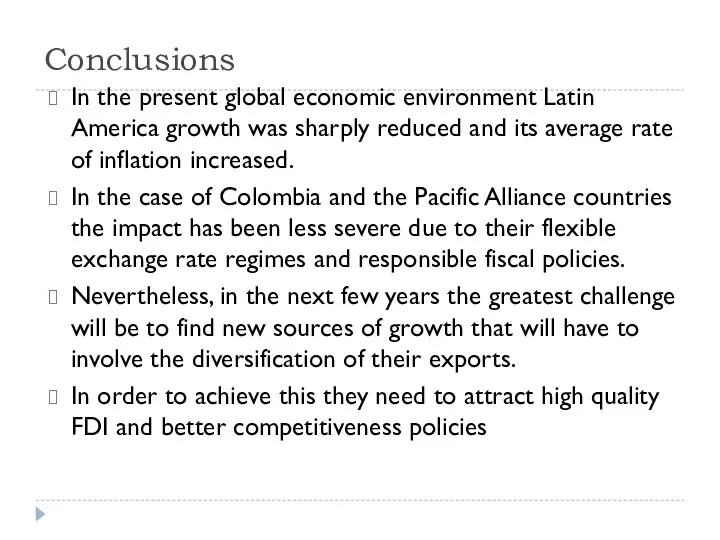
- 62. Conclusions In the present global economic environment Latin America growth was sharply reduced and its average
- 64. Скачать презентацию
Table of contents
International context
1
Macroeconomic, fiscal situation, and perspectives
2
Colombia in the regional
Table of contents
International context
1
Macroeconomic, fiscal situation, and perspectives
2
Colombia in the regional
International Context
International Context
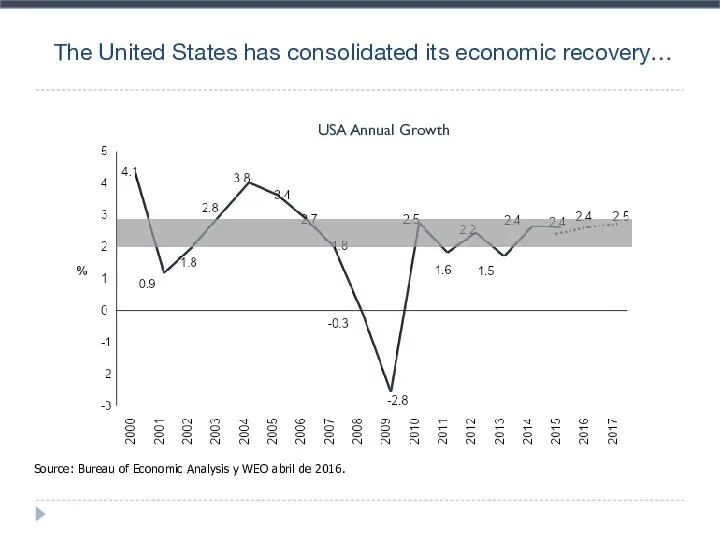
The United States has consolidated its economic recovery…
Source: Bureau of Economic
The United States has consolidated its economic recovery…
Source: Bureau of Economic
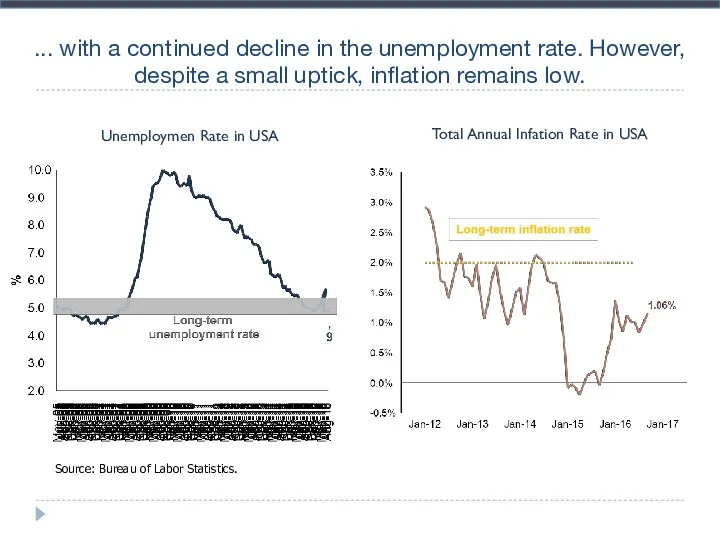
... with a continued decline in the unemployment rate. However, despite
... with a continued decline in the unemployment rate. However, despite
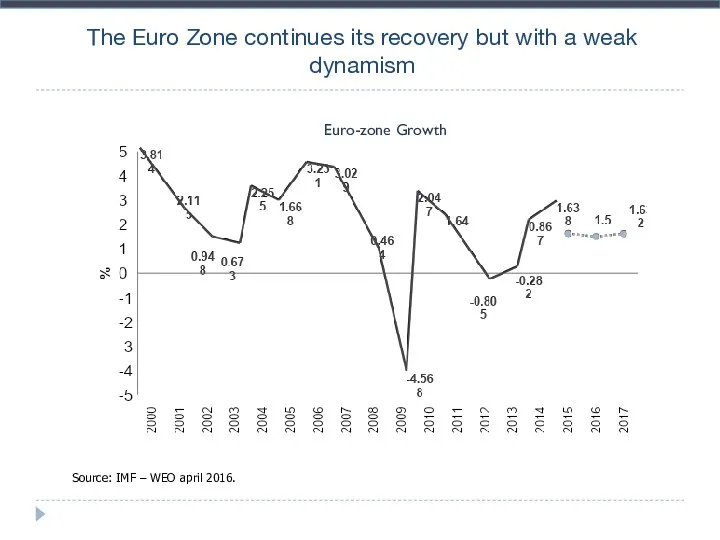
The Euro Zone continues its recovery but with a weak dynamism
Euro-zone
The Euro Zone continues its recovery but with a weak dynamism
Euro-zone
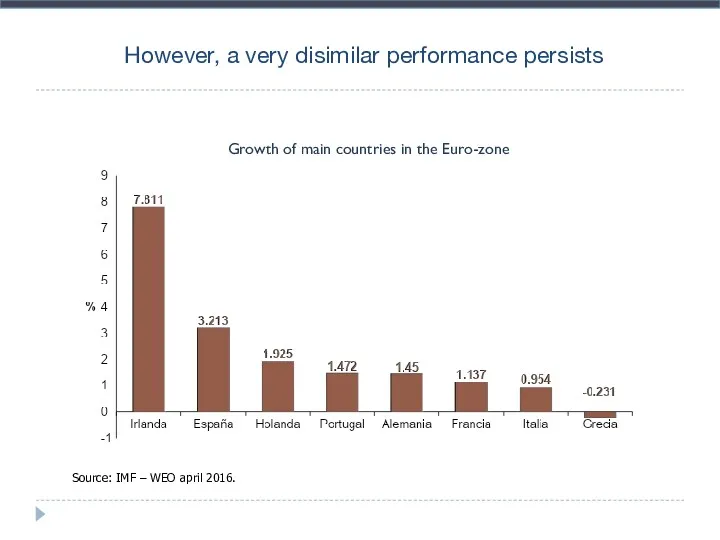
However, a very disimilar performance persists
Growth of main countries in the
However, a very disimilar performance persists
Growth of main countries in the
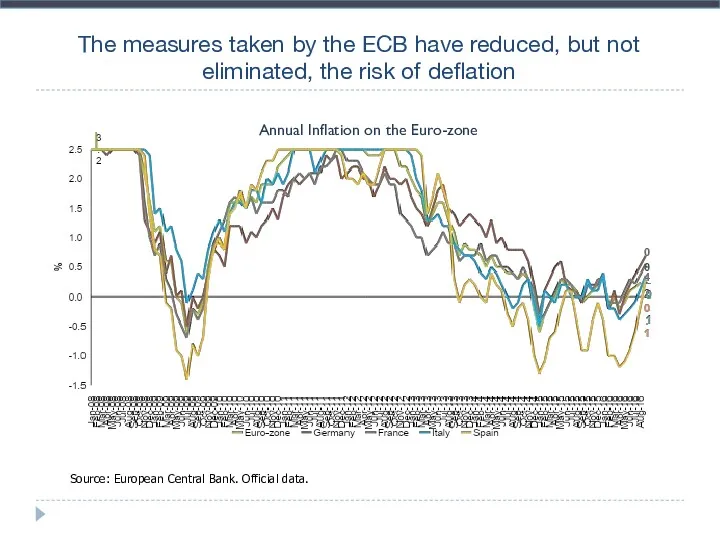
The measures taken by the ECB have reduced, but not eliminated,
The measures taken by the ECB have reduced, but not eliminated,
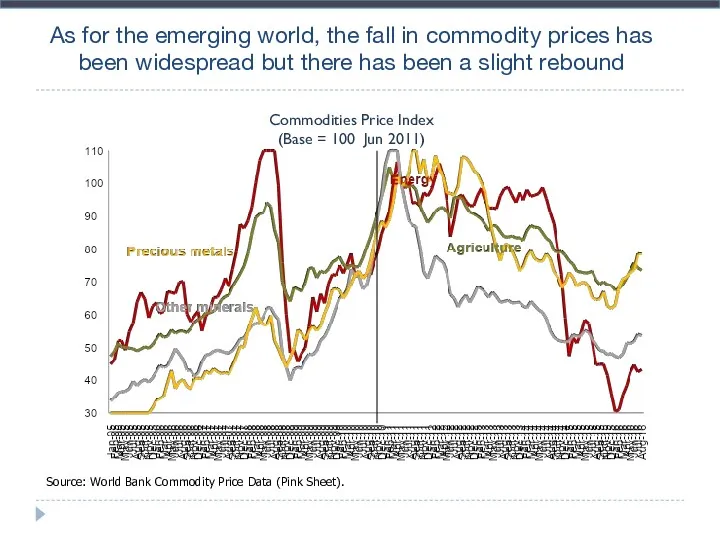
As for the emerging world, the fall in commodity prices has
As for the emerging world, the fall in commodity prices has
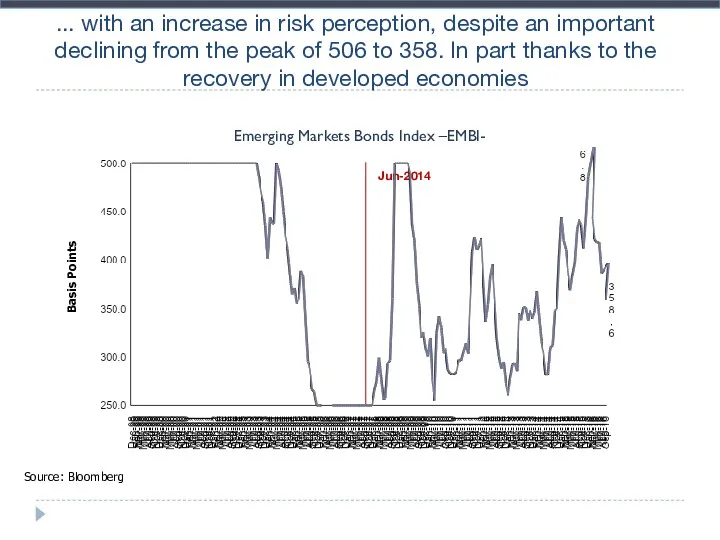
... with an increase in risk perception, despite an important declining
... with an increase in risk perception, despite an important declining
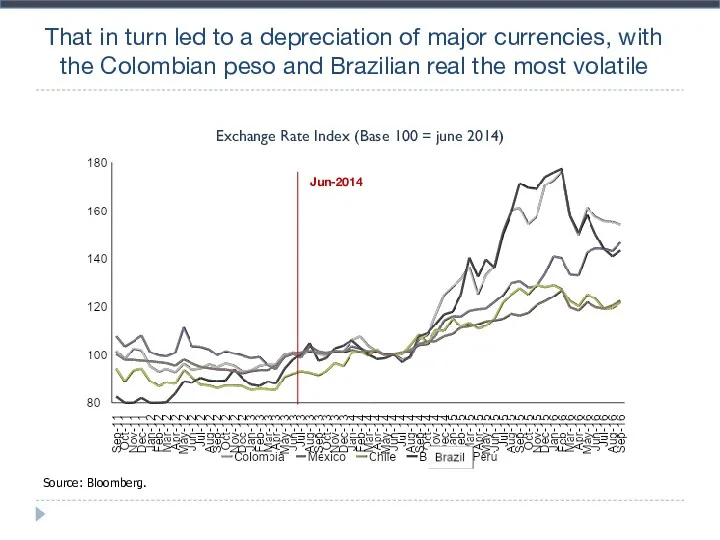
That in turn led to a depreciation of major currencies, with
That in turn led to a depreciation of major currencies, with
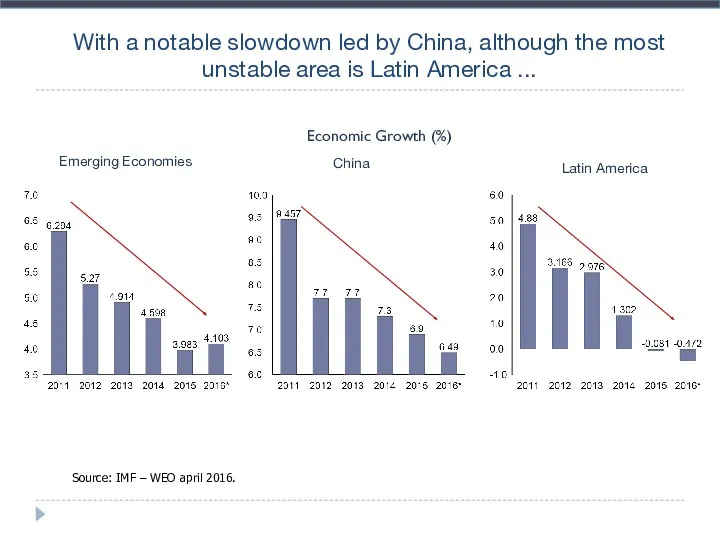
With a notable slowdown led by China, although the most unstable
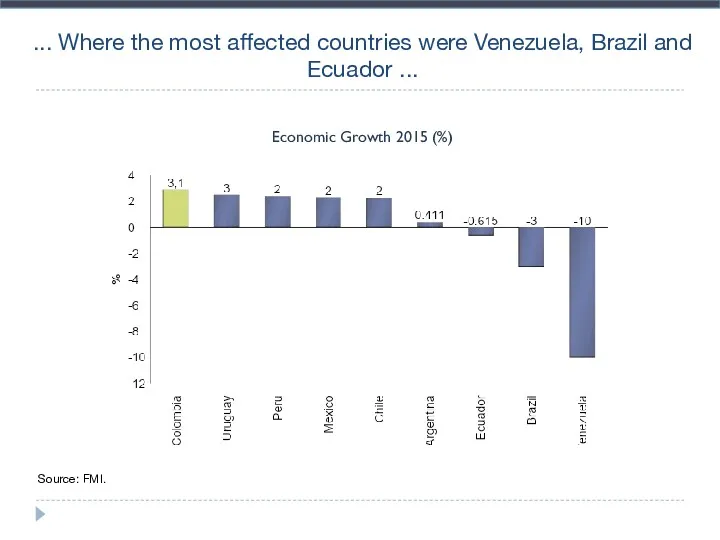
... Where the most affected countries were Venezuela, Brazil and Ecuador
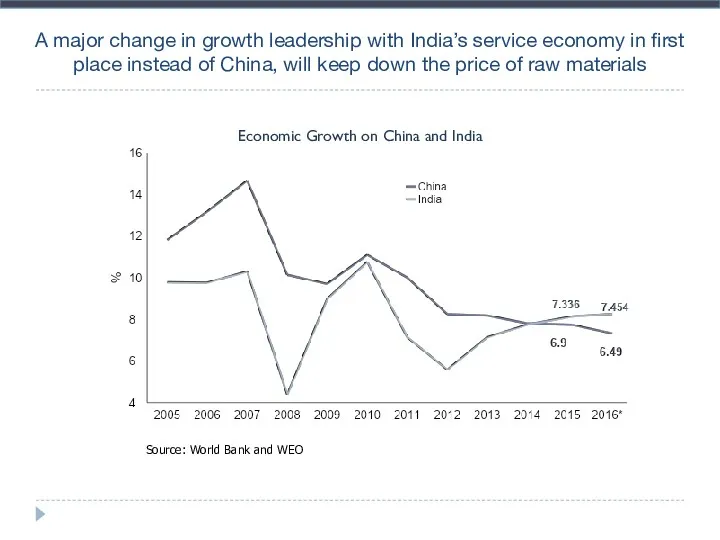
A major change in growth leadership with India’s service economy in
A major change in growth leadership with India’s service economy in

Where are we coming from? – A long term view
Where are we coming from? – A long term view
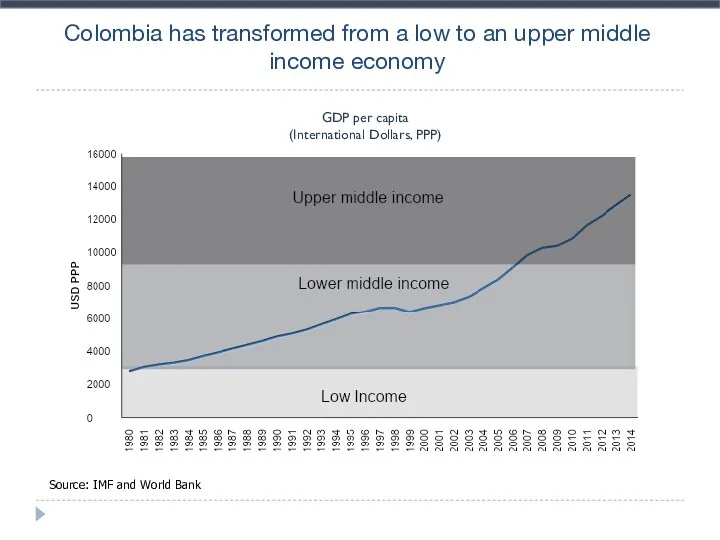
Colombia has transformed from a low to an upper middle income
Colombia has transformed from a low to an upper middle income
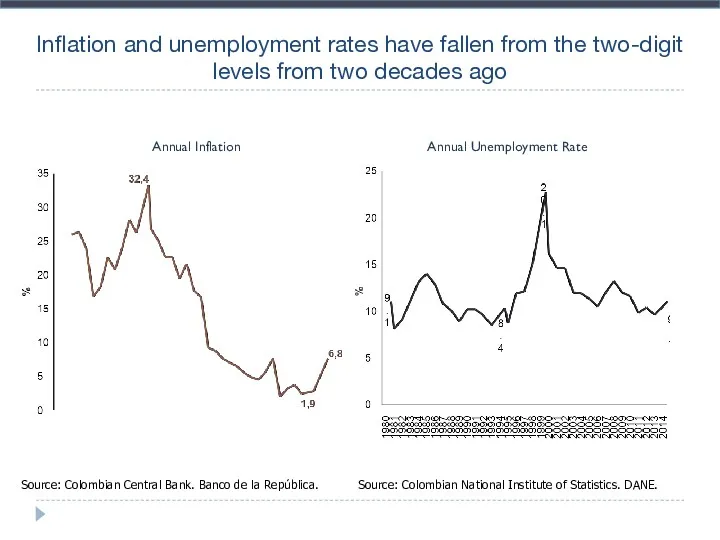
Inflation and unemployment rates have fallen from the two-digit levels from
Inflation and unemployment rates have fallen from the two-digit levels from
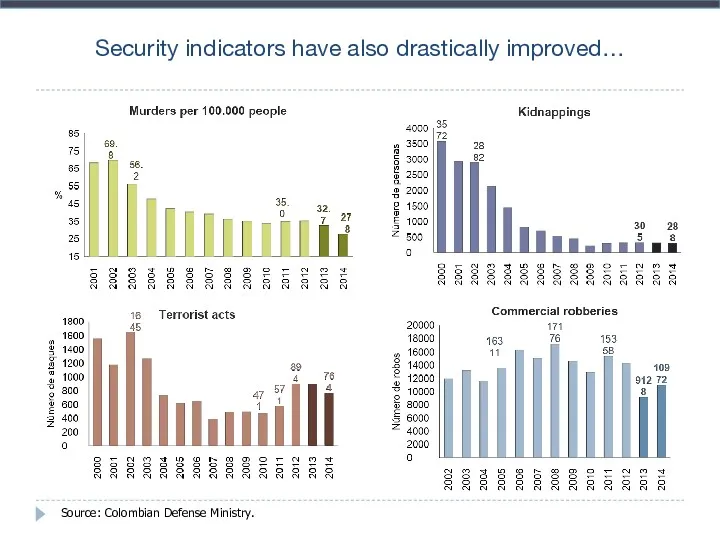
Security indicators have also drastically improved…
Source: Colombian Defense Ministry.
Security indicators have also drastically improved…
Source: Colombian Defense Ministry.
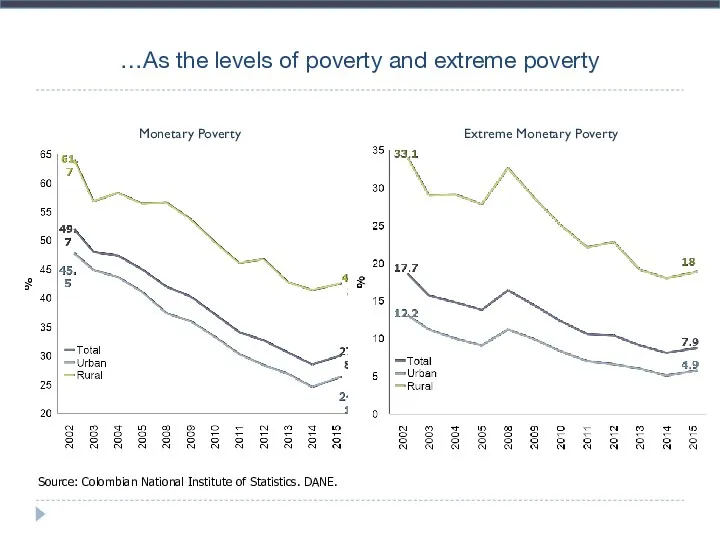
…As the levels of poverty and extreme poverty
Monetary Poverty
Extreme Monetary Poverty
Source:
…As the levels of poverty and extreme poverty
Monetary Poverty
Extreme Monetary Poverty
Source:
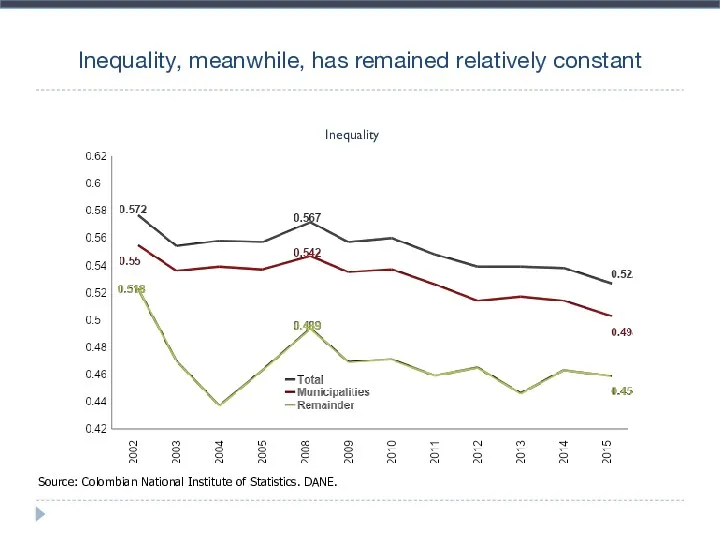
Inequality, meanwhile, has remained relatively constant
Inequality
Source: Colombian National Institute of Statistics.
Inequality, meanwhile, has remained relatively constant
Inequality
Source: Colombian National Institute of Statistics.

Currently, debt is mainly in local currency, which reduces the external
Currently, debt is mainly in local currency, which reduces the external
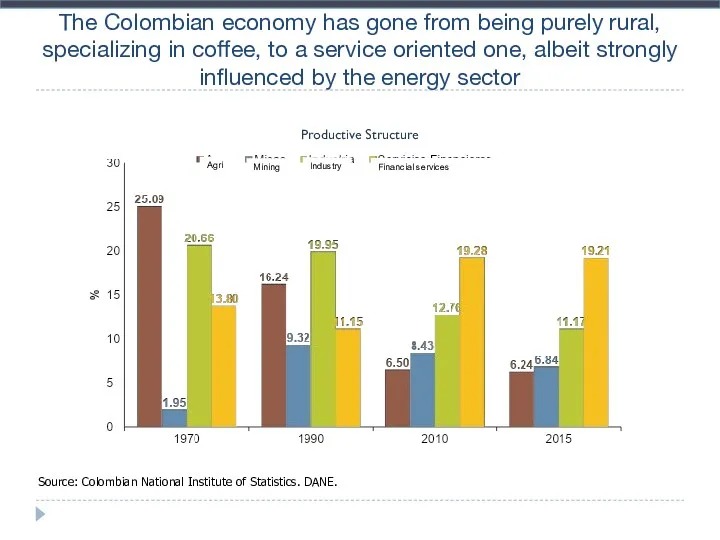
The Colombian economy has gone from being purely rural, specializing in
The Colombian economy has gone from being purely rural, specializing in
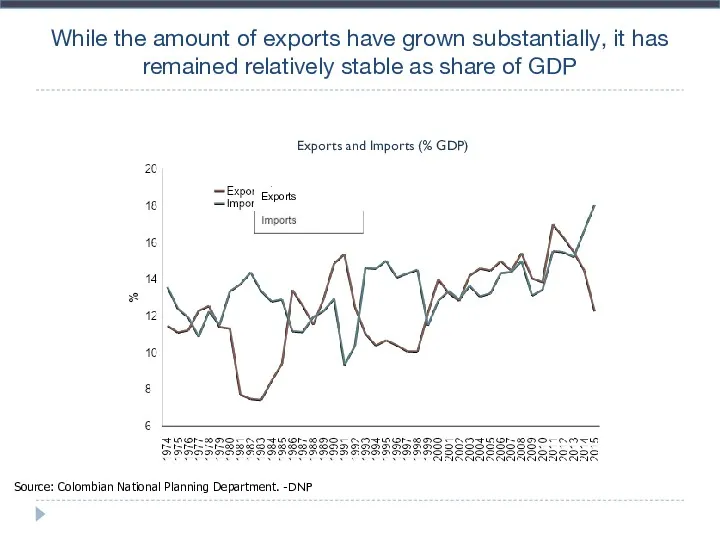
While the amount of exports have grown substantially, it has remained
While the amount of exports have grown substantially, it has remained
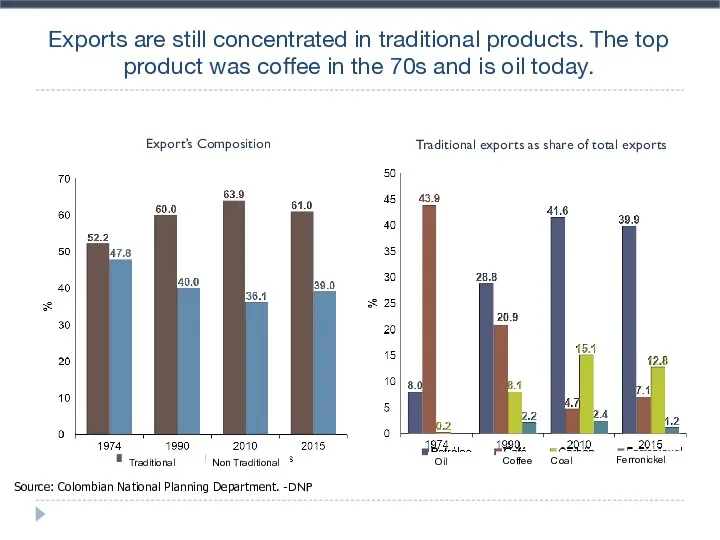
Exports are still concentrated in traditional products. The top product was
Exports are still concentrated in traditional products. The top product was
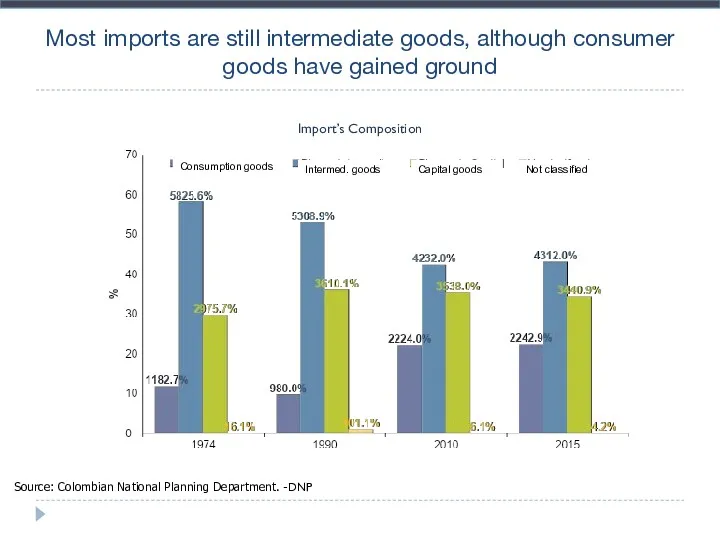
Most imports are still intermediate goods, although consumer goods have gained
Most imports are still intermediate goods, although consumer goods have gained
Macroeconomic, fiscal context, and perspectives
Macroeconomic, fiscal context, and perspectives
Macroeconomic and fiscal context
Perspectives
Macroeconomic and fiscal context
Perspectives
Macroeconomic and fiscal context
Perspectives
Macroeconomic and fiscal context
Perspectives
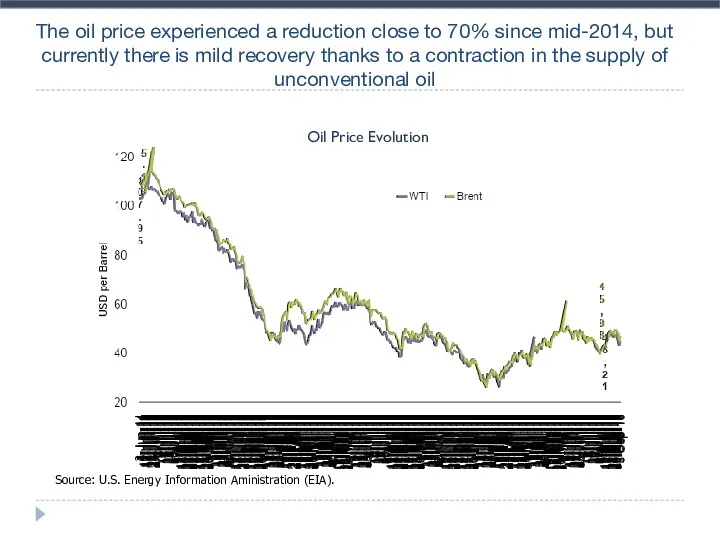
Source: U.S. Energy Information Aministration (EIA).
Oil Price Evolution
The oil price experienced
Source: U.S. Energy Information Aministration (EIA).
Oil Price Evolution
The oil price experienced
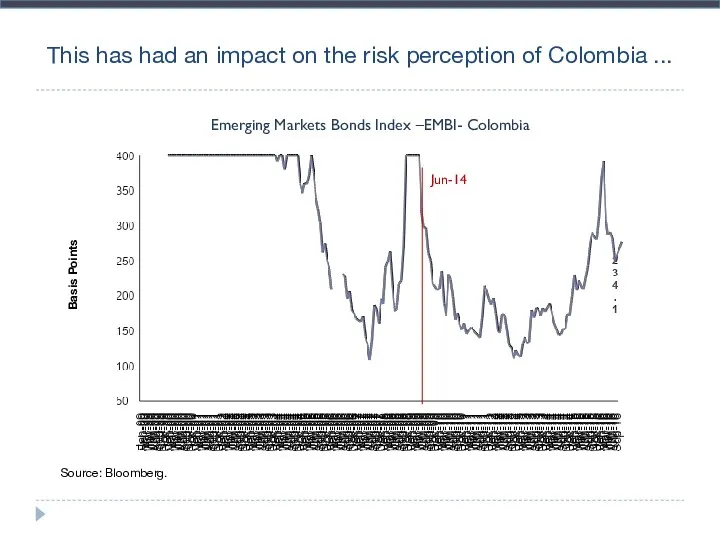
This has had an impact on the risk perception of Colombia
This has had an impact on the risk perception of Colombia
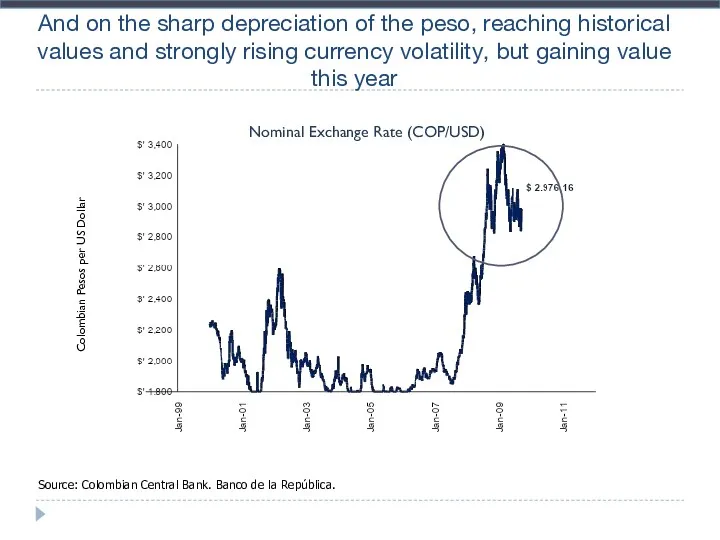
And on the sharp depreciation of the peso, reaching historical values
And on the sharp depreciation of the peso, reaching historical values
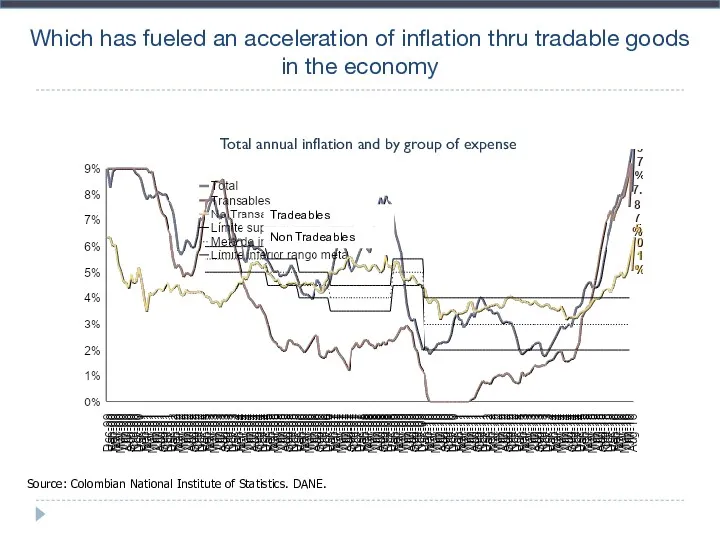
Which has fueled an acceleration of inflation thru tradable goods in
Which has fueled an acceleration of inflation thru tradable goods in
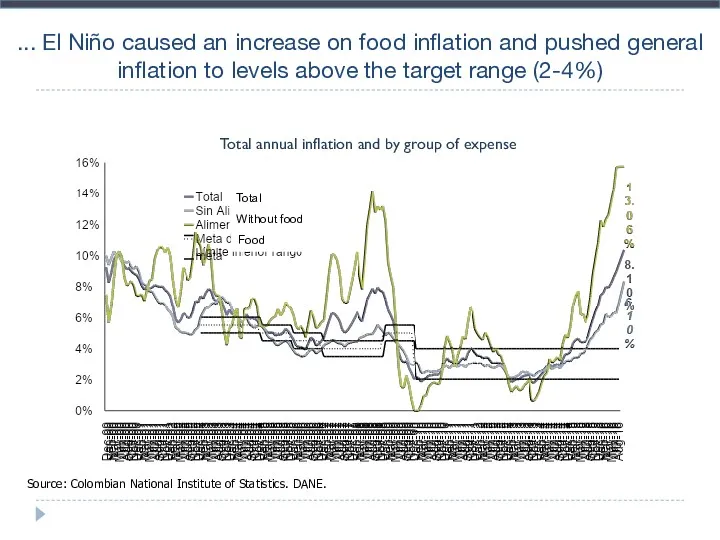
... El Niño caused an increase on food inflation and pushed
... El Niño caused an increase on food inflation and pushed
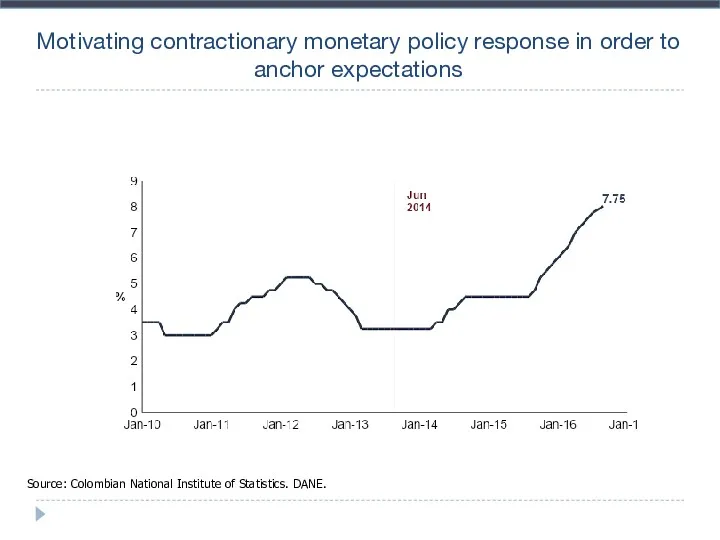
Motivating contractionary monetary policy response in order to anchor expectations
Source: Colombian
Motivating contractionary monetary policy response in order to anchor expectations
Source: Colombian
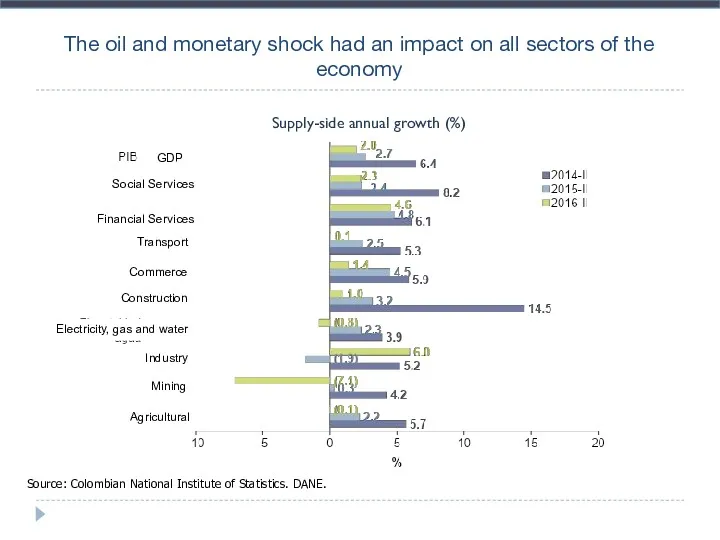
The oil and monetary shock had an impact on all sectors
The oil and monetary shock had an impact on all sectors
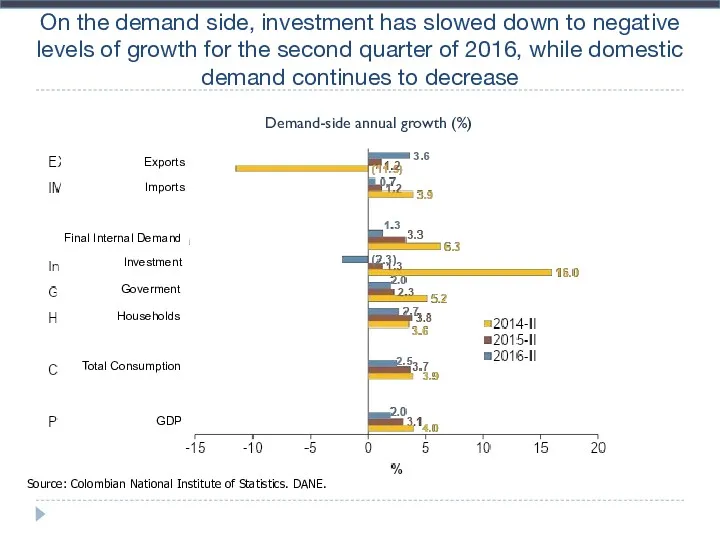
On the demand side, investment has slowed down to negative levels
On the demand side, investment has slowed down to negative levels
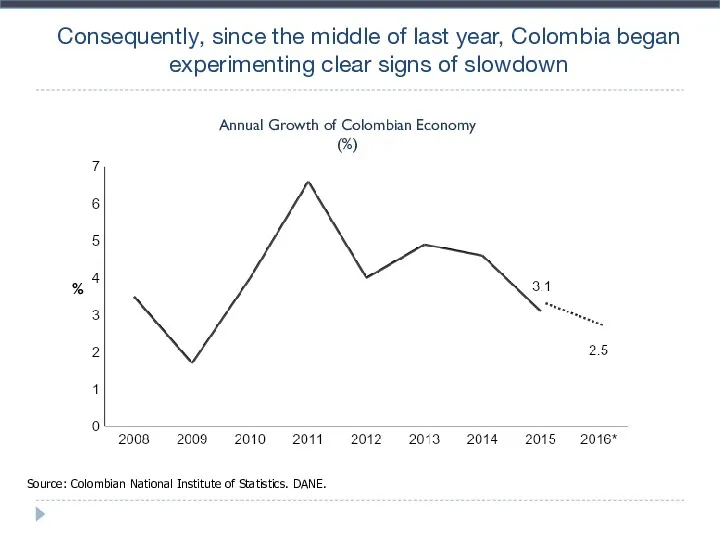
Consequently, since the middle of last year, Colombia began experimenting clear
Consequently, since the middle of last year, Colombia began experimenting clear
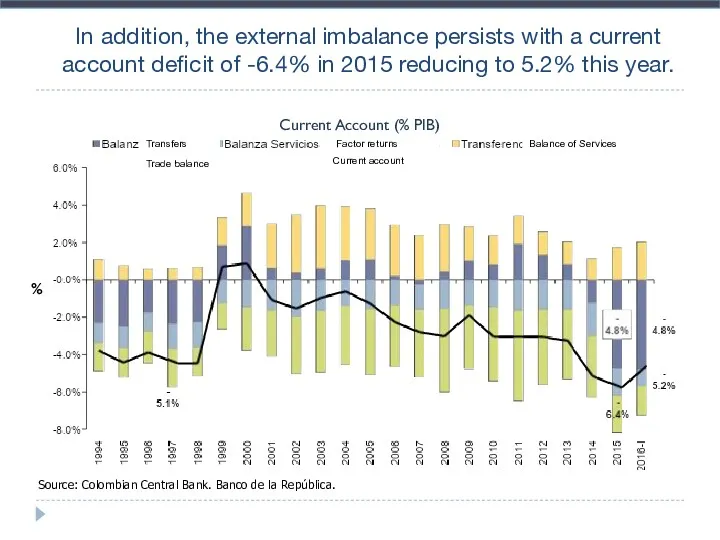
In addition, the external imbalance persists with a current account deficit
In addition, the external imbalance persists with a current account deficit
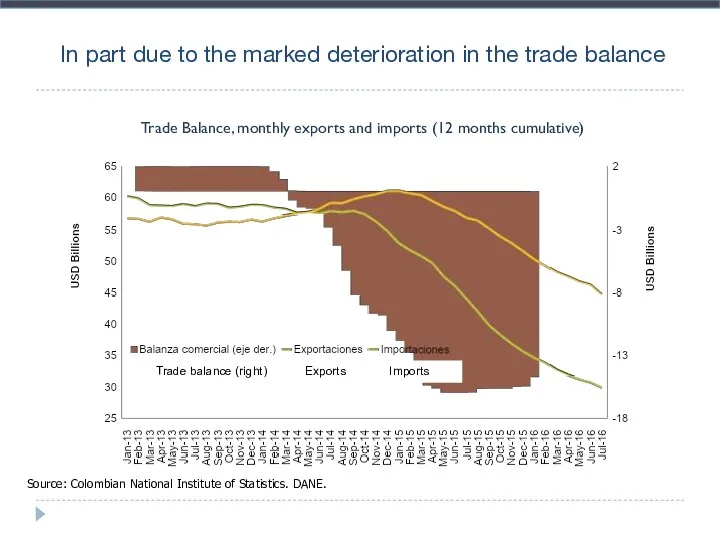
Trade Balance, monthly exports and imports (12 months cumulative)
In part due
Trade Balance, monthly exports and imports (12 months cumulative)
In part due
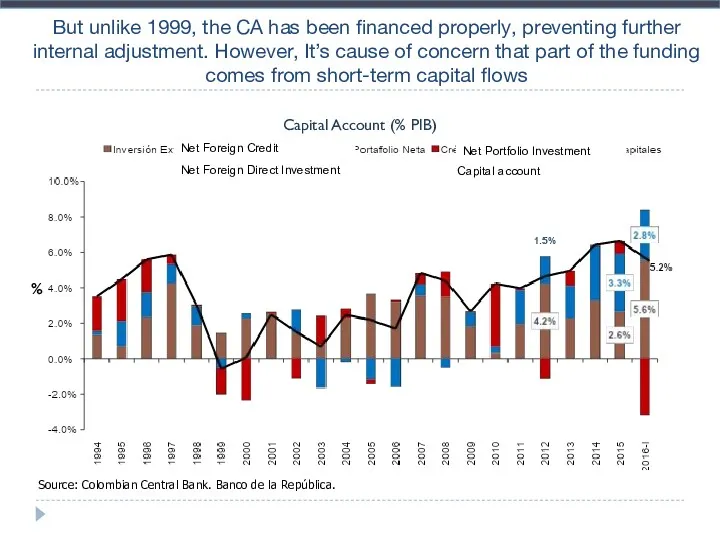
But unlike 1999, the CA has been financed properly, preventing further
But unlike 1999, the CA has been financed properly, preventing further
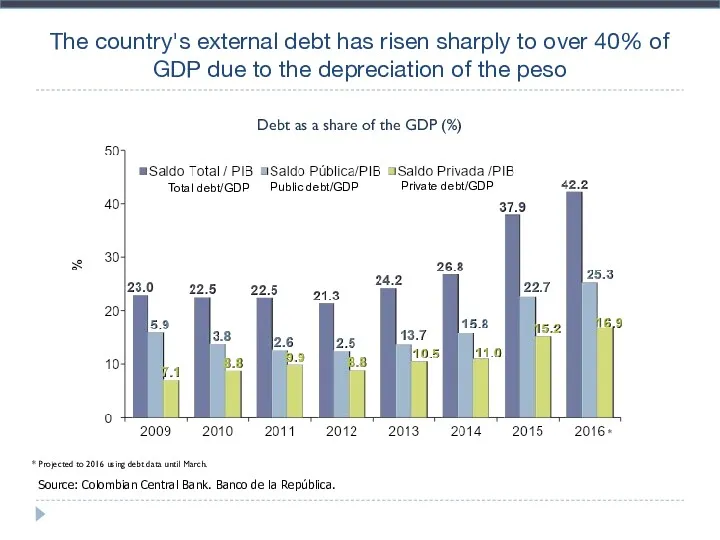
Debt as a share of the GDP (%)
The country's external debt
Debt as a share of the GDP (%)
The country's external debt
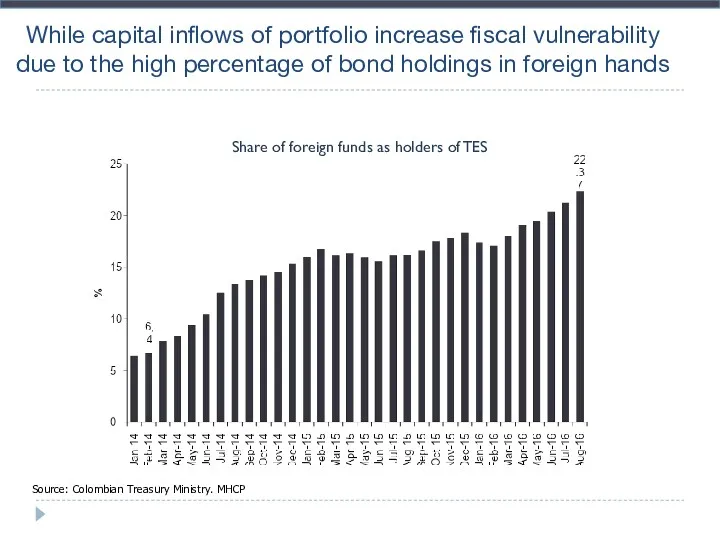
Share of foreign funds as holders of TES
While capital inflows of
Share of foreign funds as holders of TES
While capital inflows of
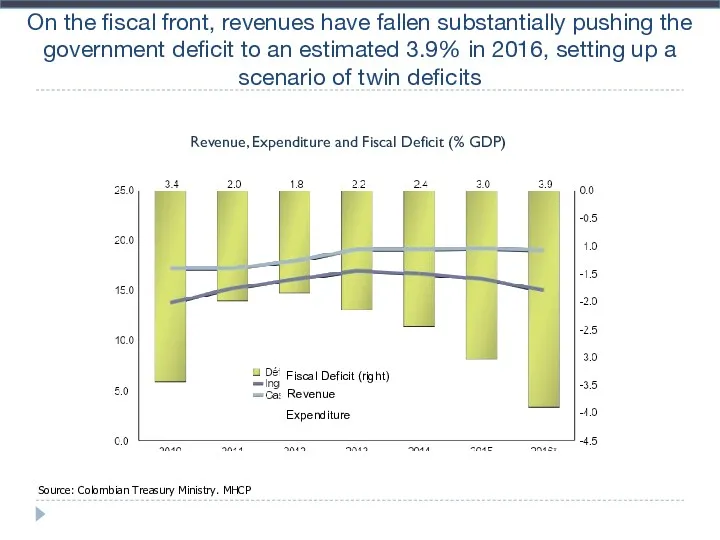
On the fiscal front, revenues have fallen substantially pushing the government
On the fiscal front, revenues have fallen substantially pushing the government
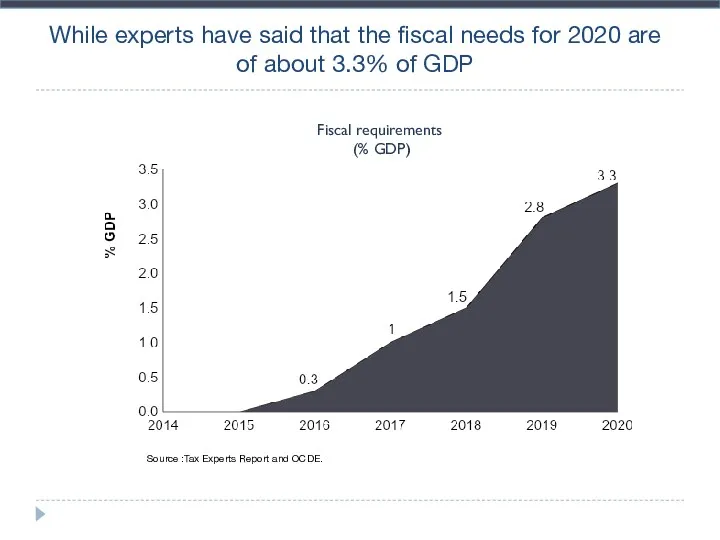
While experts have said that the fiscal needs for 2020 are
While experts have said that the fiscal needs for 2020 are
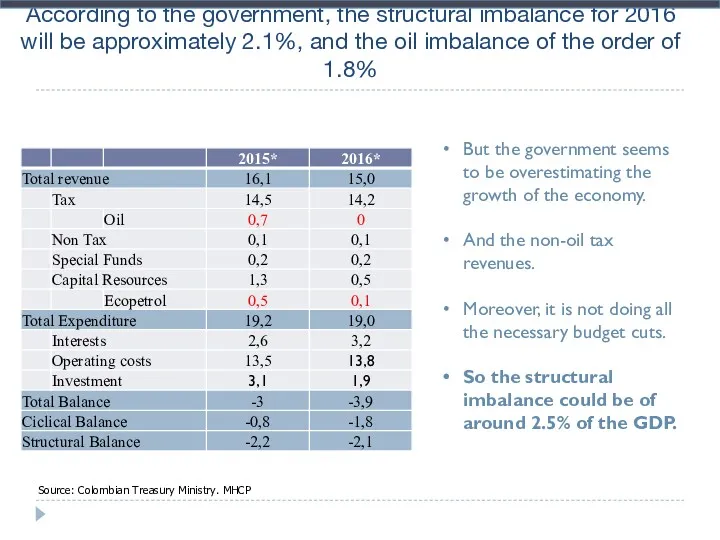
According to the government, the structural imbalance for 2016 will be
According to the government, the structural imbalance for 2016 will be
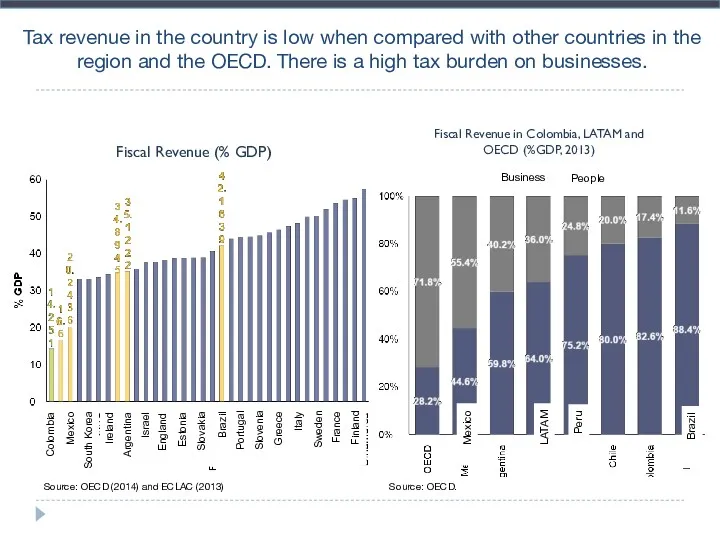
Tax revenue in the country is low when compared with other
Tax revenue in the country is low when compared with other
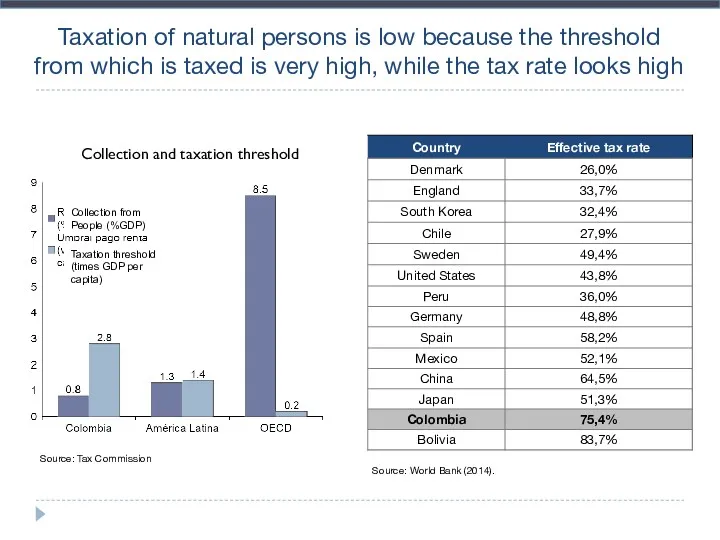
Taxation of natural persons is low because the threshold from which
Taxation of natural persons is low because the threshold from which
Macroeconomic and fiscal situation
Perspectives
Macroeconomic and fiscal situation
Perspectives
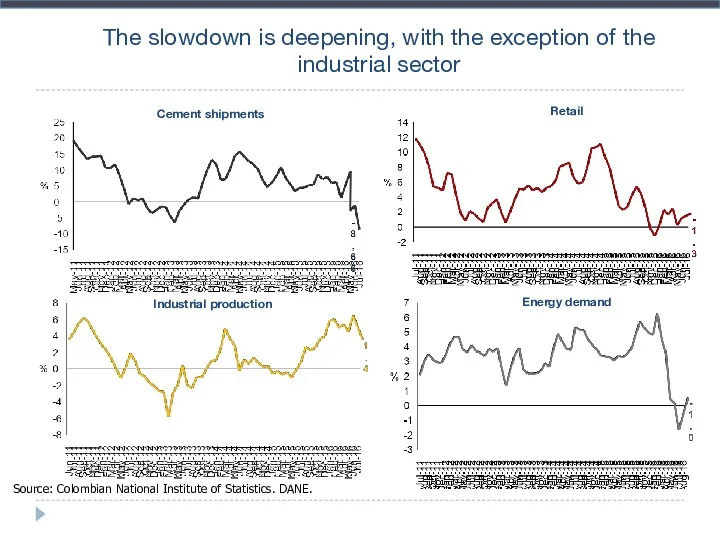
The slowdown is deepening, with the exception of the industrial sector
Cement
The slowdown is deepening, with the exception of the industrial sector
Cement
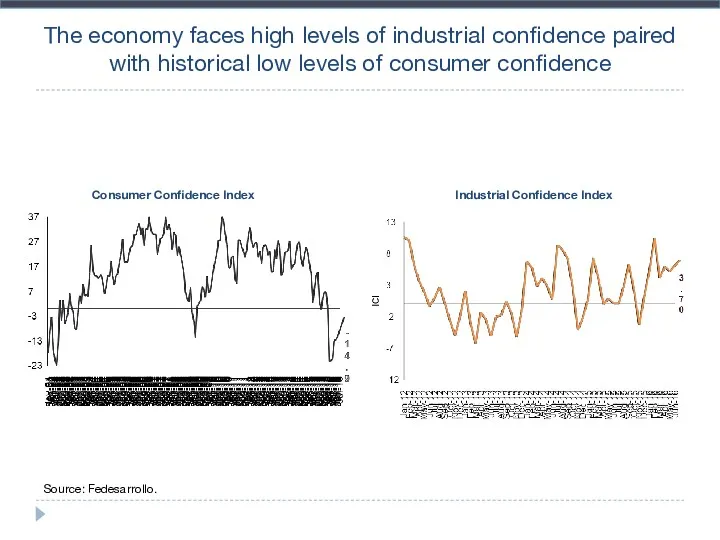
The economy faces high levels of industrial confidence paired with historical
The economy faces high levels of industrial confidence paired with historical
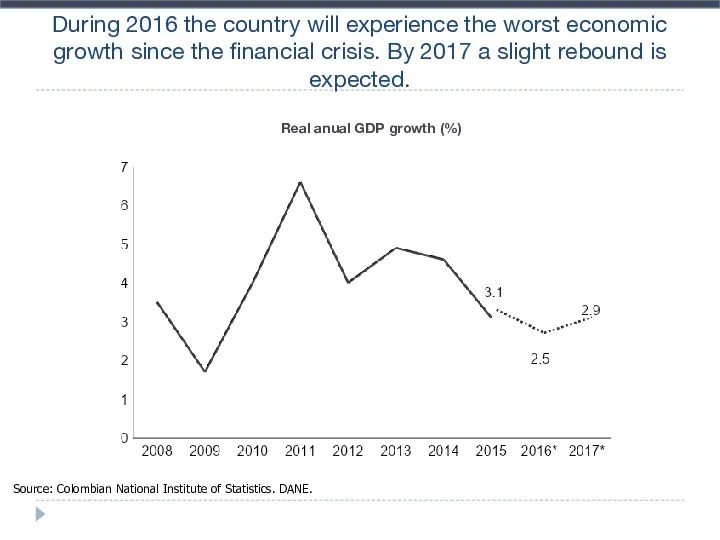
During 2016 the country will experience the worst economic growth since
During 2016 the country will experience the worst economic growth since
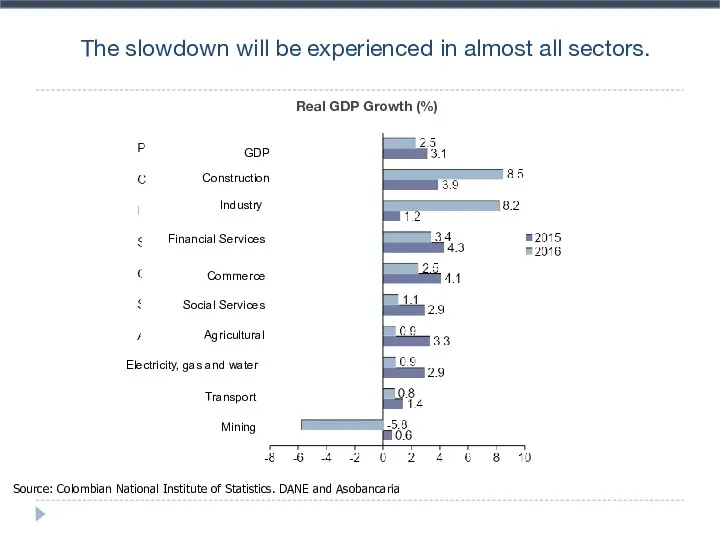
The slowdown will be experienced in almost all sectors.
Real GDP Growth
The slowdown will be experienced in almost all sectors.
Real GDP Growth
Colombia in the regional context
Colombia in the regional context
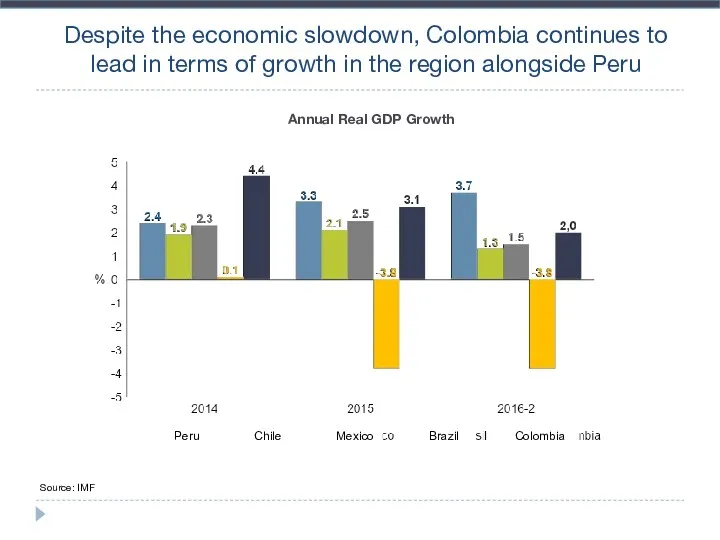
Despite the economic slowdown, Colombia continues to lead in terms of
Despite the economic slowdown, Colombia continues to lead in terms of
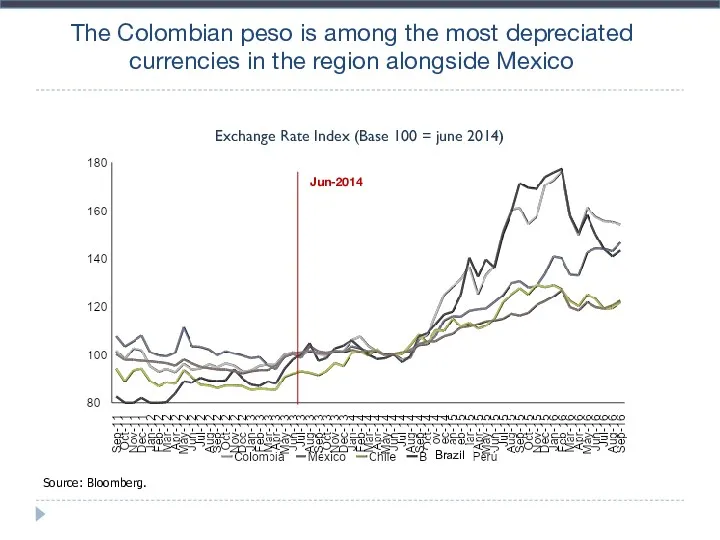
The Colombian peso is among the most depreciated currencies in the
The Colombian peso is among the most depreciated currencies in the
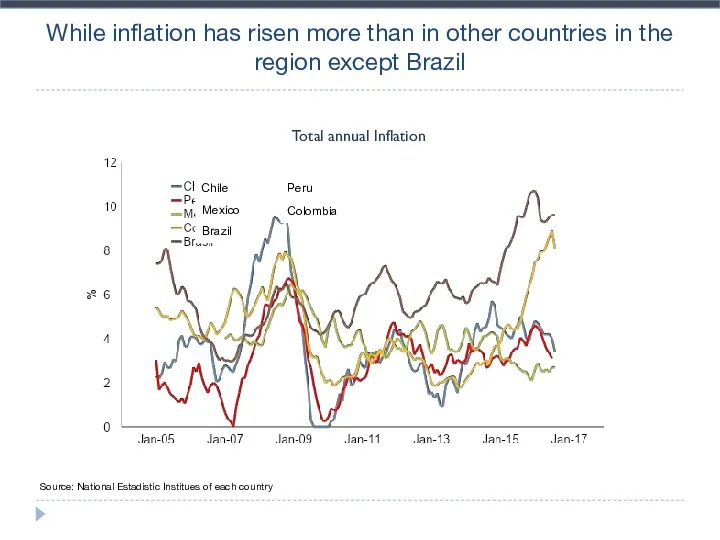
While inflation has risen more than in other countries in the
While inflation has risen more than in other countries in the
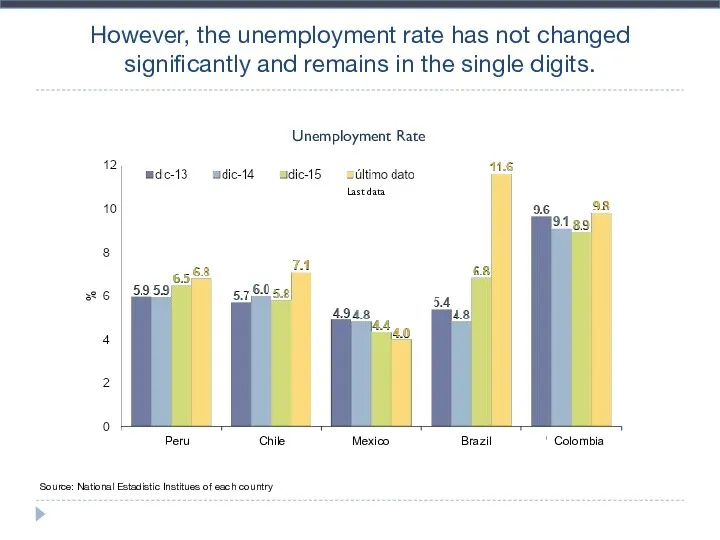
However, the unemployment rate has not changed significantly and remains in
However, the unemployment rate has not changed significantly and remains in
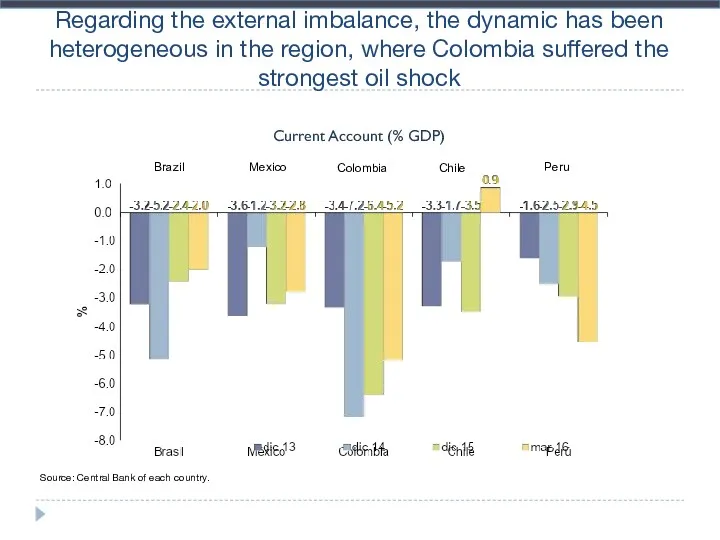
Regarding the external imbalance, the dynamic has been heterogeneous in the
Regarding the external imbalance, the dynamic has been heterogeneous in the
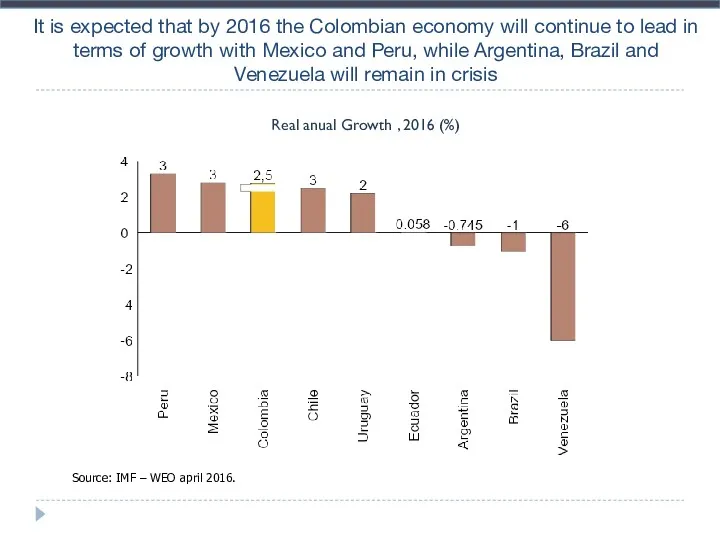
It is expected that by 2016 the Colombian economy will continue
It is expected that by 2016 the Colombian economy will continue
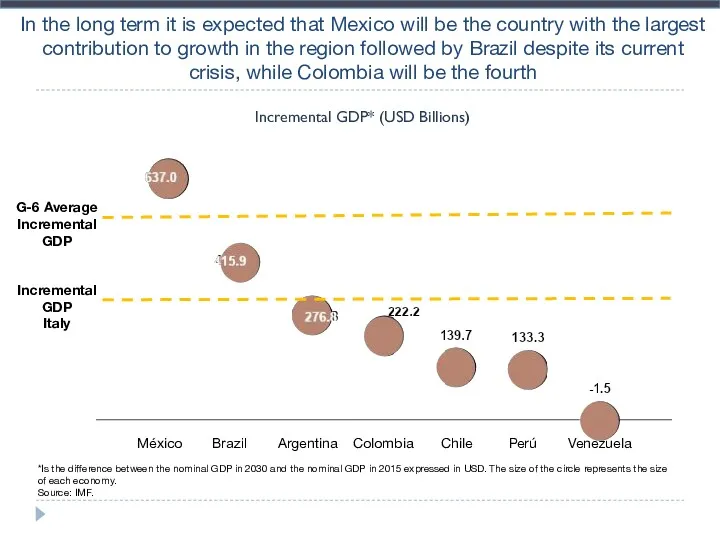
In the long term it is expected that Mexico will be
In the long term it is expected that Mexico will be
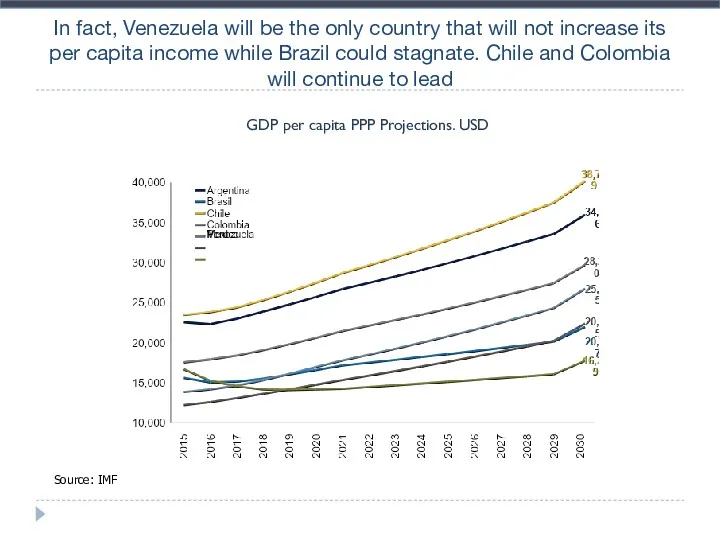
In fact, Venezuela will be the only country that will not
In fact, Venezuela will be the only country that will not
Conclusions
In the present global economic environment Latin America growth was sharply
Conclusions
In the present global economic environment Latin America growth was sharply
 Famous people and their countries
 Materials
 The Future Simple Tense (Будущее простое время)
 Thanksgiving Day
 Definite and indefinite articles
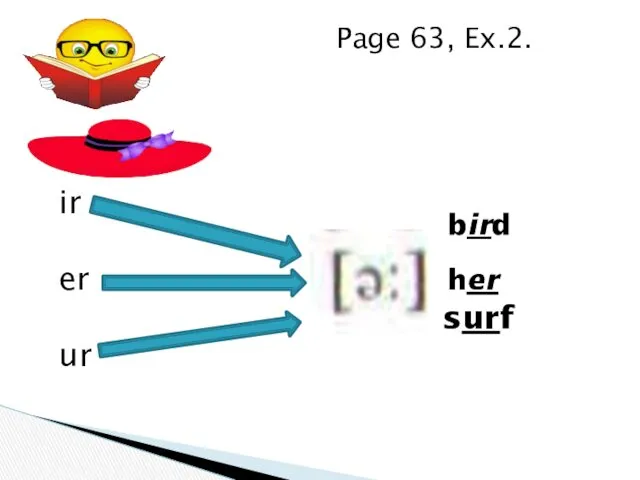 Ir, er, ou, ow, ur, wor, aw
 My working day
 Тренажёр. ОГЭ. Word Formation. Tasks 29-34
 The cooperative principle. Flouting the maxims
 Настольные игры на английском языке в Lingvo Park (2)
 Vowels and consonants
 Некоторые лексические проблемы перевода
 Present simple. Active or passive
 Correction of the essay #2
 Читаем по-английски. Гласные A, E, I, O, U
 Spotlight on English-speaking countries
 Other, another, the other, others
 Spotlight 10. Modal verbs, module 4
 Places of interest in Great Britain
 The sights of Donetsk. 9 класс
 Fashion and clothes
 My future profession
 People of different professions
 The Solar System
 Глагол. Активный залог. Present Simple/Present Continuous
 Road safety
 Australia
 Hobbies - an important part of human life