- Comparative analysis of gas and dust properties in comets of different dynamical groups

Содержание
- 2. Comparison of physical properties of the atmospheres and tails in the short- and long-period comets, including
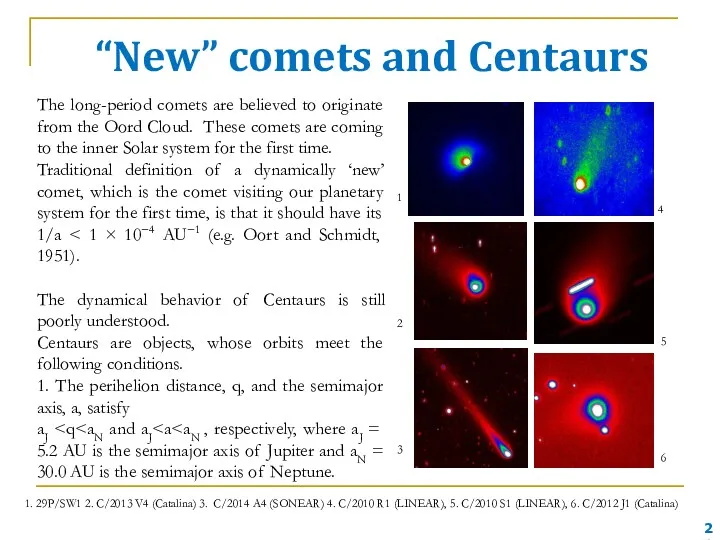
- 3. 1. 29P/SW1 2. C/2013 V4 (Catalina) 3. C/2014 A4 (SONEAR) 4. 67P/Churyumova-Gerasimenko, 5. C/2010 S1 (LINEAR),
- 4. Telescopes 6-m telescope SAO RAS (Russia) 4.1-m telescope SOAR (Chile) 2-m telescope (p. Terskol, Russia) 2-m
- 5. Methods Photometry Broad band filters BVR (heliocentric distances from 8 to 4 AU) Dust production rates
- 6. Methods Spectroscopy 29P/SW1 - 1.6 m Brazil C/2004 Q2 (Machholz) – 60 cm AAO C/2009 R1
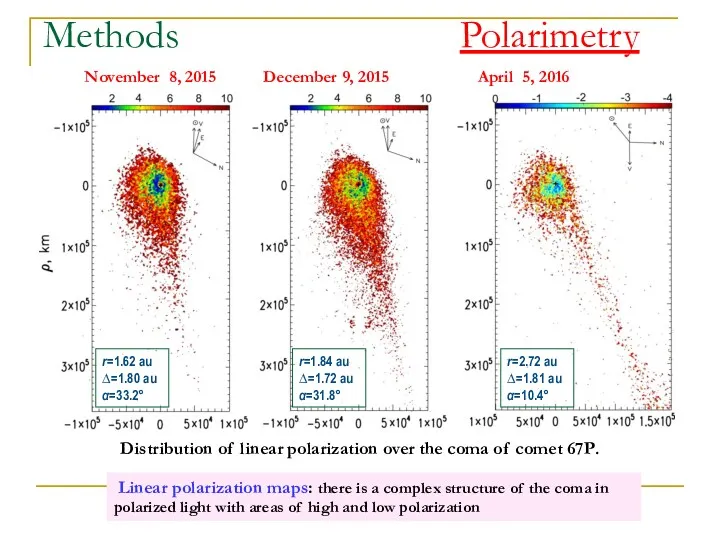
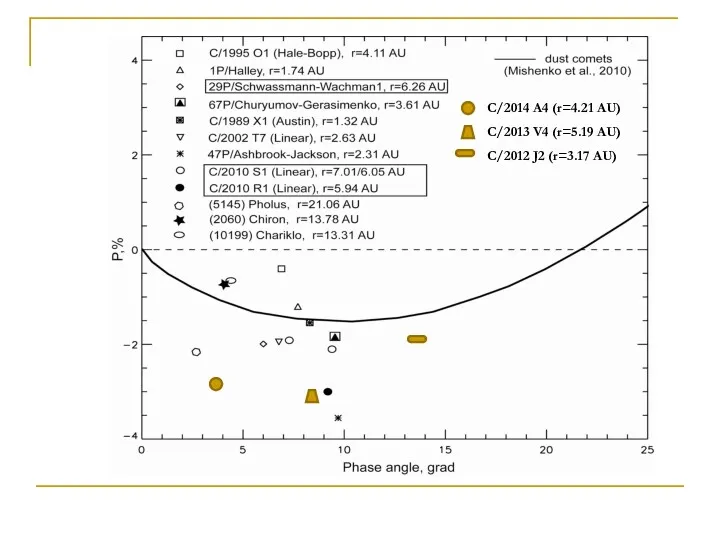
- 7. Methods Polarimetry CCD polarimetry of distant comets C/2010 S1 (LINEAR) and C/2010 R1 (LINEAR) at the
- 8. 67P/ Churyumov-Gerasimenko November 8, 2015 December 9, 2015 April 5, 2016 r=1.62 au r=1.84 au r=2.72
- 9. Methods Photometry Direct image Relative isophots Image treated of the comet by digital filters Two jets
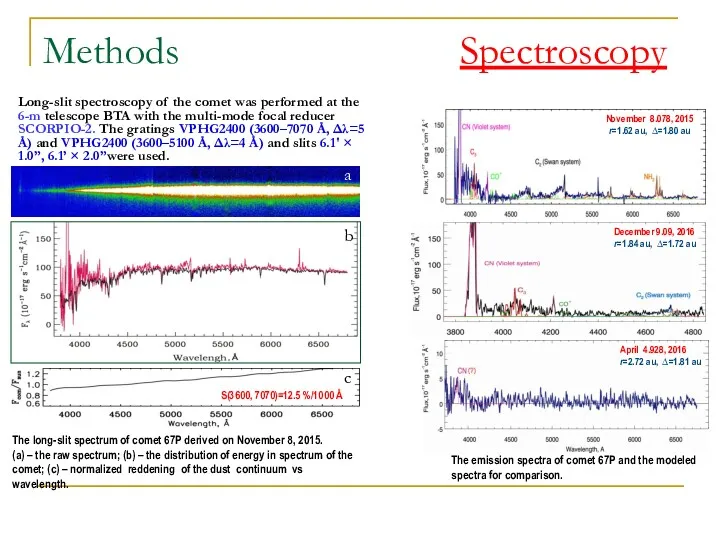
- 10. Methods Spectroscopy Long-slit spectroscopy of the comet was performed at the 6-m telescope BTA with the
- 11. Gas production rates in comet 67P Summary: CN, C2, C3, and NH2 emissions were identified in
- 12. r=1.62 au ∆=1.80 au α=33.2° r=1.84 au ∆=1.72 au α=31.8° r=2.72 au ∆=1.81 au α=10.4° November
- 13. Linear polarization maps in details Sun tail Sun November 8, 2015 December 9, 2015 April 5,
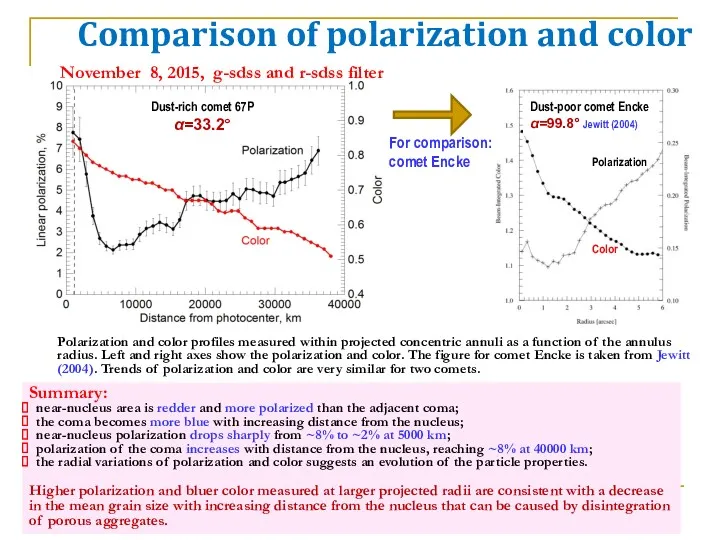
- 14. Comparison of polarization and color Polarization and color profiles measured within projected concentric annuli as a
- 15. Circular polarization November 08, 2015, α=33.2° CP in other comets C/2009 P1 (Garradd) C/2011 R1 (McNaught)
- 16. C/2009 P1 (Garradd) February 2-14, 2012 April 14-21, 2012 r=1.65-1.71 au r=2.16-2.23 au ∆=1.53-1.39 au ∆=1.79-1.96
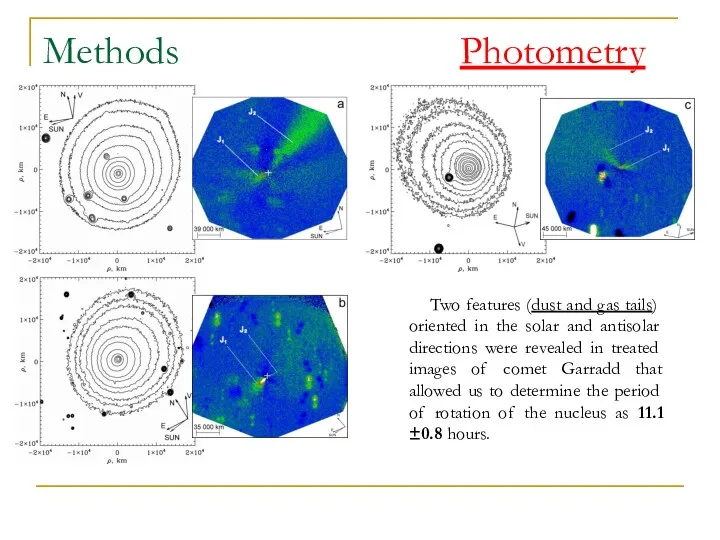
- 17. Methods Photometry Two features (dust and gas tails) oriented in the solar and antisolar directions were
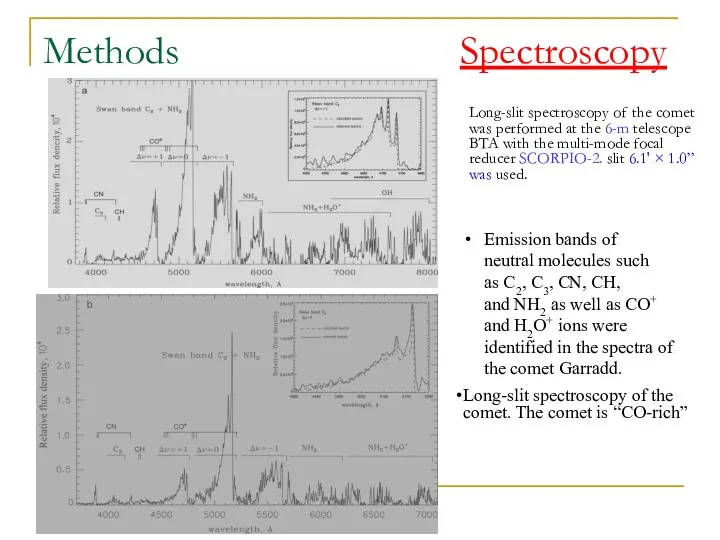
- 18. Methods Spectroscopy Long-slit spectroscopy of the comet was performed at the 6-m telescope BTA with the
- 19. Methods Spectropolarimetry The long-slit spectra of comet Garradd obtained at phase angle 35.9° on February 2.086,
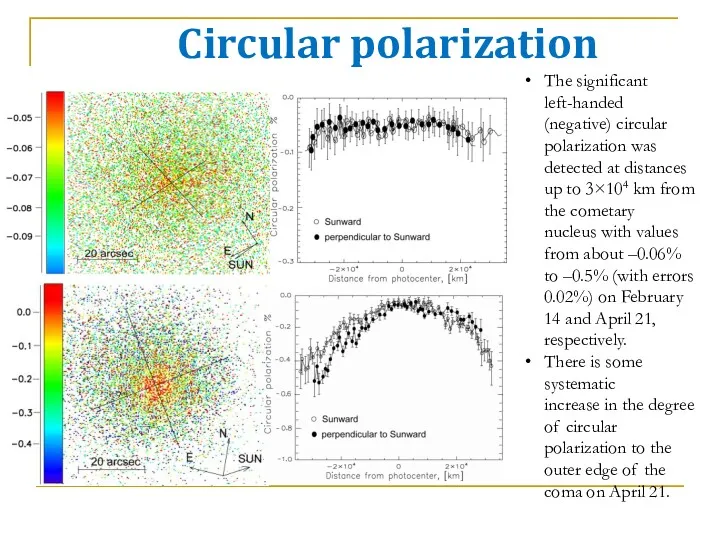
- 20. Circular polarization The significant left-handed (negative) circular polarization was detected at distances up to 3×10⁴ km
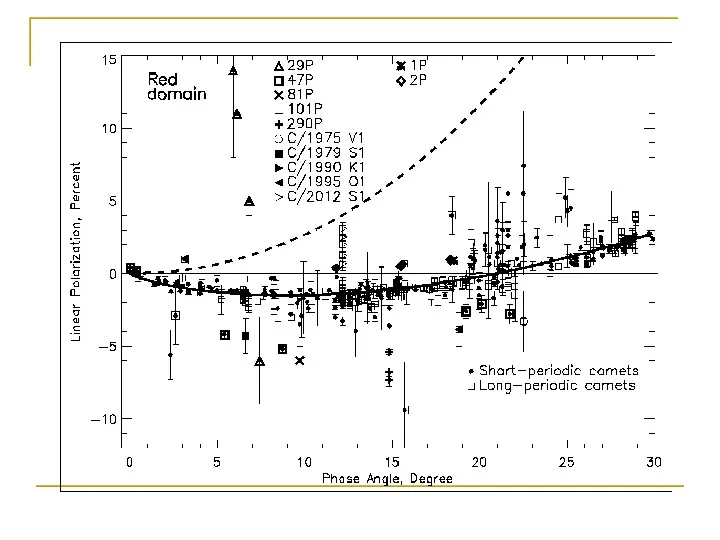
- 21. “New” comets and Centaurs The long-period comets are believed to originate from the Oord Cloud. These
- 22. C/2010 R1 (LINEAR) 2013, Feb. 6 r = 5.9 AU Δ = 5.6 AU α =
- 23. C/2014 A4 (SONEAR) 2015, Nov. 5 r = 4.21AU Δ = 3.28 AU α = 4.9°
- 24. C/2013 V4 (Catalina) 2015, Nov. 6 r = 5.19 AU Δ = 4.96 AU α =
- 25. C/2012 J1 (Catalina) 2012, Nov. 15 r = 3.17 AU Δ = 2.45 AU α =
- 26. 29P/Schwassmann-Wachmann 1 2012, Feb 14 r = 6.26 AU Δ = 5.51 AU α = 6.3°
- 27. C/2013 V4 (r=5.19 AU) C/2014 A4 (r=4.21 AU) C/2012 J2 (r=3.17 AU)
- 29. 174P/Echeclus We obtained new observations of an outburst of Centaur 174P/Echeclus at a heliocentric distance of
- 30. PRODUCTION RATE Q(O1D) Radial velocity: From observations: 9.3 ± 0.3 km/s From Ephemeris: 9.5 km/s atom/s
- 32. Скачать презентацию
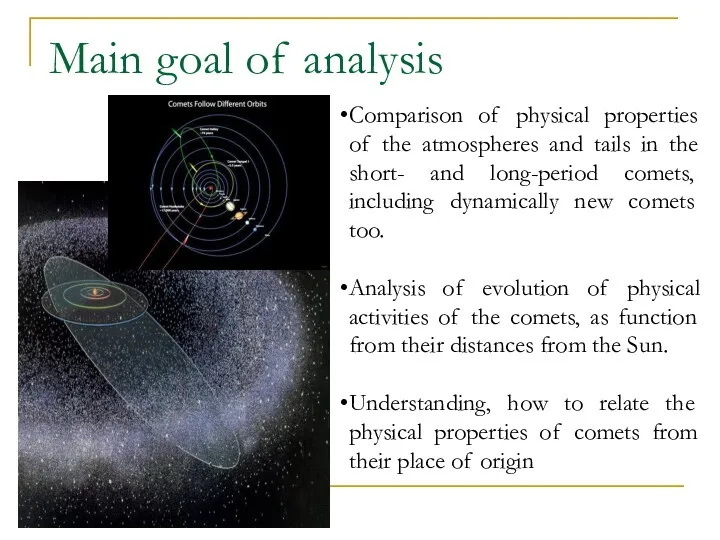
Comparison of physical properties of the atmospheres and tails in the
Comparison of physical properties of the atmospheres and tails in the
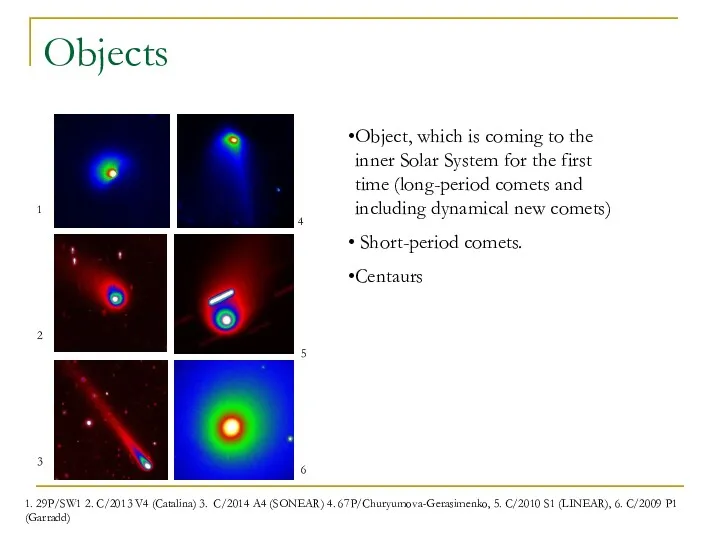
1. 29P/SW1 2. C/2013 V4 (Catalina) 3. C/2014 A4 (SONEAR) 4.
1. 29P/SW1 2. C/2013 V4 (Catalina) 3. C/2014 A4 (SONEAR) 4.
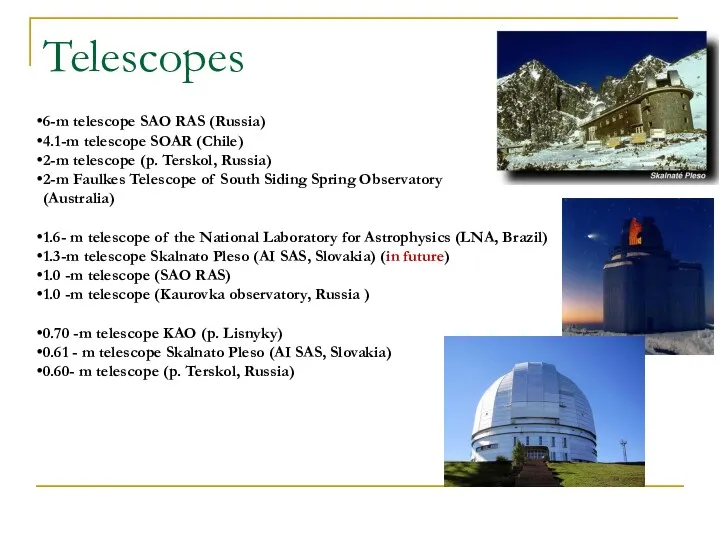
Telescopes
6-m telescope SAO RAS (Russia)
4.1-m telescope SOAR (Chile)
2-m telescope (p. Terskol,
Telescopes
6-m telescope SAO RAS (Russia)
4.1-m telescope SOAR (Chile)
2-m telescope (p. Terskol,
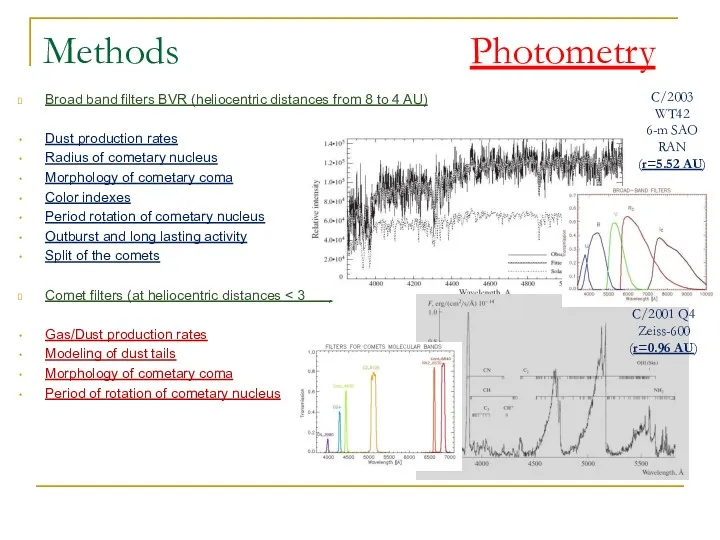
Methods Photometry
Broad band filters BVR (heliocentric distances from 8 to 4
Methods Photometry
Broad band filters BVR (heliocentric distances from 8 to 4
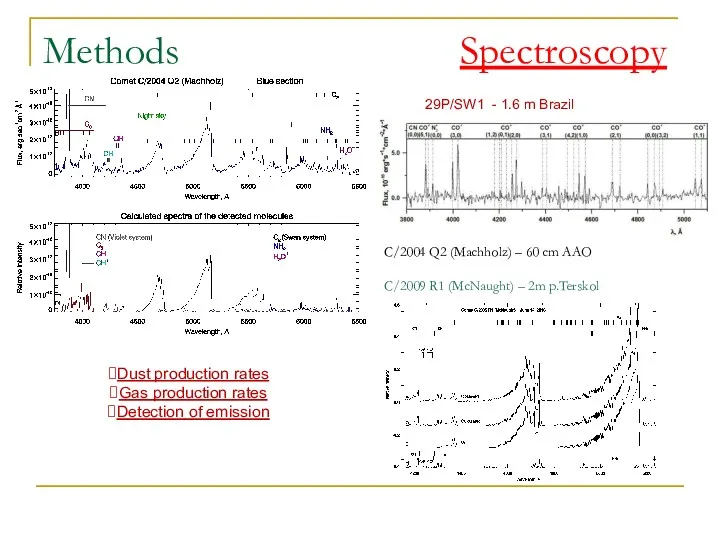
Methods Spectroscopy
29P/SW1 - 1.6 m Brazil
C/2004 Q2 (Machholz) – 60
Methods Spectroscopy
29P/SW1 - 1.6 m Brazil
C/2004 Q2 (Machholz) – 60
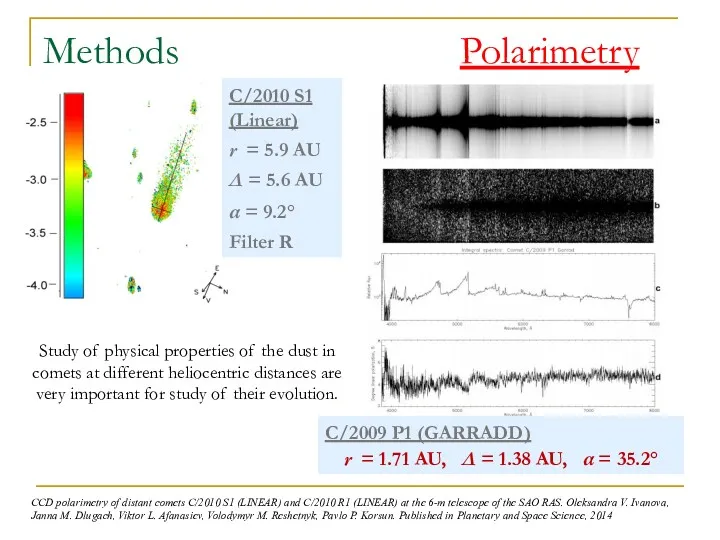
Methods Polarimetry
CCD polarimetry of distant comets C/2010 S1 (LINEAR) and C/2010
Methods Polarimetry
CCD polarimetry of distant comets C/2010 S1 (LINEAR) and C/2010
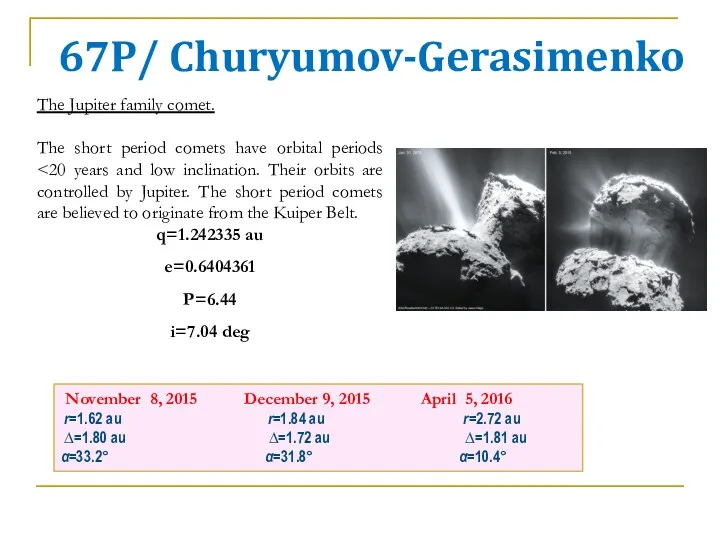
67P/ Churyumov-Gerasimenko
November 8, 2015 December 9, 2015 April 5, 2016
67P/ Churyumov-Gerasimenko
November 8, 2015 December 9, 2015 April 5, 2016
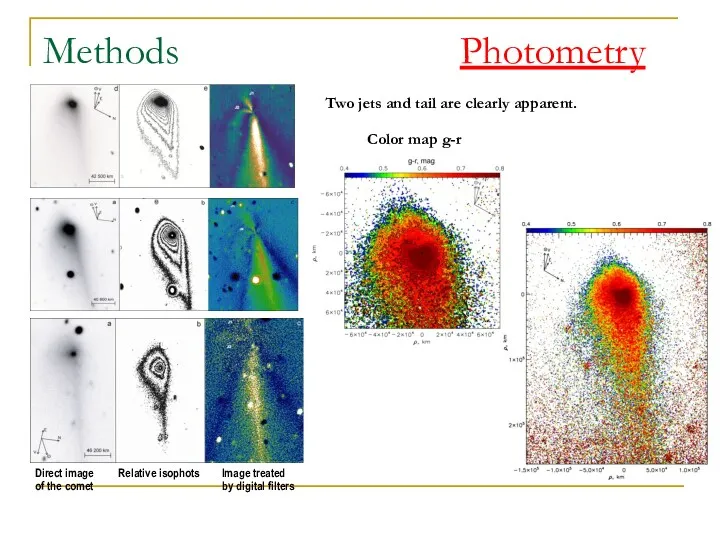
Methods Photometry
Direct image Relative isophots Image treated
of the comet
Methods Photometry
Direct image Relative isophots Image treated
of the comet
Methods Spectroscopy
Long-slit spectroscopy of the comet was performed at the 6-m
Methods Spectroscopy
Long-slit spectroscopy of the comet was performed at the 6-m
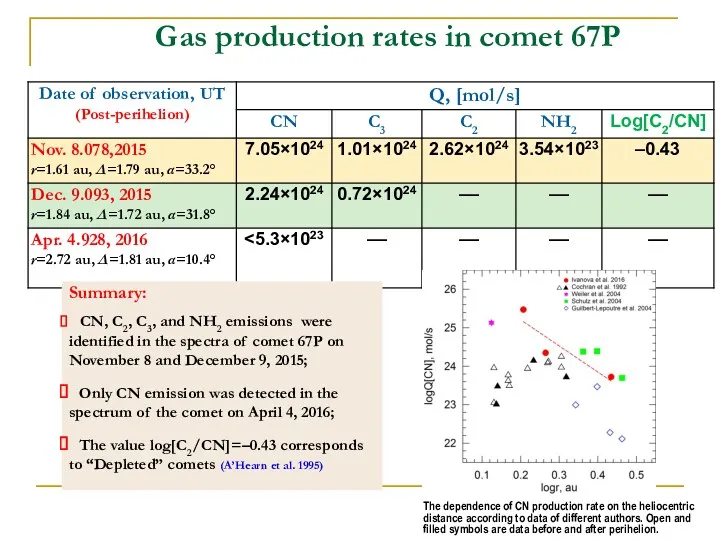
Gas production rates in comet 67P
Summary:
CN, C2, C3, and NH2
Gas production rates in comet 67P
Summary:
CN, C2, C3, and NH2
r=1.62 au
∆=1.80 au
α=33.2°
r=1.84 au
∆=1.72 au
α=31.8°
r=2.72 au
∆=1.81 au
α=10.4°
November 8, 2015 December
r=1.62 au
∆=1.80 au
α=33.2°
r=1.84 au
∆=1.72 au
α=31.8°
r=2.72 au
∆=1.81 au
α=10.4°
November 8, 2015 December
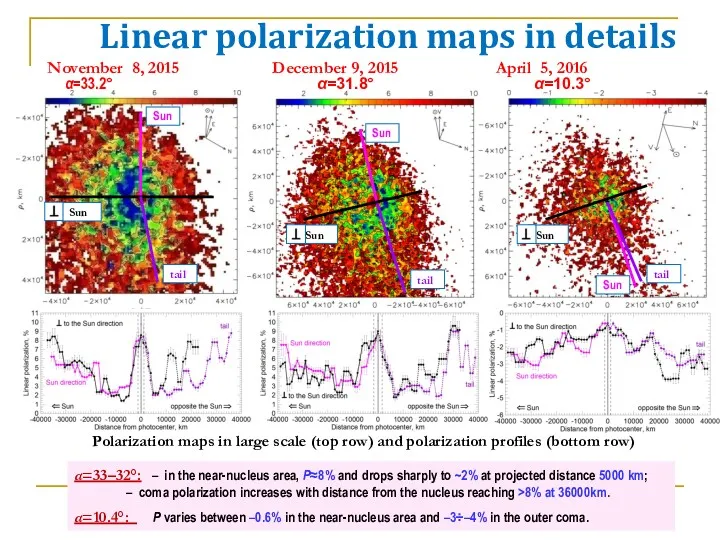
Linear polarization maps in details
Sun
tail
Sun
November 8, 2015 December 9, 2015
Linear polarization maps in details
Sun
tail
Sun
November 8, 2015 December 9, 2015
Comparison of polarization and color
Polarization and color profiles measured within projected
Comparison of polarization and color
Polarization and color profiles measured within projected
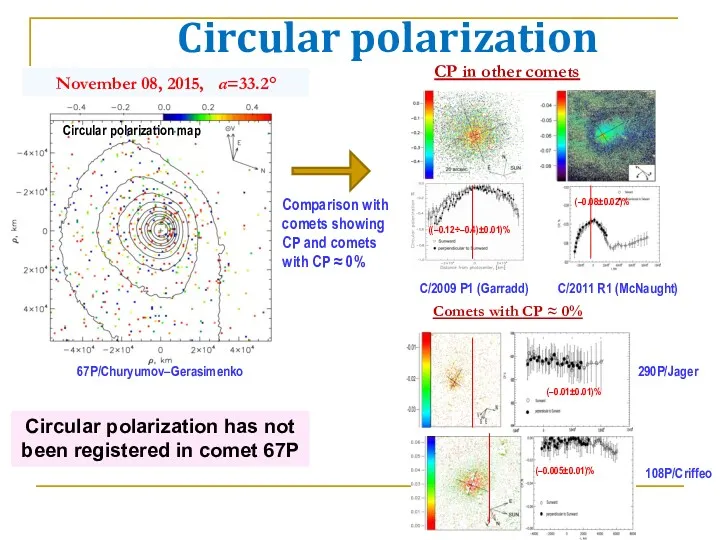
Circular polarization
November 08, 2015, α=33.2°
CP in other comets
C/2009 P1 (Garradd)
Circular polarization
November 08, 2015, α=33.2°
CP in other comets
C/2009 P1 (Garradd)

C/2009 P1 (Garradd)
February 2-14, 2012 April 14-21, 2012
r=1.65-1.71 au
C/2009 P1 (Garradd)
February 2-14, 2012 April 14-21, 2012
r=1.65-1.71 au
Methods Photometry
Two features (dust and gas tails) oriented in the solar
Methods Photometry
Two features (dust and gas tails) oriented in the solar
Methods Spectroscopy
Long-slit spectroscopy of the comet was performed at the 6-m
Methods Spectroscopy
Long-slit spectroscopy of the comet was performed at the 6-m
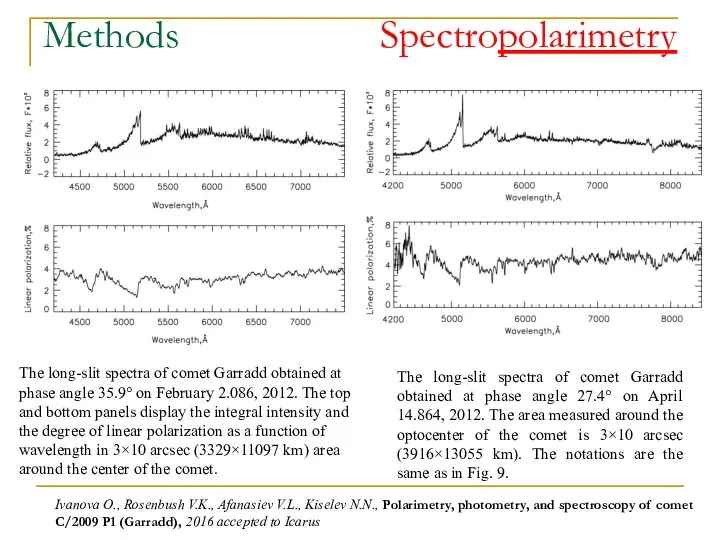
Methods Spectropolarimetry
The long-slit spectra of comet Garradd obtained at phase angle
Methods Spectropolarimetry
The long-slit spectra of comet Garradd obtained at phase angle
Circular polarization
The significant left-handed (negative) circular polarization was detected at distances
Circular polarization
The significant left-handed (negative) circular polarization was detected at distances
“New” comets and Centaurs
The long-period comets are believed to originate from
“New” comets and Centaurs
The long-period comets are believed to originate from
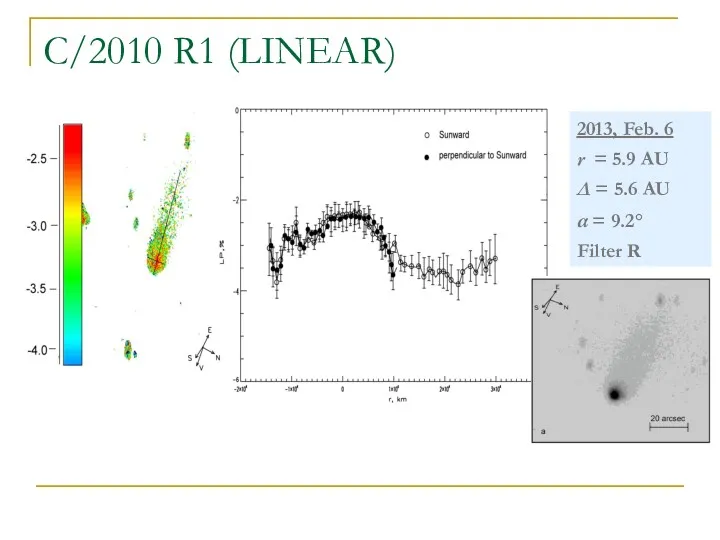
C/2010 R1 (LINEAR)
2013, Feb. 6
r = 5.9 AU
Δ = 5.6
C/2010 R1 (LINEAR)
2013, Feb. 6
r = 5.9 AU
Δ = 5.6
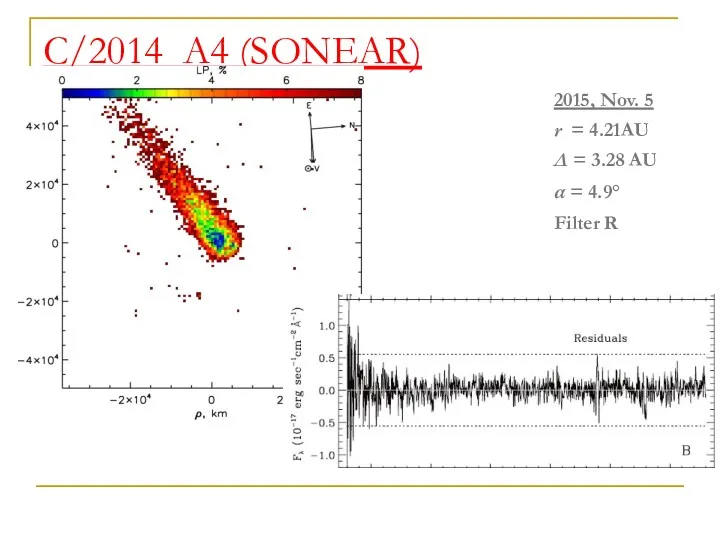
C/2014 A4 (SONEAR)
2015, Nov. 5
r = 4.21AU
Δ = 3.28 AU
C/2014 A4 (SONEAR)
2015, Nov. 5
r = 4.21AU
Δ = 3.28 AU
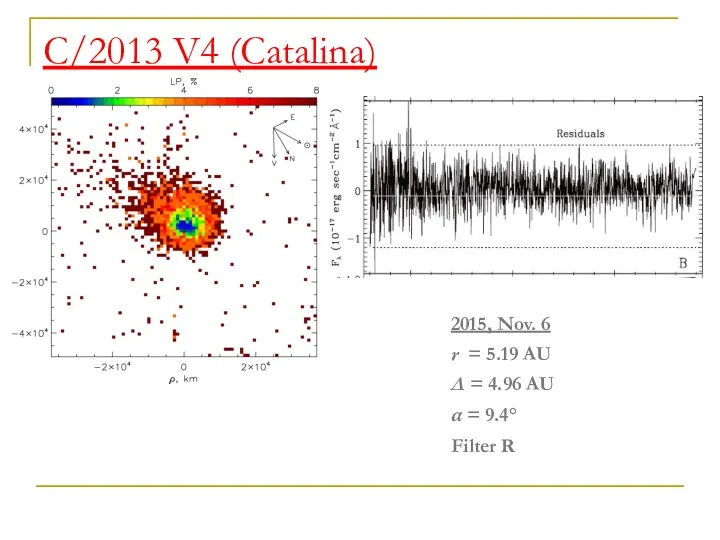
C/2013 V4 (Catalina)
2015, Nov. 6
r = 5.19 AU
Δ = 4.96
C/2013 V4 (Catalina)
2015, Nov. 6
r = 5.19 AU
Δ = 4.96
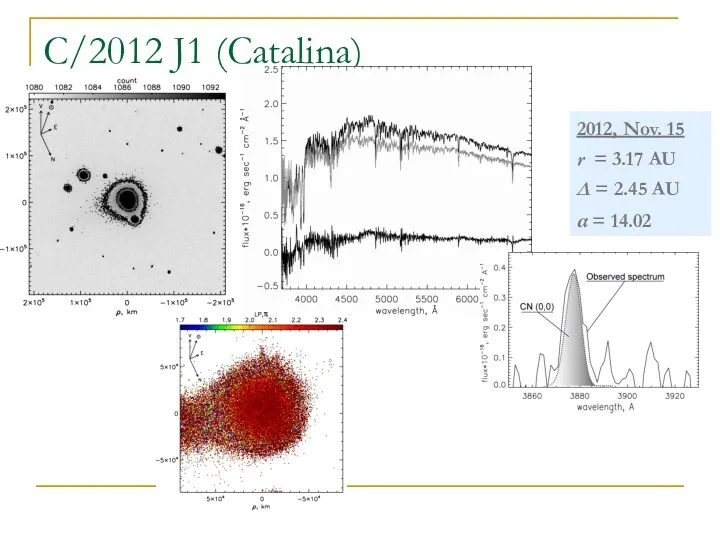
C/2012 J1 (Catalina)
2012, Nov. 15
r = 3.17 AU
Δ = 2.45
C/2012 J1 (Catalina)
2012, Nov. 15
r = 3.17 AU
Δ = 2.45
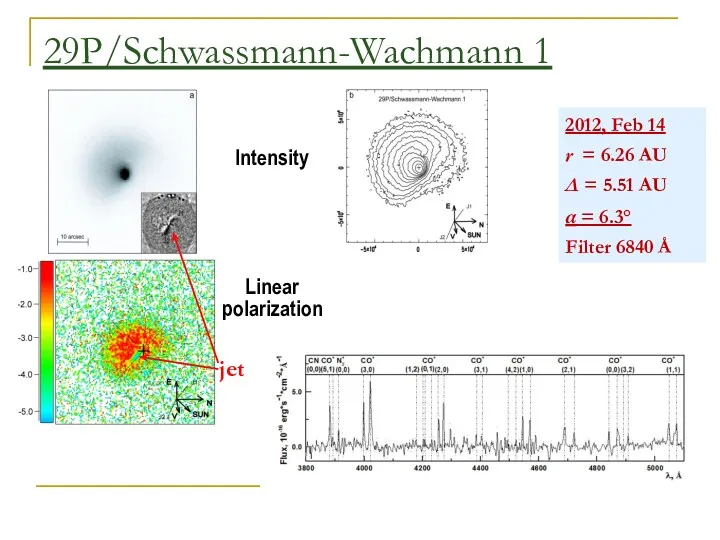
29P/Schwassmann-Wachmann 1
2012, Feb 14
r = 6.26 AU
Δ = 5.51 AU
29P/Schwassmann-Wachmann 1
2012, Feb 14
r = 6.26 AU
Δ = 5.51 AU
C/2013 V4 (r=5.19 AU)
C/2014 A4 (r=4.21 AU)
C/2012 J2 (r=3.17 AU)
C/2013 V4 (r=5.19 AU)
C/2014 A4 (r=4.21 AU)
C/2012 J2 (r=3.17 AU)
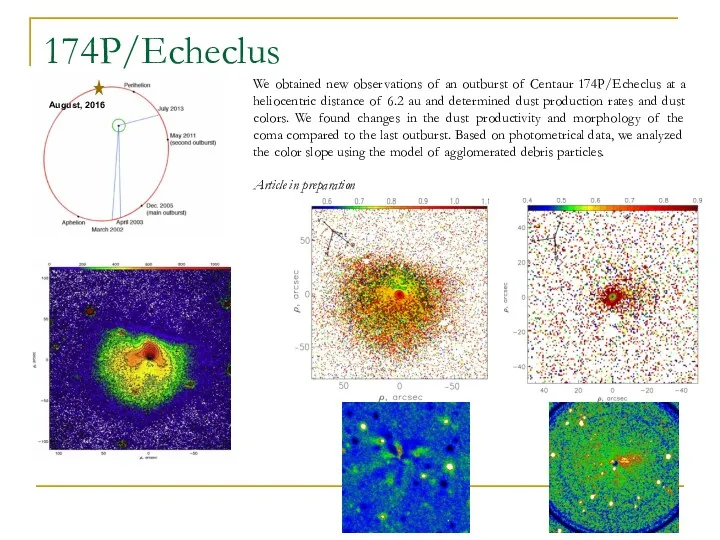
174P/Echeclus
We obtained new observations of an outburst of Centaur 174P/Echeclus at
174P/Echeclus
We obtained new observations of an outburst of Centaur 174P/Echeclus at
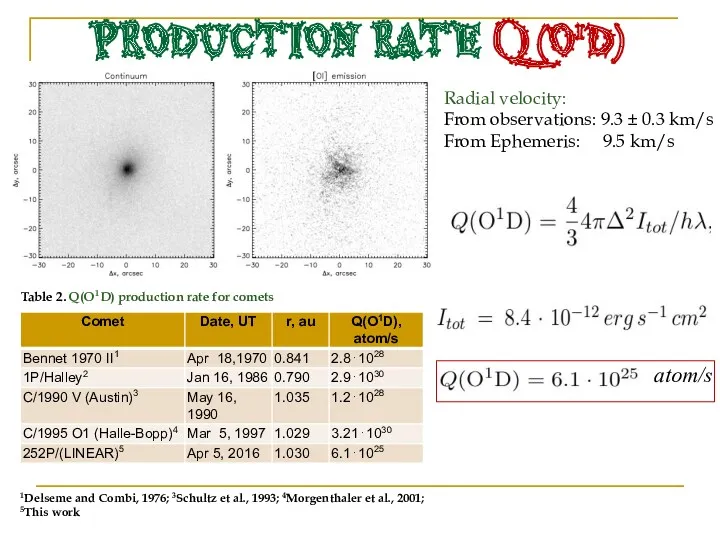
PRODUCTION RATE Q(O1D)
Radial velocity:
From observations: 9.3 ± 0.3 km/s
From Ephemeris: 9.5
PRODUCTION RATE Q(O1D)
Radial velocity:
From observations: 9.3 ± 0.3 km/s
From Ephemeris: 9.5
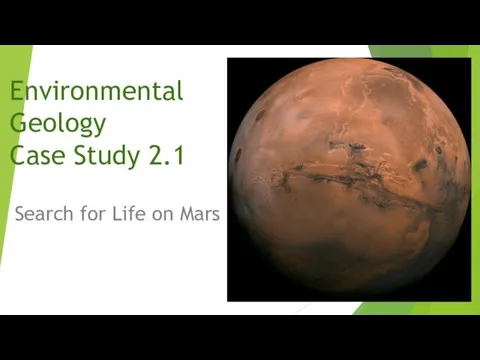 Environmental Geology Case. Search for Life on Mars
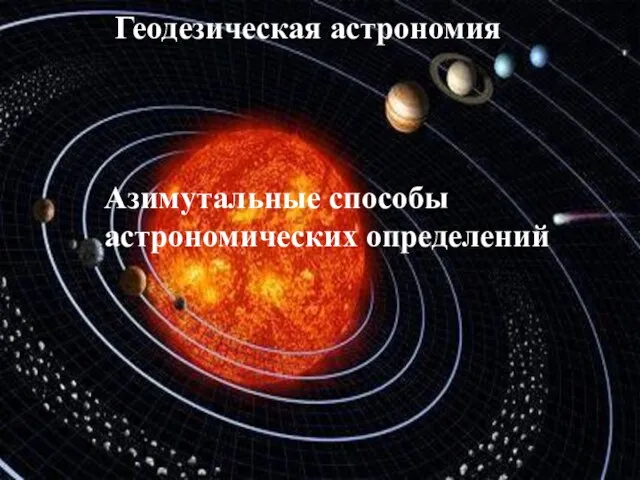 Азимутальные способы астрономических определений
 Мир астрономии
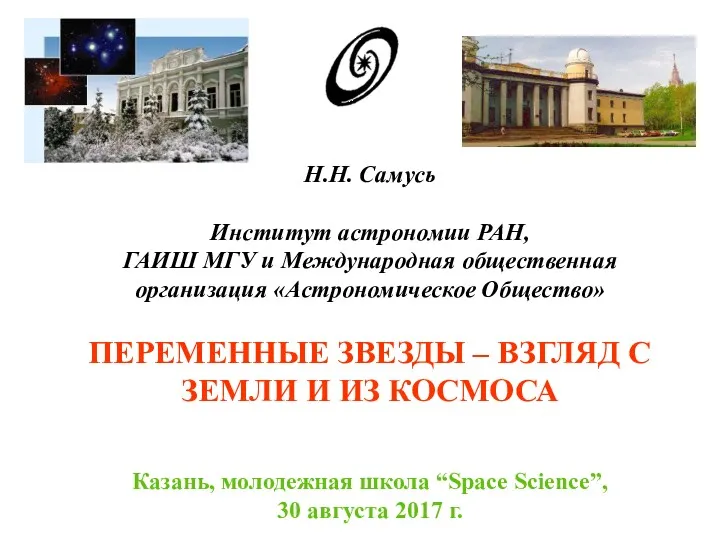 Переменные звезды. Взгляд с земли и из космоса
 Модель расширяющейся Вселенной
 Развитие астрономии
 Планета Земля
 Планета Земля. Космические снимки
 Пульсари. Нейтронні зорі
 Зорі. Еволюція зір
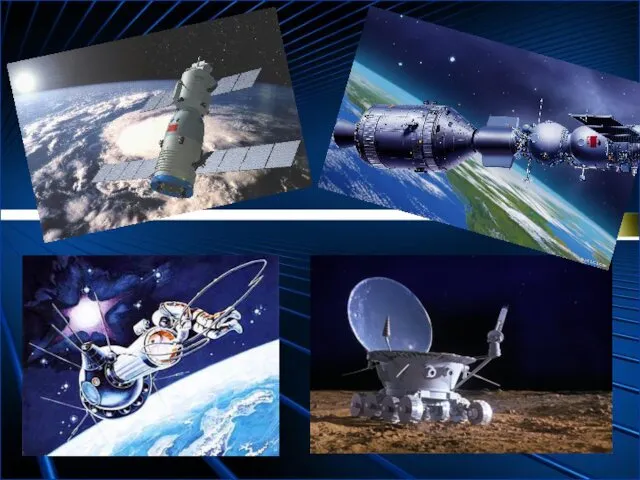 Современные исследования космоса
 Космический телескоп Хаббл
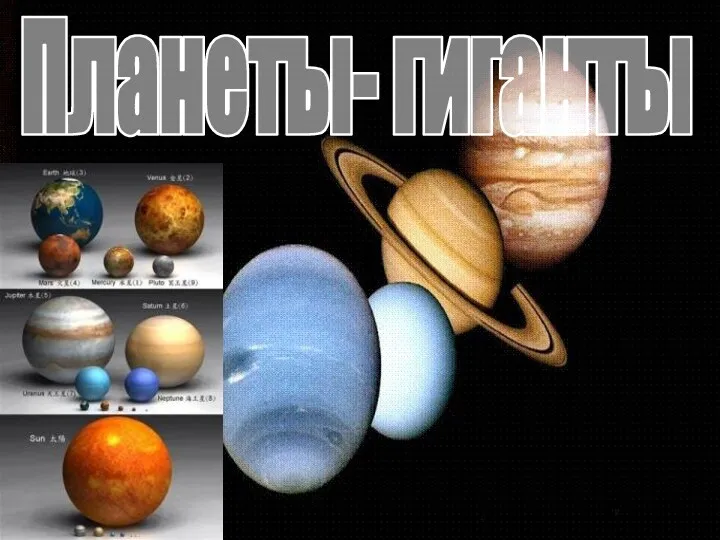 Планеты-гиганты
 Теории происхождения солнечной системы
 Строение мегамира
 Жұлдыздар
 проблема астероидно-кометных опасностей
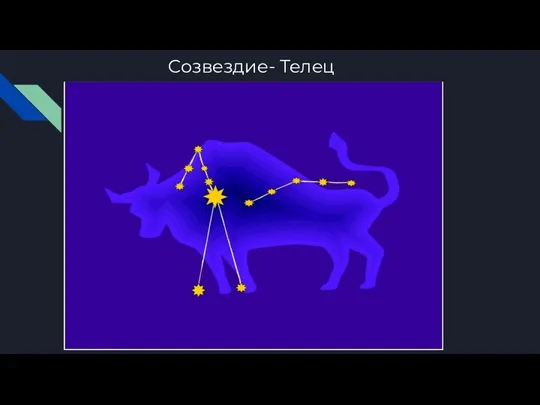 Созвездие Тельца
 Развитие представлений о строении Мира
 Неочікувані речі в космосі
 How does the climate of Mars compare to that of Earth?
 Строение Солнечной системы
 Вселенная. Изучение вселенной
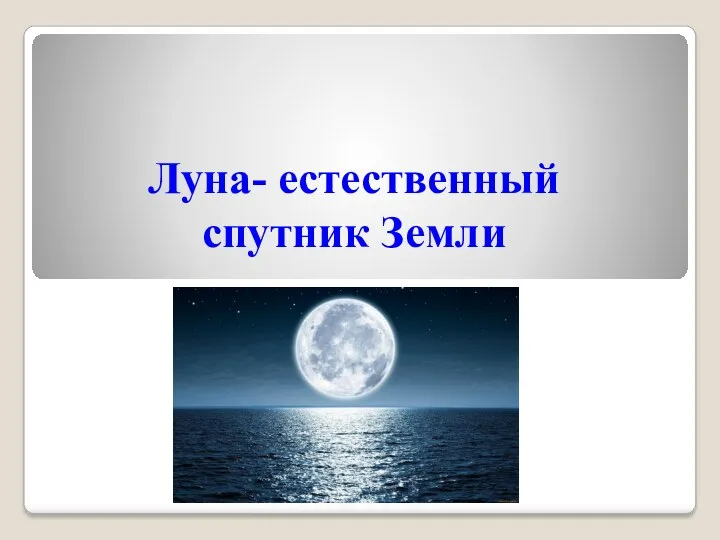 Луна - естественный спутник Земли
 Познавательная игра Космическая одиссея
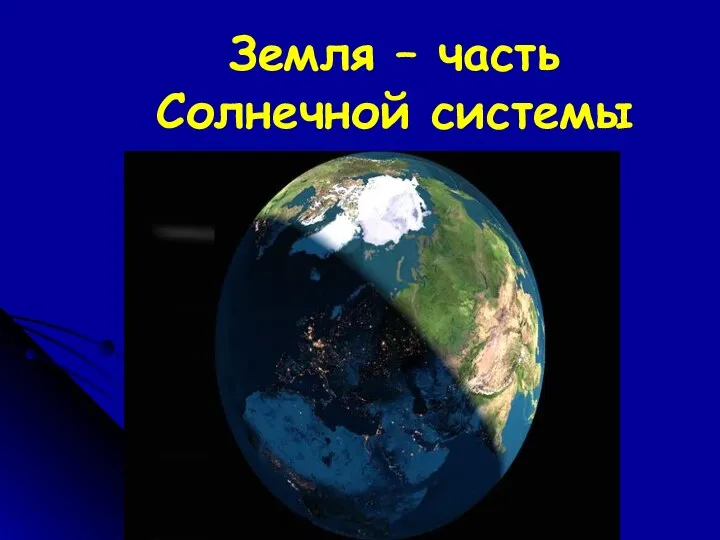 Земля – часть Солнечной системы
 Небольшие небесные тела - астероиды
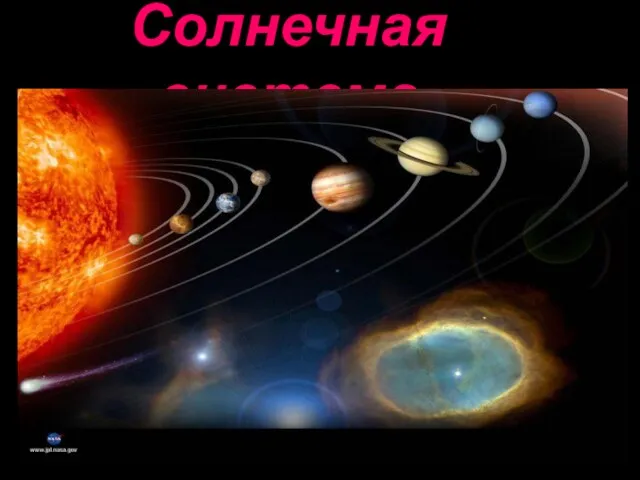 Солнечная система. Планеты земной группы