- Modern Methods in Cell Biology

Содержание
- 2. Approaches to problems in cell biology Biochemistry-You can define a enzyme reaction (protein) and then try
- 3. Resolution of instruments in cellular biology Resolution describes the minimal distance of two points that can
- 4. Resolution of instruments in cell biology (2 objects) Visible light is 400-700nm Dry lens(0.5NA), green(530nm light)=0.65µm=650nm
- 5. Sizes of objects Eukaryotic cell- 20µm Procaryotic cell-1-2µm nucleus of cell-3-5µm mitochondria/chloroplast- 1-2µm ribosome- 20-30nm protein-
- 6. Basic info expected from flow cytometry experiment (2 cellular populations): . Whether a cell of interest
- 7. Analysis of Cellular subpopulations by different methods (How many parameters to measure?) Conventional flow cytometry -4---12---18
- 8. Speed and Statistics (How fast? How precise?) Microscopy (20x-100x objective) – 20-100 cells/per slide or well
- 9. Zeno’s paradox
- 10. STATISTICS: How many cells we really need to count?
- 11. It depends from heterogeneity of cell population, % of antigen expression etc etc
- 12. File size for Imagestream imaging flow cytometer –up to 100,000 events (cell images) allows to work
- 13. Basic Flow Cytometer How does it work? Fluidics (stream) Optics/excitation sources Electronics Fluidics Hydrodynamic focusing of
- 14. Sample Injection port: sheath flow laser beams Hydrodynamic focusing Sample core stream Sample cells at interrogation
- 15. Optics:Light Sources Light Amplification by the Stimulated Emission of Radiation s Can provide a single wavelength
- 16. Solid state lasers-small, reliable, easy to integrate in existing technology and are rapidly decreasing in the
- 17. Multiple lasers in modern flow cytometer LSR2 7 lasers LSRFortessa 5 lasers Influx… 6 lasers Stratedigm
- 18. FACS Aria sorter
- 19. FACSCalibur flow cytometer
- 20. Optics: Forward Scatter Channel/Side Scatter Channel FSC influenced by particle size and shape; Allows the computer
- 21. Light Scattering properties of cells Right Angle Light Detector α Cell Complexity Forward Light Detector α
- 22. Neutrophils Monocytes Lymphocytes Forward Light Scatter Analyze (gate on) cells of interest Lysed Whole Blood Side
- 24. Scatter (Size parameter)-by conventional flow cytometry and IFC Barteneva et al, BBA Reviews on Cancer 2013,
- 25. Principle of fluorescence Principle of Fluorescence 1. Energy is absorbed by the atom which becomes excited.
- 26. FLUORESCENT methods in the research laboratory State-of-the art Fluorescent Microscopy and Confocal Microscopy High dimensional Flow
- 27. Advantages of fluorescent methods Highly sensitive method (high resolution) Highly sophisticated fluorescent probes (multi-) Fluorescent dyes
- 28. FLUORESCENT dyes are typically composed of ring structures
- 29. Absorption and Emission Spectra of some traditional fluorophores
- 30. Fluorescence Stoke’s shift Fluorescence emission peak wavelength is red-shifted with respect to absorption peak wavelength This
- 31. USE OF FLUORESCENT DYES Labeling of proteins - antibodies, streptavidin Labeling of nucleic acids – DNA,
- 32. FITC (Fluorescein isothiocyanate) Fluorescein isothiocyanate is a yellow-green colored low molecular weight dye which couples to
- 33. R-PE - R symbolises its red-algal origin – it is a bright orange-red colored protein, with
- 34. APC(allophycocyanin) Rod-and-core structure of cyanobacterial phycobilisome. Left-hand diagram shows stacks of hexameric phycocyanin complexes comprising the
- 35. ALEXA family:brighter, more photostable, less environmental sensitive
- 36. Quantum Dot-conjugated antibody
- 37. Quantum Dots advantages Extremly photostable Narrow emission spectrum, hence small spectral overlap Broad absorption spectrum (
- 38. QDots Brightness Brightness Index=Extinction Coefficient x Quantum Yield/1000
- 39. How do we get fluorescent probes into cells Kill the cell and make the membrane permeable
- 40. How to load cells (microscopy) .
- 41. Immunofluorescent staining of proteins in fixed/dead cells You can purify almost any protein from the cell
- 42. Protein from fluorescent jellyfish The protein is fluorescent Now cloned, sequenced and X-ray structure known If
- 43. Discovery of fluorescent proteins
- 44. Evrogen proteins (Lukianov Lab)
- 45. Conventional flow cytometry (Example: scattering+5 colors)
- 46. 9 colors: Murine Hematopoietic Stem Cells Sort from Transplant Objective: To serially transplant subpopulations of hematopoietic
- 47. Imaging flow cytometers provide alternative for cellular analysis and characterization
- 48. Imagestream 100 imaging flow cytometer
- 49. TDI CCD Excite fluorescence over the entire height of the detector Light is detected in the
- 50. Imagestream X Mark II x60 objective; higher acquisition speed; 10 fluorescent channels; +561 nm laser
- 51. Imagestream X Mark II Amnis Inc
- 52. Imagestream (s) optical configurations and fluorescent channels Adapted from A.Filby, 2015
- 53. Cellular analysis by conventional Flow Cytometry Traditional markers to define cell populations (human, rat, mouse) Relies
- 54. Standard approach to verify FACS-defined cellular subset:cell sorting+microscopy From Becher et al, Nature Immunology, 2014
- 55. Limitations of FACS sorting/microscopy approach Purity of sorted subpopulation (never 100%)-can be 85% or less for
- 56. Aspect Ratio Intensity is the minor axis intensity divided by the major axis intensity. Identifying single
- 57. Shape parameters in defining erythroid sickle anemia cells (Samsel, McCoy Jr, 2016)
- 58. Size/Shape distribution analysis (Aphanizomenon sp. Cells, our data)
- 59. Fluorescence-based analysis by Imagestream DNA/RNA dyes (PI, Sytox Blue, SYTOX Green etc) Lipid dyes (DiO, DiA,
- 60. Description: Intensity is the sum of all the pixel values in the mask, background subtracted. Intensity:
- 61. Quantification of Toxoplasma gondii Muskavitch et al, 2008
- 62. Number of ingested by neutrophils S. aureus bacteria (Ploppa et al, 2011)
- 63. Counting of Leishmania donovani (% infected cells and #parasites/cell) (Torrezas et al, 2015)
- 64. Internalization of CSFE-stained N.gonorrhoeae bacteria (Smirnov et al, 2015)
- 65. Human PBMC -morphology (from B.Hall)
- 66. AMNIS CORPORATION-Compensation Single color control samples used to calculate a 6x6 matrix. Post-acquisition compensation is applied
- 67. Spectral compensation is assymetric
- 68. From 3-4 colors for images (microscopy) to 8-colors immunophenotyping (external staining) with Imagestream X Mark II
- 69. Untranslocated Translocated NFkB Translocation Using The Similarity Algorithm (Amnis)
- 70. Untranslocated Translocated NFkB Translocation Using The Similarity Algorithm (Amnis)
- 71. Bystander MFs have impaired NFkappaBeta translocation to the nucleus (Torrez et al, 2015)
- 72. Co-localisation
- 73. Case 1: Co-localisation M.tuberculosis with Rab5 and Rab7 (From Haridas et al, 2016)
- 74. Co-localisation of S.aureus/dihydroethidium (oxidative burst in human whole blood) (Ploppa et al, 2011)
- 75. Nuclear fragmentation/caspase activity
- 77. Скачать презентацию

Approaches to problems in cell biology
Biochemistry-You can define a enzyme reaction
Approaches to problems in cell biology
Biochemistry-You can define a enzyme reaction

Resolution of instruments in cellular biology
Resolution describes the minimal distance of
Resolution of instruments in cellular biology
Resolution describes the minimal distance of

Resolution of instruments
in cell biology (2 objects)
Visible light is 400-700nm
Dry
Resolution of instruments
in cell biology (2 objects)
Visible light is 400-700nm
Dry

Sizes of objects
Eukaryotic cell- 20µm
Procaryotic cell-1-2µm
nucleus of cell-3-5µm
mitochondria/chloroplast- 1-2µm
ribosome- 20-30nm
protein- 2-100nm
Exosome –
Sizes of objects
Eukaryotic cell- 20µm
Procaryotic cell-1-2µm
nucleus of cell-3-5µm
mitochondria/chloroplast- 1-2µm
ribosome- 20-30nm
protein- 2-100nm
Exosome –

Basic info expected from flow cytometry experiment (2 cellular populations):
.
Whether a
Basic info expected from flow cytometry experiment (2 cellular populations):
.
Whether a

Analysis of Cellular subpopulations by different methods (How many parameters to
Analysis of Cellular subpopulations by different methods (How many parameters to

Speed and Statistics (How fast? How precise?)
Microscopy (20x-100x objective) – 20-100
Speed and Statistics (How fast? How precise?)
Microscopy (20x-100x objective) – 20-100

Zeno’s paradox
Zeno’s paradox

STATISTICS: How many cells we really need to count?
STATISTICS: How many cells we really need to count?

It depends from heterogeneity of cell population, % of antigen expression
It depends from heterogeneity of cell population, % of antigen expression

File size for Imagestream imaging flow cytometer –up to 100,000 events
File size for Imagestream imaging flow cytometer –up to 100,000 events

Basic Flow Cytometer
How does it work?
Fluidics (stream)
Optics/excitation sources
Electronics
Fluidics
Hydrodynamic focusing of
Basic Flow Cytometer
How does it work?
Fluidics (stream)
Optics/excitation sources
Electronics
Fluidics
Hydrodynamic focusing of

Sample Injection port:
sheath flow
laser beams
Hydrodynamic focusing
Sample core stream
Sample cells at interrogation
Sample Injection port:
sheath flow
laser beams
Hydrodynamic focusing
Sample core stream
Sample cells at interrogation

Optics:Light Sources
Light
Amplification
by the
Stimulated
Emission
of
Radiation
s
Can provide a single wavelength of light
Can provide from
Optics:Light Sources
Light
Amplification
by the
Stimulated
Emission
of
Radiation
s
Can provide a single wavelength of light
Can provide from

Solid state lasers-small, reliable, easy to integrate in existing technology and
Solid state lasers-small, reliable, easy to integrate in existing technology and

Multiple lasers in modern flow cytometer
LSR2 7 lasers
LSRFortessa
5 lasers
Influx…
6 lasers
Stratedigm
4 lasers
Multiple lasers in modern flow cytometer
LSR2 7 lasers
LSRFortessa
5 lasers
Influx…
6 lasers
Stratedigm
4 lasers

FACS Aria sorter
FACS Aria sorter

FACSCalibur flow cytometer
FACSCalibur flow cytometer

Optics: Forward Scatter Channel/Side Scatter
Channel
FSC influenced by particle size and
Optics: Forward Scatter Channel/Side Scatter
Channel
FSC influenced by particle size and

Light Scattering properties of cells
Right Angle Light Detector
α Cell Complexity
Forward
Light Scattering properties of cells
Right Angle Light Detector
α Cell Complexity
Forward

Neutrophils
Monocytes
Lymphocytes
Forward Light Scatter
Analyze (gate on) cells of interest
Lysed Whole Blood
Side Scatter
Neutrophils
Monocytes
Lymphocytes
Forward Light Scatter
Analyze (gate on) cells of interest
Lysed Whole Blood
Side Scatter


Scatter (Size parameter)-by conventional flow cytometry and IFC
Barteneva et al, BBA
Scatter (Size parameter)-by conventional flow cytometry and IFC
Barteneva et al, BBA

Principle of fluorescence
Principle of Fluorescence
1. Energy is absorbed by the atom
Principle of fluorescence
Principle of Fluorescence 1. Energy is absorbed by the atom

FLUORESCENT methods in the research laboratory
State-of-the art Fluorescent Microscopy and Confocal
FLUORESCENT methods in the research laboratory
State-of-the art Fluorescent Microscopy and Confocal

Advantages of fluorescent methods
Highly sensitive method (high resolution)
Highly sophisticated fluorescent probes
Advantages of fluorescent methods
Highly sensitive method (high resolution)
Highly sophisticated fluorescent probes

FLUORESCENT dyes are typically composed of ring structures
FLUORESCENT dyes are typically composed of ring structures

Absorption and Emission Spectra of some traditional fluorophores
Absorption and Emission Spectra of some traditional fluorophores

Fluorescence Stoke’s shift
Fluorescence emission peak wavelength is red-shifted with respect to
Fluorescence Stoke’s shift
Fluorescence emission peak wavelength is red-shifted with respect to

USE OF FLUORESCENT DYES
Labeling of proteins - antibodies, streptavidin
Labeling of nucleic
USE OF FLUORESCENT DYES
Labeling of proteins - antibodies, streptavidin
Labeling of nucleic

FITC (Fluorescein isothiocyanate)
Fluorescein isothiocyanate is a yellow-green colored low molecular
FITC (Fluorescein isothiocyanate)
Fluorescein isothiocyanate is a yellow-green colored low molecular

R-PE - R symbolises its red-algal origin – it is a
R-PE - R symbolises its red-algal origin – it is a

APC(allophycocyanin)
Rod-and-core structure of cyanobacterial phycobilisome. Left-hand diagram shows stacks of hexameric
APC(allophycocyanin)
Rod-and-core structure of cyanobacterial phycobilisome. Left-hand diagram shows stacks of hexameric

ALEXA family:brighter, more photostable, less environmental sensitive
ALEXA family:brighter, more photostable, less environmental sensitive

Quantum Dot-conjugated antibody
Quantum Dot-conjugated antibody

Quantum Dots advantages
Extremly photostable
Narrow emission spectrum, hence small spectral overlap
Broad absorption
Quantum Dots advantages
Extremly photostable
Narrow emission spectrum, hence small spectral overlap
Broad absorption

QDots Brightness
Brightness Index=Extinction Coefficient x Quantum Yield/1000
QDots Brightness
Brightness Index=Extinction Coefficient x Quantum Yield/1000

How do we get fluorescent probes into cells
Kill the cell and
How do we get fluorescent probes into cells
Kill the cell and

How to load cells (microscopy)
.
How to load cells (microscopy)
.

Immunofluorescent staining of proteins in fixed/dead cells
You can purify almost any
Immunofluorescent staining of proteins in fixed/dead cells
You can purify almost any

Protein from fluorescent jellyfish
The protein is fluorescent
Now cloned, sequenced and X-ray
Protein from fluorescent jellyfish
The protein is fluorescent
Now cloned, sequenced and X-ray

Discovery of fluorescent proteins
Discovery of fluorescent proteins

Evrogen proteins (Lukianov Lab)
Evrogen proteins (Lukianov Lab)

Conventional flow cytometry
(Example: scattering+5 colors)
Conventional flow cytometry
(Example: scattering+5 colors)

9 colors: Murine Hematopoietic Stem Cells Sort from Transplant
Objective: To
9 colors: Murine Hematopoietic Stem Cells Sort from Transplant
Objective: To

Imaging flow cytometers provide alternative for cellular analysis and characterization
Imaging flow cytometers provide alternative for cellular analysis and characterization

Imagestream 100 imaging flow cytometer
Imagestream 100 imaging flow cytometer

TDI CCD
Excite fluorescence over the entire height of the detector
Light is
TDI CCD
Excite fluorescence over the entire height of the detector
Light is

Imagestream X Mark II
x60 objective; higher acquisition speed; 10 fluorescent
Imagestream X Mark II
x60 objective; higher acquisition speed; 10 fluorescent

Imagestream X Mark II
Amnis Inc
Imagestream X Mark II
Amnis Inc

Imagestream (s) optical configurations and fluorescent channels
Adapted from A.Filby, 2015
Imagestream (s) optical configurations and fluorescent channels
Adapted from A.Filby, 2015

Cellular analysis by conventional Flow Cytometry
Traditional markers to define cell populations
Cellular analysis by conventional Flow Cytometry
Traditional markers to define cell populations

Standard approach to verify FACS-defined cellular subset:cell sorting+microscopy
From Becher et
Standard approach to verify FACS-defined cellular subset:cell sorting+microscopy
From Becher et

Limitations of FACS sorting/microscopy approach
Purity of sorted subpopulation (never 100%)-can be
Limitations of FACS sorting/microscopy approach
Purity of sorted subpopulation (never 100%)-can be

Aspect Ratio Intensity is the minor axis intensity divided by the

Shape parameters in defining erythroid sickle anemia cells
(Samsel, McCoy Jr,
Shape parameters in defining erythroid sickle anemia cells (Samsel, McCoy Jr,

Size/Shape distribution analysis
(Aphanizomenon sp. Cells, our data)
Size/Shape distribution analysis
(Aphanizomenon sp. Cells, our data)

Fluorescence-based analysis by Imagestream
DNA/RNA dyes (PI, Sytox Blue, SYTOX Green etc)
Lipid
Fluorescence-based analysis by Imagestream
DNA/RNA dyes (PI, Sytox Blue, SYTOX Green etc)
Lipid

Description:
Intensity is the sum of all the pixel values in the
Description:
Intensity is the sum of all the pixel values in the

Quantification of Toxoplasma gondii
Muskavitch et al, 2008
Quantification of Toxoplasma gondii
Muskavitch et al, 2008

Number of ingested by neutrophils S. aureus bacteria (Ploppa et al,
Number of ingested by neutrophils S. aureus bacteria (Ploppa et al,

Counting of Leishmania donovani (% infected cells and #parasites/cell)
(Torrezas et al,
Counting of Leishmania donovani (% infected cells and #parasites/cell) (Torrezas et al,

Internalization of CSFE-stained N.gonorrhoeae bacteria (Smirnov et al, 2015)
Internalization of CSFE-stained N.gonorrhoeae bacteria (Smirnov et al, 2015)

Human PBMC -morphology
(from B.Hall)
Human PBMC -morphology
(from B.Hall)

AMNIS CORPORATION-Compensation
Single color control samples used to calculate a 6x6 matrix.
Post-acquisition
AMNIS CORPORATION-Compensation
Single color control samples used to calculate a 6x6 matrix.
Post-acquisition

Spectral compensation is assymetric
Spectral compensation is assymetric

From 3-4 colors for images (microscopy) to 8-colors immunophenotyping (external staining)
From 3-4 colors for images (microscopy) to 8-colors immunophenotyping (external staining)

Untranslocated
Translocated
NFkB Translocation Using The Similarity Algorithm (Amnis)
Untranslocated
Translocated
NFkB Translocation Using The Similarity Algorithm (Amnis)

Untranslocated
Translocated
NFkB Translocation Using The Similarity Algorithm (Amnis)
Untranslocated
Translocated
NFkB Translocation Using The Similarity Algorithm (Amnis)

Bystander MFs have impaired NFkappaBeta translocation to the nucleus (Torrez et
Bystander MFs have impaired NFkappaBeta translocation to the nucleus (Torrez et

Co-localisation
Co-localisation

Case 1: Co-localisation M.tuberculosis with Rab5 and Rab7
(From
Case 1: Co-localisation M.tuberculosis with Rab5 and Rab7
(From

Co-localisation of S.aureus/dihydroethidium (oxidative burst in human whole blood)
(Ploppa et
Co-localisation of S.aureus/dihydroethidium (oxidative burst in human whole blood) (Ploppa et

Nuclear fragmentation/caspase activity
Nuclear fragmentation/caspase activity
 Клиническая биохимия азотистого обмена. (Лекция 7)
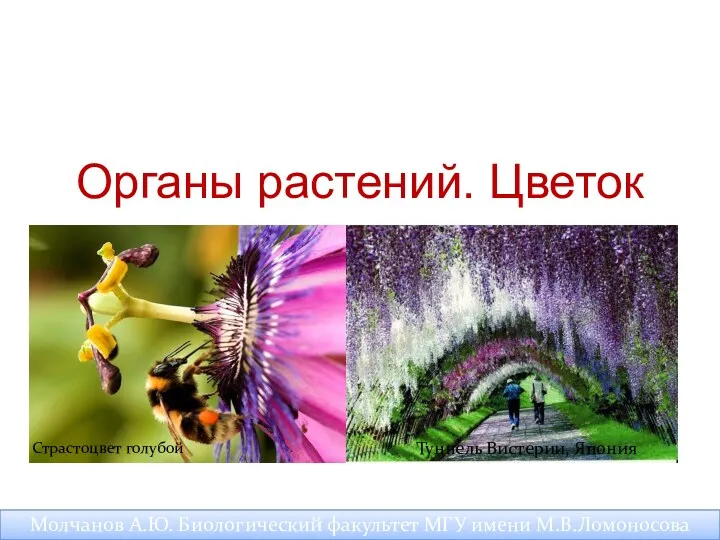 Органы растений. Цветок
 Членистоногие
 5.02- 7кл внутреннее строение листа_
 Мутационная и комбинативная изменчивость
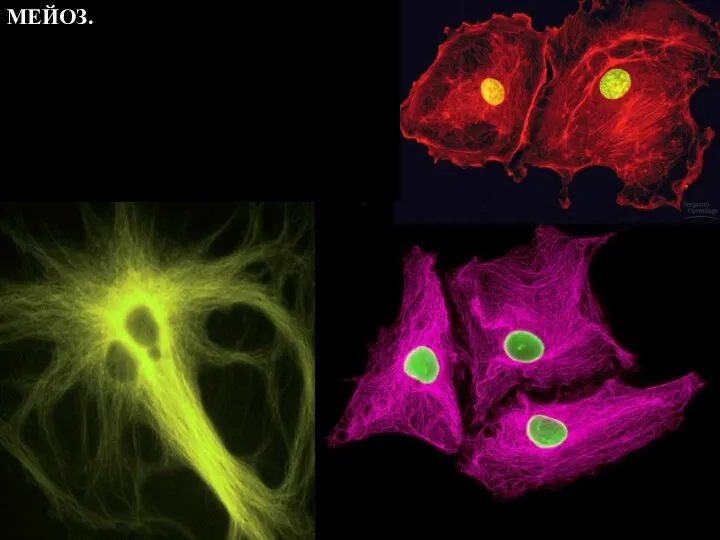 Мейоз. Типы мейоза
 Общая характеристика отдела моховидные
 Structura celulei bacteriene
 Задание № 27 (ОГЭ)
 Дикорастущие растения и цветы
 Биологические ритмы
 Исследовательская деятельность на уроках биологии и во внеурочное время как средство развития творческих способностей
 Витамины
 Protein synthesis
 Химический состав растений
 Нуклеиновые кислоты и их роль в жизнедеятельности клетки
 5 весняних квіток
 Строение клетки
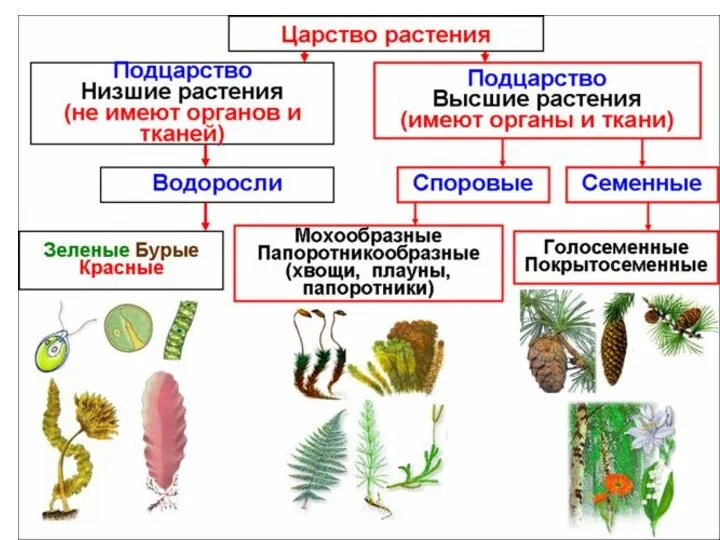 Царство растения
 Тип Моллюски
 Опасные животные России
 Вирусы – неклеточные формы жизни
 Содержание углекислого газа в школьных помещениях
 Грибы, травы, цветы
 Нервная система человека
 УРОК Образ мира
 Зоология позвоночных. Строение основных типов беспозвоночных
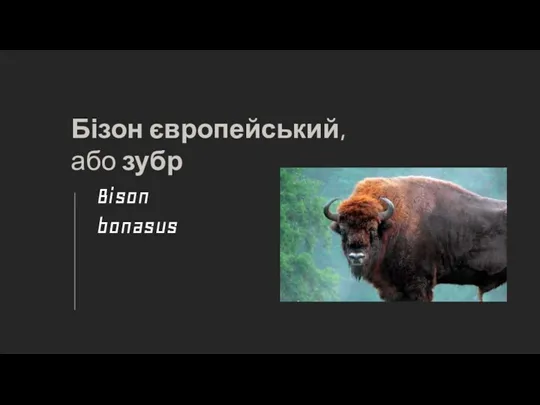 Бізон європейський, або зубр