- What are we measuring with M/EEG (and what are we measuring with)

Содержание
- 2. A brief history The EEG & MEG instrumentation Neuronal basis of the signal Forward models Outline
- 3. EEG history 1875: Richard Caton (1842-1926) measured currents inbetween the cortical surface and the skull, in
- 4. MEG history David Cohen 1962: Josephson effect 1968: first (noisy) measure of a magnetic brain signal
- 5. It is an ultrasensitive detector of magnetic flux. It is made up of a superconducting ring
- 6. There are different types of sensors Magnetometers: measure the magnetic flux through a single coil Gradiometers:
- 8. The EEG & MEG instrumentation Sensors (Pick up coil) SQUIDs MEG - 269 °C
- 9. From a single neuron to a neuronal assembly/column A single active neuron is not sufficient. ~100,000
- 10. Holmgren et al. 2003 Lateral connectivity -local
- 11. Volume currents Magnetic field Electrical potential difference (EEG) 5-10nAm Aggregate post-synaptic currents of ~100,000 pyrammidal neurons
- 12. MEG EEG What do we measure with EEG & MEG ? From a single source to
- 13. Fig. 14. Return currents for the left thalamic source on a coronal cut through the isotropic
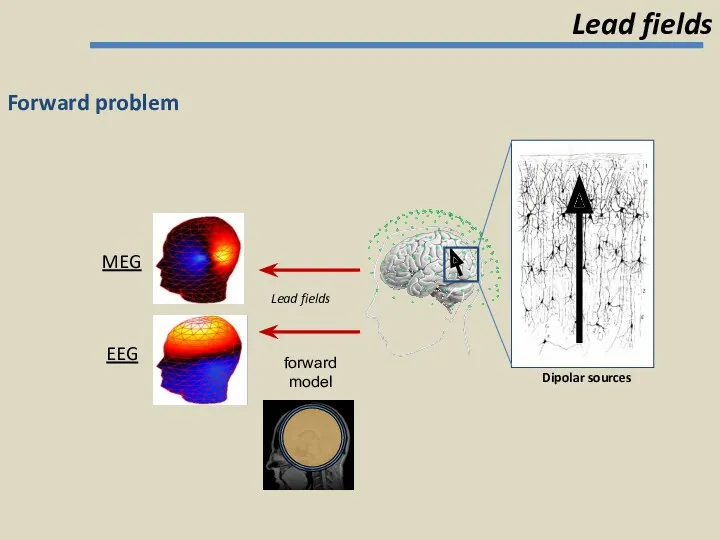
- 14. Lead fields MEG EEG Dipolar sources Head tissues (conductivity & geometry) The forward problem
- 15. Different head models (lead field definitions) for the forward problem Finite Element Boundary Element Multiple Spheres
- 16. Can MEG see gyral sources ? A perfectly radial source in a spherical conductor produces no
- 17. A quantitative assessment of the sensitivity of whole-head MEG to activity in the adult human cortex.
- 18. EEG Auditory Brainstem Response Wave I/II ( Wave III. Ipsilateral cochlear nucleus / superior olivary complex
- 19. Volume 295, Issue 7654, 9 May 1970, Pages 976-979 IS ALPHA RHYTHM AN ARTEFACT? O. C.
- 20. Summary EEG is sensitive to deep (and radial) sources but a very precise head model is
- 21. Supp_Motor_Area Parietal_Sup Frontal_Inf_Oper Occipital_Mid Frontal_Med_Orb Calcarine Heschl Insula Cingulum_Ant ParaHippocampal Hippocampus Putamen Amygdala Caudate Cingulum_Post Brainstem
- 22. Sqrt(Trials) sqrt(Noise Bandwidth) 400 Trials, 40Hz BW 200 Trials, 20 Hz BW Sensitivity can be improved
- 24. Forward problem Lead fields MEG EEG Dipolar sources Lead fields forward model
- 25. Y = g(θ)+ ε forward model MEG The inverse problem For example, can make a good
- 26. Summary Measuring signals due to aggregate post-synaptic currents (modeled as dipoles) Lead fields are the predicted
- 27. Google Ngram viewer Thanks to Laurence Hunt and Tim Behrens Occurrence in English language texts EEG
- 28. Logothetis 2003 Local Field Potential (LFP) / BOLD
- 29. Note that the huge dimensionality of the data allows you to infer a lot more than
- 31. Скачать презентацию
A brief history
The EEG & MEG instrumentation
Neuronal basis of the signal
Forward
A brief history
The EEG & MEG instrumentation
Neuronal basis of the signal
Forward
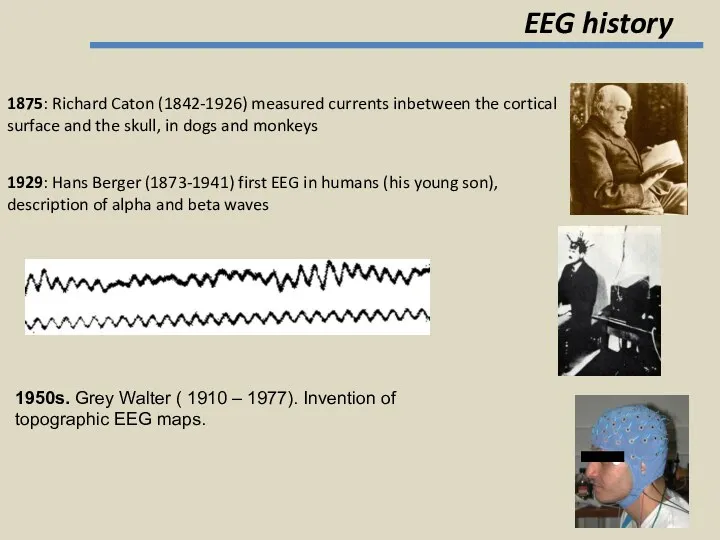
EEG history
1875: Richard Caton (1842-1926) measured currents inbetween the cortical surface
EEG history
1875: Richard Caton (1842-1926) measured currents inbetween the cortical surface
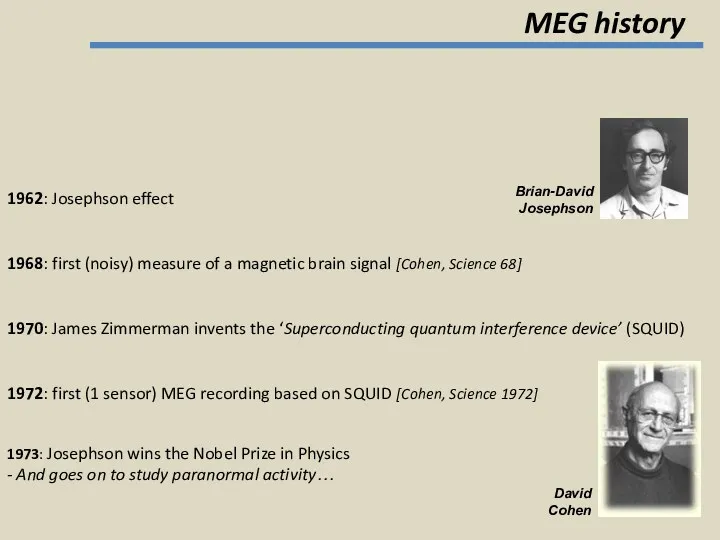
MEG history
David
Cohen
1962: Josephson effect
1968: first (noisy) measure of a magnetic brain
MEG history
David
Cohen
1962: Josephson effect
1968: first (noisy) measure of a magnetic brain
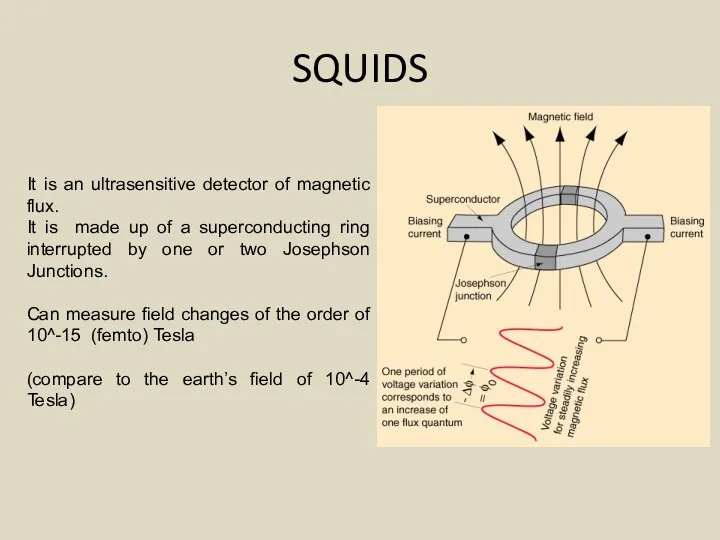
It is an ultrasensitive detector of magnetic flux.
It is made up
It is made up
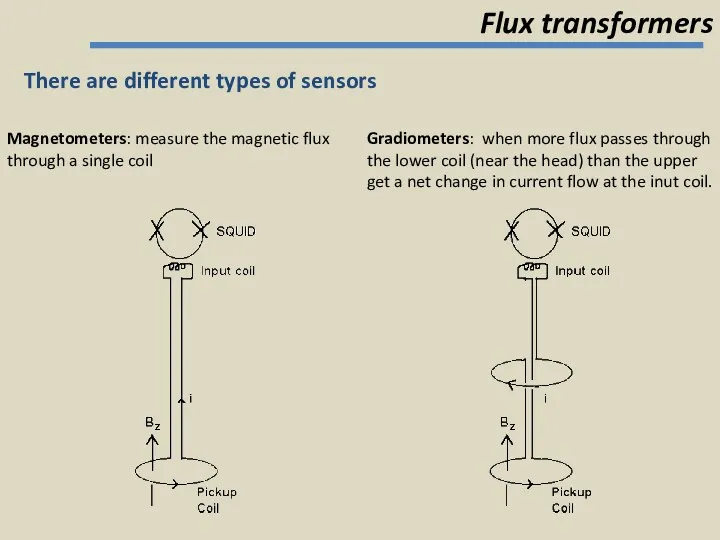
There are different types of sensors
Magnetometers: measure the magnetic flux through
There are different types of sensors
Magnetometers: measure the magnetic flux through
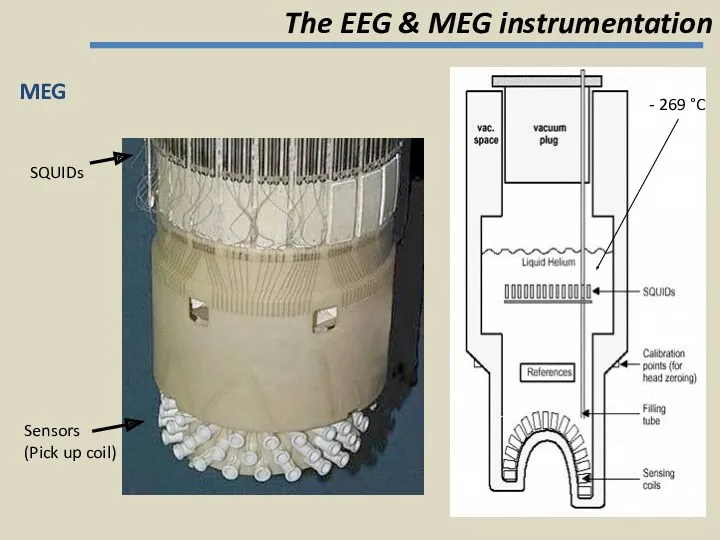
The EEG & MEG instrumentation
Sensors
(Pick up coil)
SQUIDs
MEG
- 269 °C
The EEG & MEG instrumentation
Sensors
(Pick up coil)
SQUIDs
MEG
- 269 °C
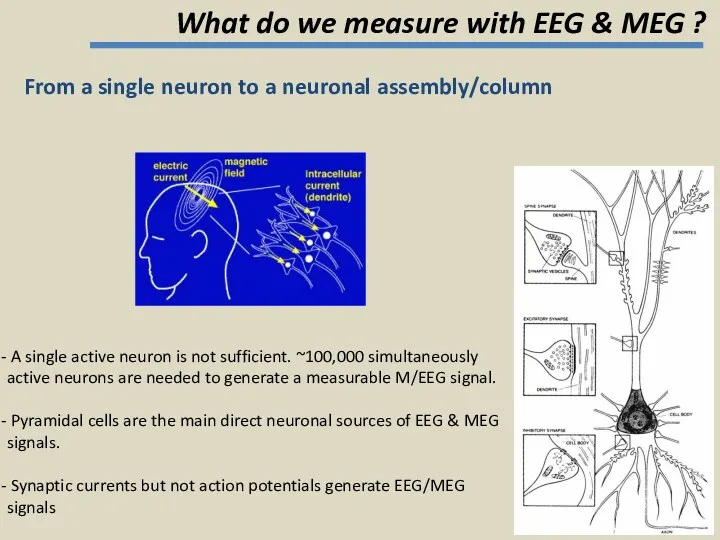
From a single neuron to a neuronal assembly/column
A single active
From a single neuron to a neuronal assembly/column
A single active
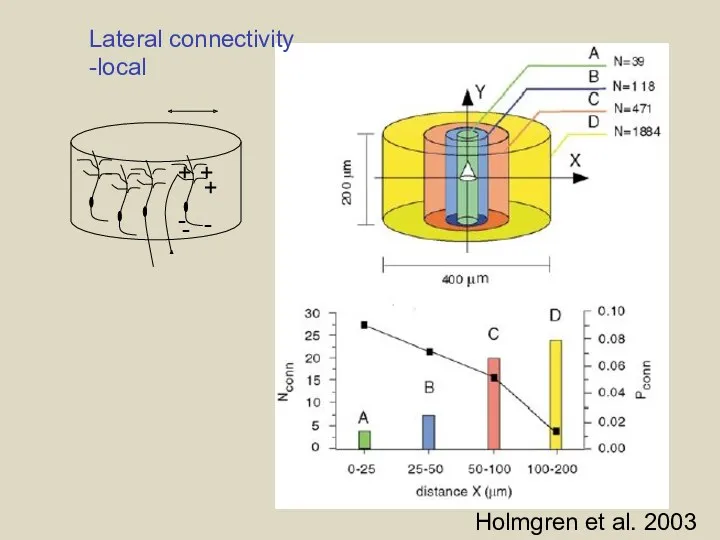
Holmgren et al. 2003
Lateral connectivity
-local
Holmgren et al. 2003
Lateral connectivity
-local
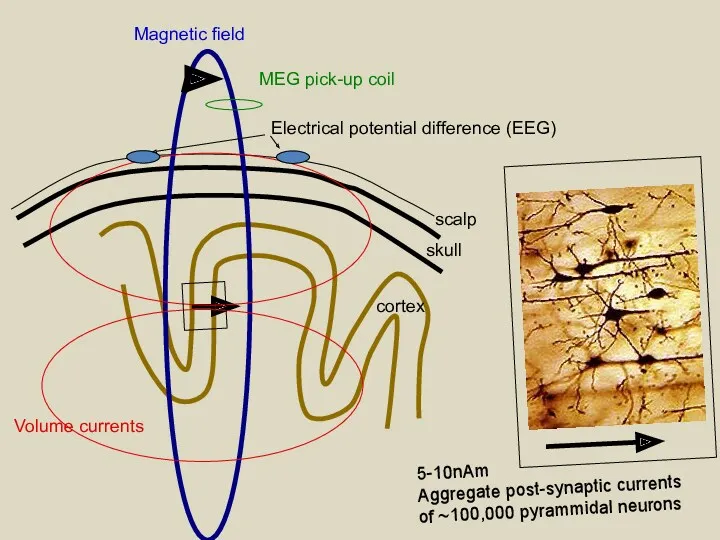
Volume currents
Magnetic field
Electrical potential difference (EEG)
5-10nAm
Aggregate post-synaptic currents
of ~100,000 pyrammidal
Volume currents
Magnetic field
Electrical potential difference (EEG)
5-10nAm
Aggregate post-synaptic currents
of ~100,000 pyrammidal
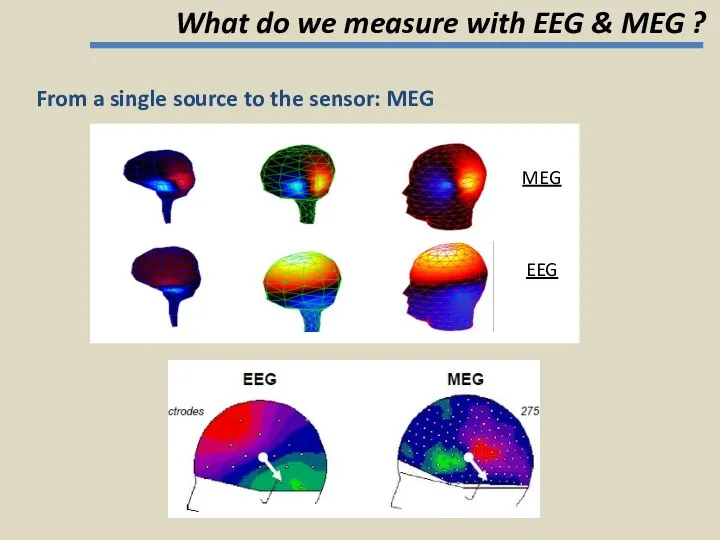
MEG
EEG
What do we measure with EEG & MEG ?
From a single
MEG
EEG
What do we measure with EEG & MEG ?
From a single
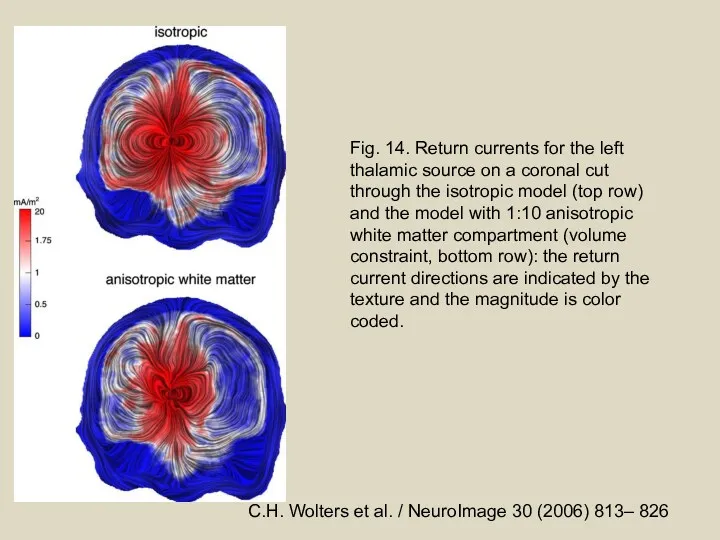
Fig. 14. Return currents for the left thalamic source on a
Fig. 14. Return currents for the left thalamic source on a
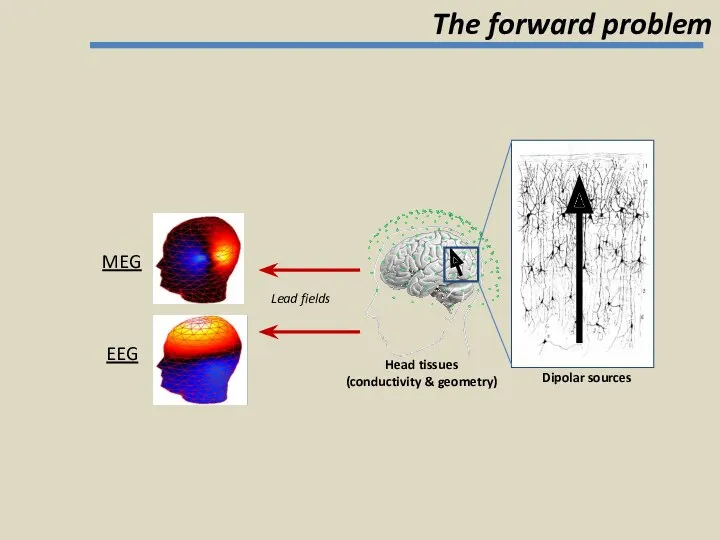
Lead fields
MEG
EEG
Dipolar sources
Head tissues
(conductivity & geometry)
The forward problem
Lead fields
MEG
EEG
Dipolar sources
Head tissues
(conductivity & geometry)
The forward problem
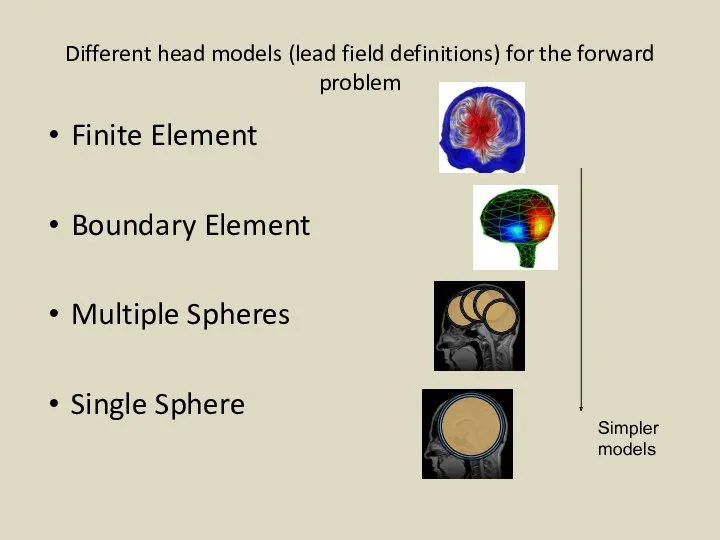
Different head models (lead field definitions) for the forward problem
Finite Element
Boundary
Different head models (lead field definitions) for the forward problem
Finite Element
Boundary
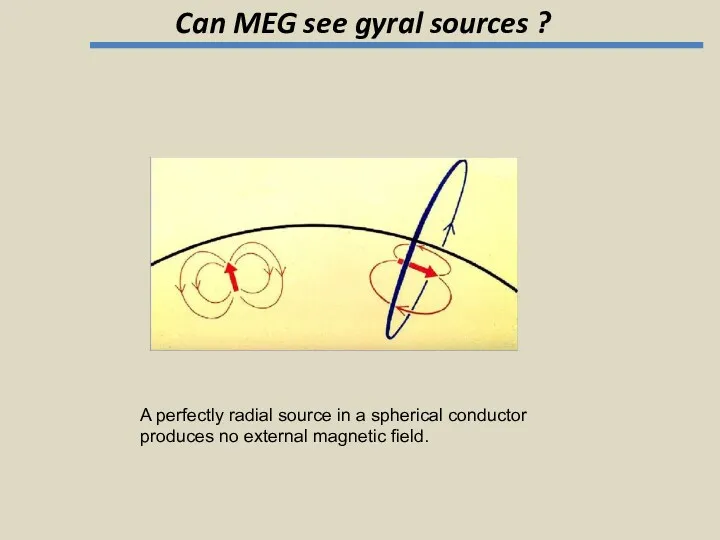
Can MEG see gyral sources ?
A perfectly radial source in a
Can MEG see gyral sources ?
A perfectly radial source in a
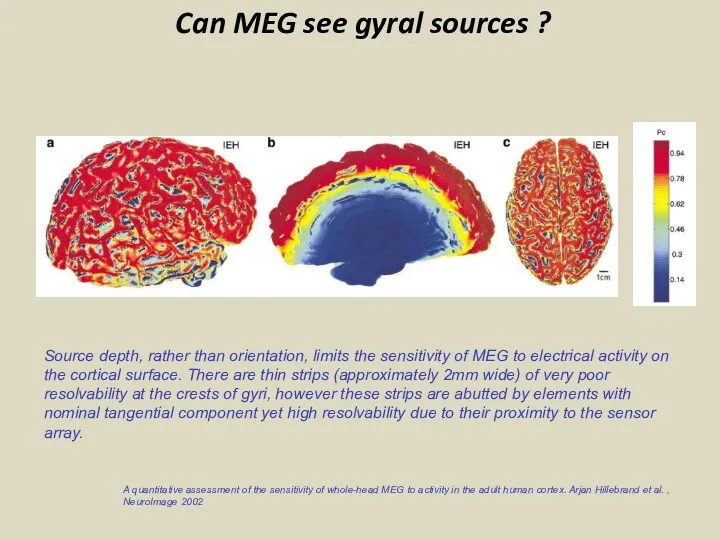
A quantitative assessment of the sensitivity of whole-head MEG to activity
A quantitative assessment of the sensitivity of whole-head MEG to activity
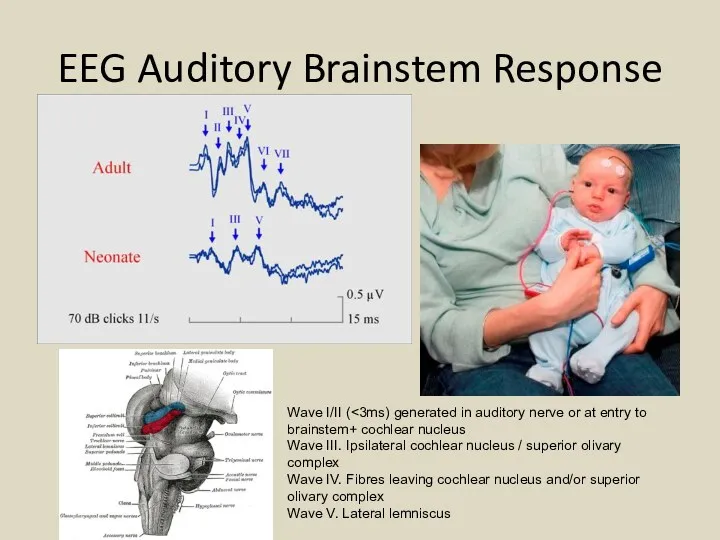
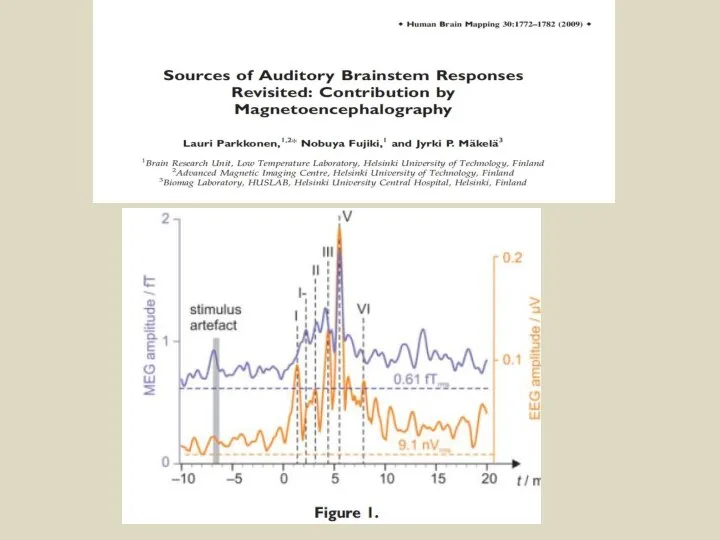
EEG Auditory Brainstem Response
Wave I/II (<3ms) generated in auditory nerve or
EEG Auditory Brainstem Response
Wave I/II (<3ms) generated in auditory nerve or
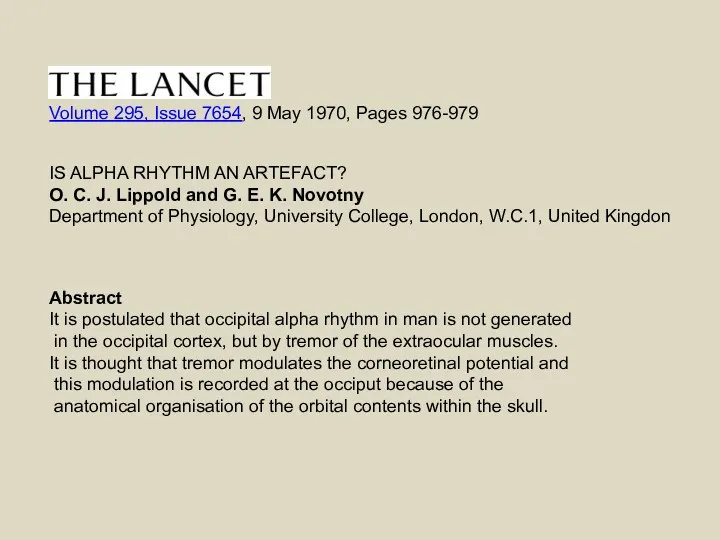
Volume 295, Issue 7654, 9 May 1970, Pages 976-979
IS ALPHA
Volume 295, Issue 7654, 9 May 1970, Pages 976-979
IS ALPHA
Summary
EEG is sensitive to deep (and radial) sources but a very
Summary
EEG is sensitive to deep (and radial) sources but a very
Supp_Motor_Area
Parietal_Sup
Frontal_Inf_Oper
Occipital_Mid
Frontal_Med_Orb
Calcarine
Heschl
Insula
Cingulum_Ant
ParaHippocampal
Hippocampus
Putamen
Amygdala
Caudate
Cingulum_Post
Brainstem
Thalamus
STN
Hung et al. 2010; Cornwell et al. 2007, 2008
Supp_Motor_Area
Parietal_Sup
Frontal_Inf_Oper
Occipital_Mid
Frontal_Med_Orb
Calcarine
Heschl
Insula
Cingulum_Ant
ParaHippocampal
Hippocampus
Putamen
Amygdala
Caudate
Cingulum_Post
Brainstem
Thalamus
STN
Hung et al. 2010; Cornwell et al. 2007, 2008
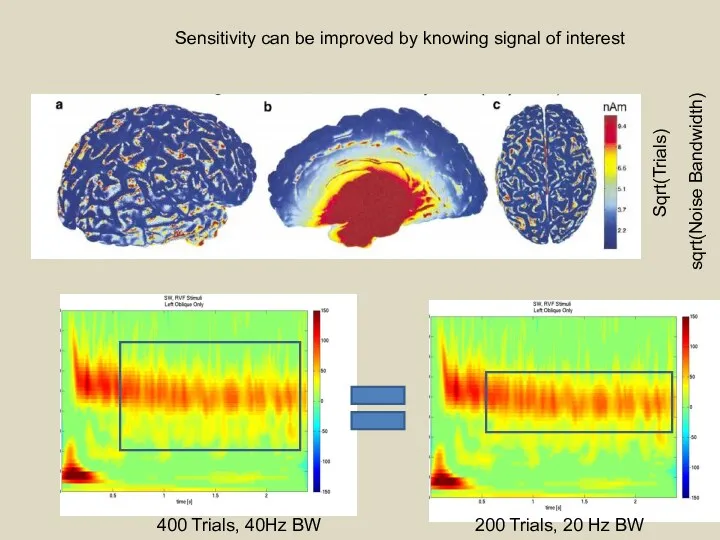
Sqrt(Trials)
sqrt(Noise Bandwidth)
400 Trials, 40Hz BW
200 Trials, 20 Hz BW
Sensitivity can be
sqrt(Noise Bandwidth)
400 Trials, 40Hz BW
200 Trials, 20 Hz BW
Sensitivity can be
Forward problem
Lead fields
MEG
EEG
Dipolar sources
Lead fields
forward
model
Forward problem
Lead fields
MEG
EEG
Dipolar sources
Lead fields
forward
model
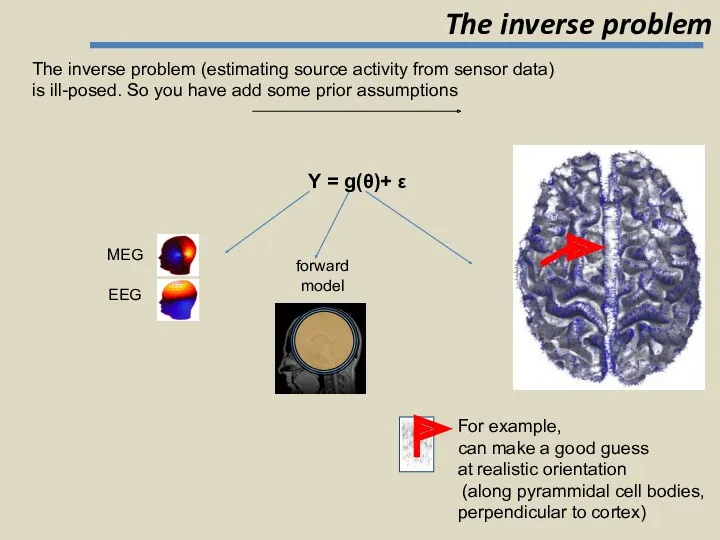
Y = g(θ)+ ε
forward
model
MEG
The inverse problem
For example,
can make a
Y = g(θ)+ ε
forward
model
MEG
The inverse problem
For example,
can make a
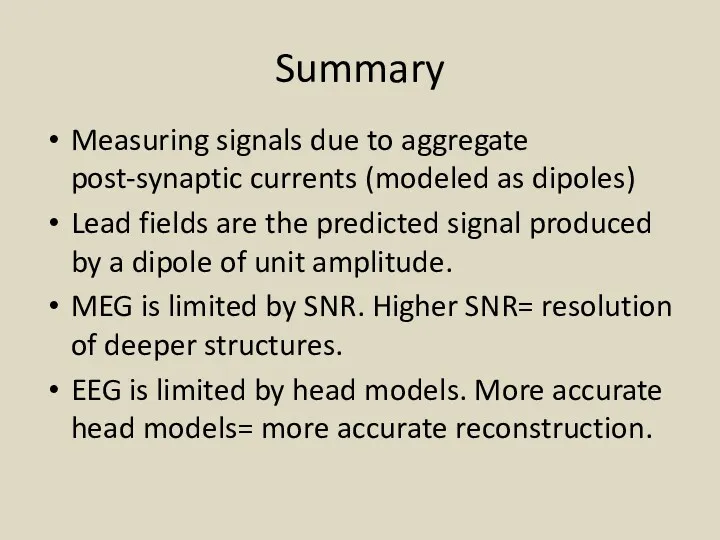
Summary
Measuring signals due to aggregate post-synaptic currents (modeled as dipoles)
Lead fields
Summary
Measuring signals due to aggregate post-synaptic currents (modeled as dipoles)
Lead fields
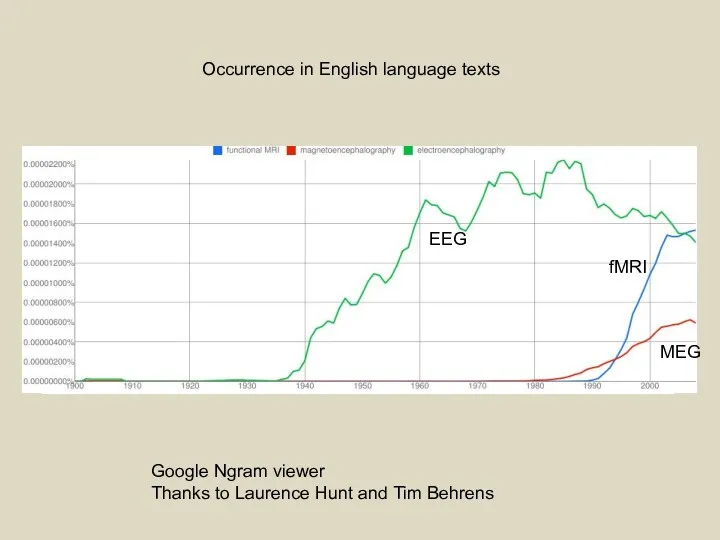
Google Ngram viewer
Thanks to Laurence Hunt and Tim Behrens
Occurrence in English
Google Ngram viewer
Thanks to Laurence Hunt and Tim Behrens
Occurrence in English
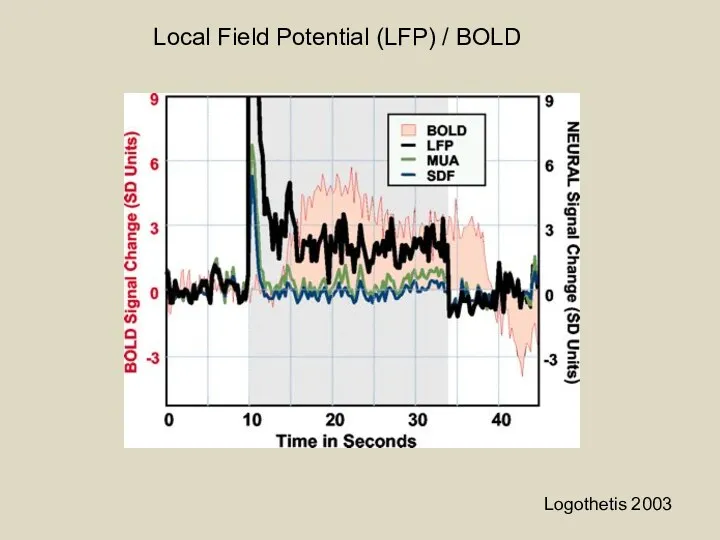
Logothetis 2003
Local Field Potential (LFP) / BOLD
Logothetis 2003
Local Field Potential (LFP) / BOLD
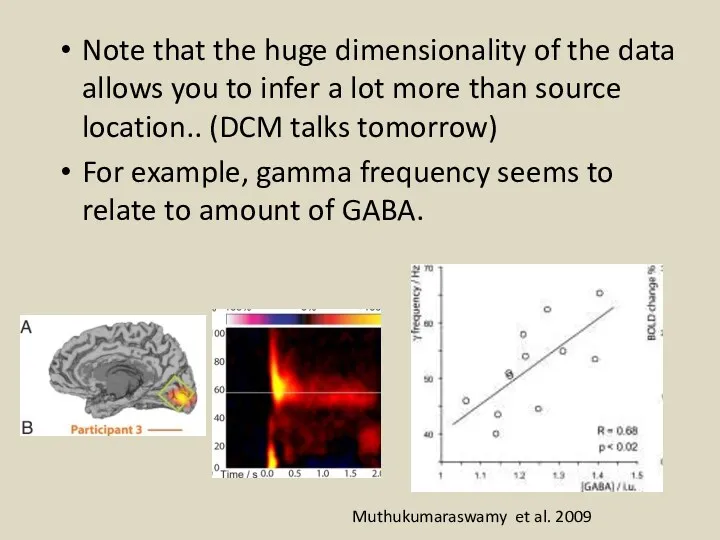
Note that the huge dimensionality of the data allows you to
Note that the huge dimensionality of the data allows you to
 Гнилостные бактерии
 Необычные приветствия. Сквернословие
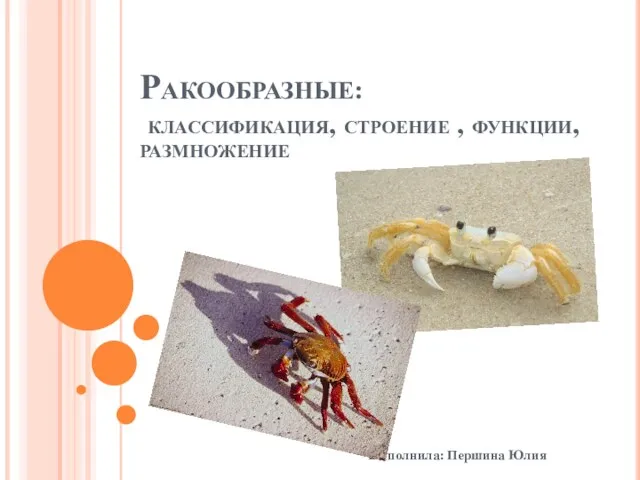 Ракообразные. Классификация, строение, функции, размножение
 Покрытосеменные, или Цветковые
 Игра. Угадай животное
 Cattle breeds
 Биологические науки
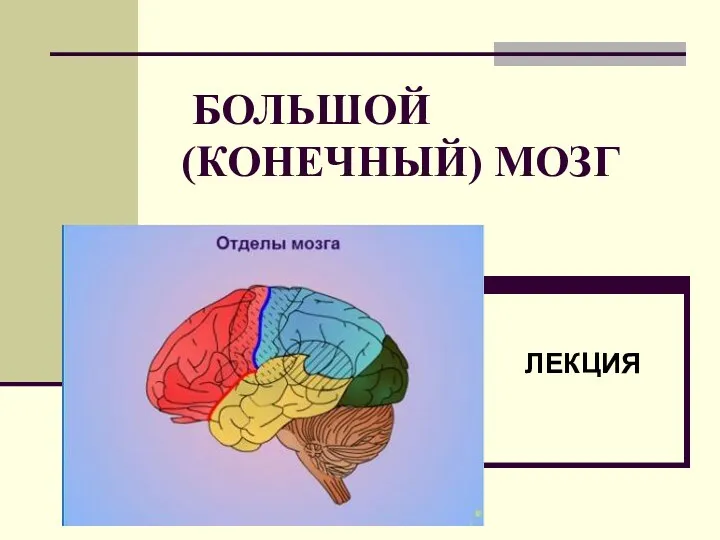 Большой (конечный) мозг
 Створення зелених насаджень
 Репликация и транскрипция
 Надцарство доядерные
 Эндокринная система
 Видоизменения побегов
 Биология – наука о живом мире. Общие свойства живых организмов.
 Цитоплазматическая наследственность
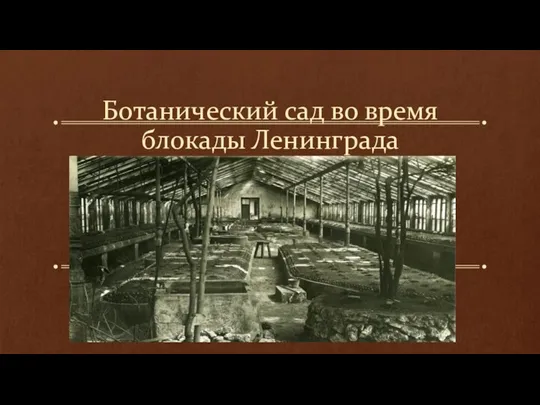 Ботанический сад во время блокады Ленинграда
 Презентация по теме Постэмбриональное развитие
 Класс насекомые. Стрекозы
 Пришкольный участок. Уход за растениями
 Квезаль - священная птица индейцев майя
 Основы здорового питания собак и кошек
 Биогенетический закон
 Отряд приматы
 Развитие жизни в протерозойской и палеозойской эрах
 Разведение кроликов
 Органы и системы органов животных
 Наследственность и изменчивость организмов
 Кабинет биологии, фото