- Classification of Analytical Methods

Содержание
- 2. Internal and interdisciplinary interfaces in the realm of Chemistry
- 3. Analytical Chemistry Internal interfaces with other chemical areas (e.g. organic, inorganic, physical and applied chemistry, chemical
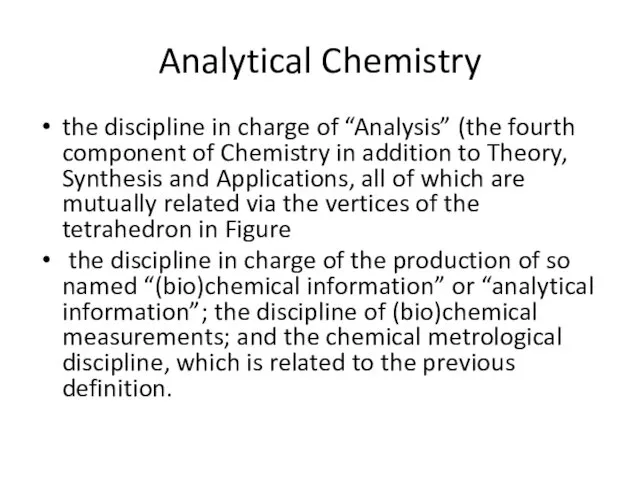
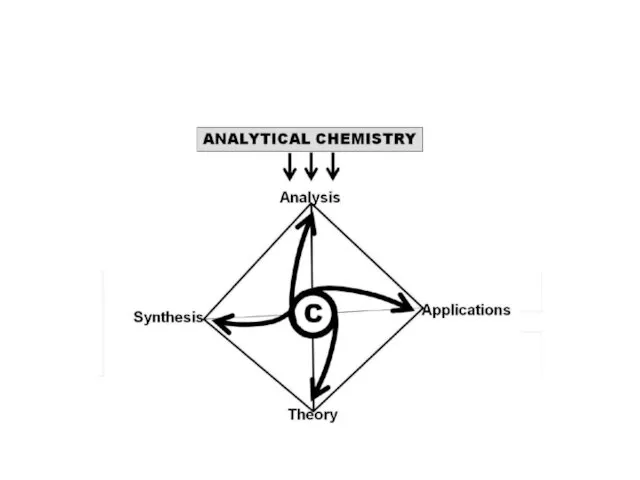
- 4. Analytical Chemistry the discipline in charge of “Analysis” (the fourth component of Chemistry in addition to
- 6. Definitions: “Analytical Chemistry is a scientific discipline that develops and applies methods, instruments and strategies to
- 7. Analytical Chemistry has two essential aims. the obtainment of as high metrological quality as possible (i.e.
- 8. Quality indicators Top or capital analytical properties Accuracy Reliability Representativeness Basic analytical properties Precision Sensitivity Selectivity
- 9. Classification of techniques by the type of analytical technique – classical or instrumental techniques; by the
- 10. Basic Equipment and Instrumentation Photo of a typical electronic balance. beaker graduated cylinder
- 11. Basic Equipment and Instrumentation volumetric flask dropping pipet Proper means of reading the meniscus on a
- 12. Classical Methods: Separation of analytes by precipitation, extraction, or distillation. Qualitative analysis by reaction of analytes
- 13. Titrimetric Analysis The term titrimetric analysis refers to quantitative chemical analysis carried out by determining the
- 14. For use in titrimetric analysis a reaction must have the following conditions 1- There must be
- 15. Definition of some terms Titration is the process in which the standard reagent is added to
- 16. Indicators Indicators are often added to analyte solution in order to give an observable physical change
- 17. Titrimetric curve
- 18. Classification of reaction in titrimetric analysis Neutralization reaction, or acidimetry and alkalimetry. These include thetitration of
- 19. Instrumental Methods: Measurements of physical properties of analytes, such as conductivity, electrode potential, light absorption, or
- 20. The advantages of instrumental methods over classical methods include: 1. The ability to perform trace analysis,
- 21. Instrumental analysis can be further classified according to the principles by which the measurement signal is
- 22. Lists the names of instrumental methods that are based upon various analytical signals.
- 23. Electrochemical methods of analysis in which the analyte participates in a redox reaction or other process.
- 24. Spectrochemical methods of analysis in which the analyte interacts with electromagnetic radiation. Most of the methods
- 25. The technique of mass spectroscopy in which the analyte is ionized and subsequently detected. Although in
- 26. Single-Channel vs Multi-Channel Techniques single-channel techniques will generate but a single number for each analysis of
- 27. Multi-channel methods have two important advantages over their single-channel counterparts: 1. They provide the ability to
- 28. Relative vs Absolute Techniques Another way of classifying analytical techniques is according to the method by
- 29. The difference between absolute and relative techniques is that the latter requires additional measurements in order
- 30. Characterization of analytical techniques
- 31. Calibration Curve Method For any instrumental method used for quantitative chemical analysis, there is some functional
- 32. Typical calibration curve The instrument response is measured for a series of calibration standards, which contain
- 33. The following points should be made about this method of quantitation: The central philosophy of the
- 34. Electroanalytical methods Electroanalytical methods are a class of techniques in analytical chemistry which study an analyte
- 36. Скачать презентацию
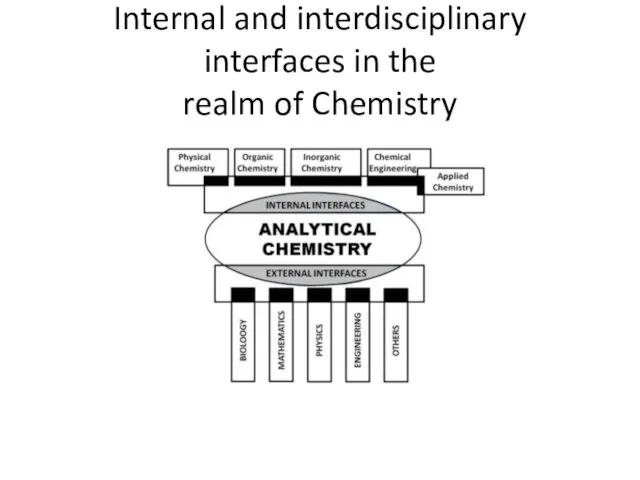
Internal and interdisciplinary interfaces in the
realm of Chemistry
Internal and interdisciplinary interfaces in the
realm of Chemistry

Analytical Chemistry
Internal interfaces with other chemical areas (e.g. organic, inorganic, physical
Analytical Chemistry
Internal interfaces with other chemical areas (e.g. organic, inorganic, physical
Analytical Chemistry
the discipline in charge of “Analysis” (the fourth component of
Analytical Chemistry
the discipline in charge of “Analysis” (the fourth component of
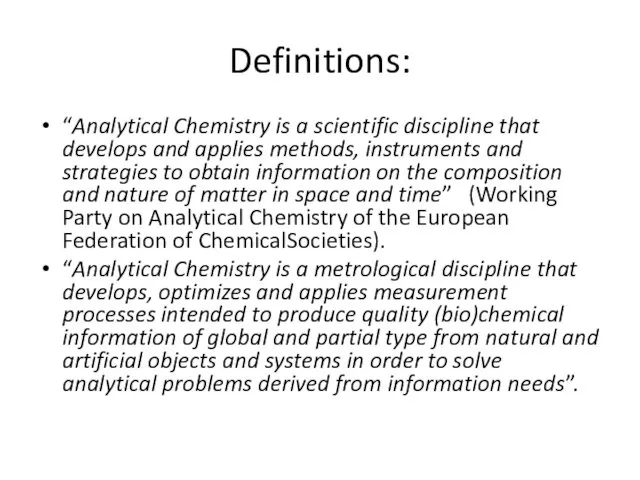
Definitions:
“Analytical Chemistry is a scientific discipline that develops and applies methods,
Definitions:
“Analytical Chemistry is a scientific discipline that develops and applies methods,
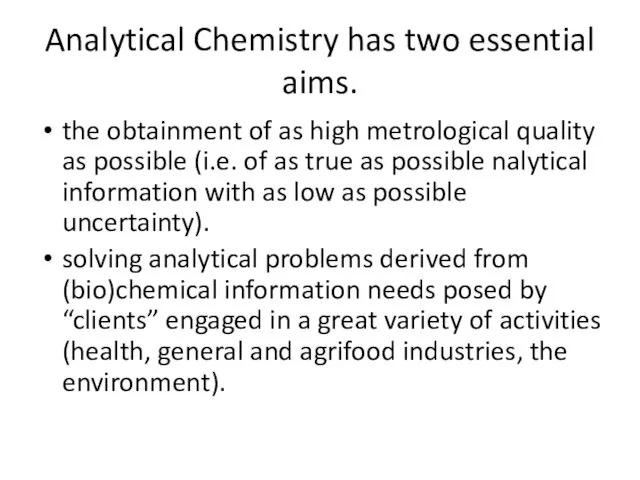
Analytical Chemistry has two essential aims.
the obtainment of as high
Analytical Chemistry has two essential aims.
the obtainment of as high
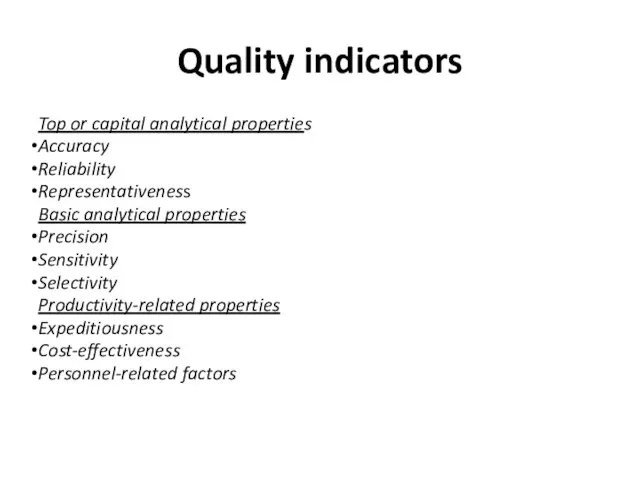
Quality indicators
Top or capital analytical properties
Accuracy
Reliability
Representativeness
Basic analytical
Quality indicators
Top or capital analytical properties
Accuracy
Reliability
Representativeness
Basic analytical
Classification of techniques
by the type of analytical technique – classical
Classification of techniques
by the type of analytical technique – classical
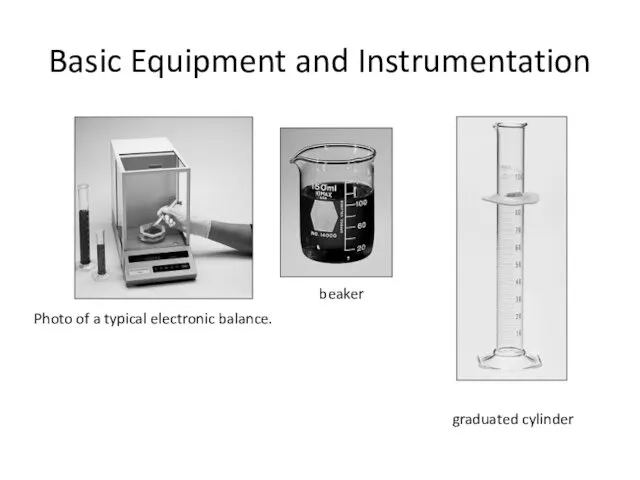
Basic Equipment and Instrumentation
Photo of a typical electronic balance.
beaker
graduated cylinder
Basic Equipment and Instrumentation
Photo of a typical electronic balance.
beaker
graduated cylinder
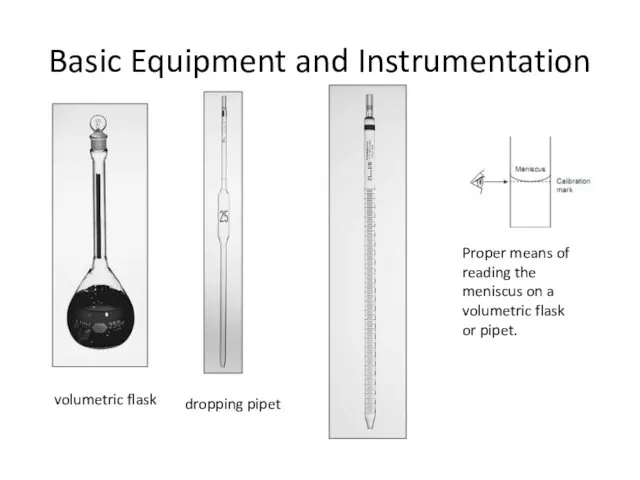
Basic Equipment and Instrumentation
volumetric flask
dropping pipet
Proper means of reading the meniscus
Basic Equipment and Instrumentation
volumetric flask
dropping pipet
Proper means of reading the meniscus
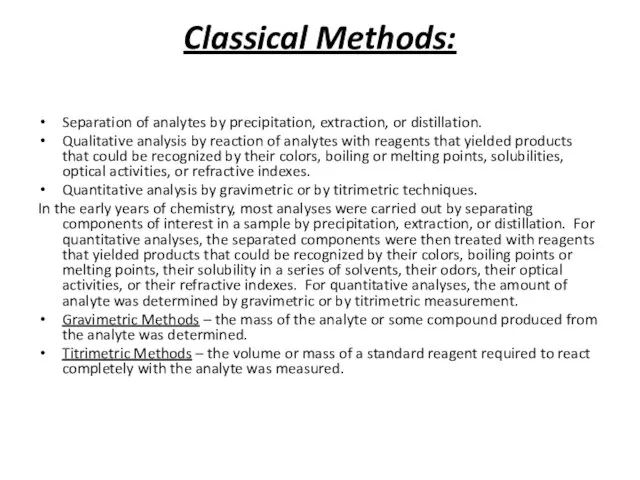
Classical Methods:
Separation of analytes by precipitation, extraction, or distillation.
Qualitative analysis by
Classical Methods:
Separation of analytes by precipitation, extraction, or distillation.
Qualitative analysis by
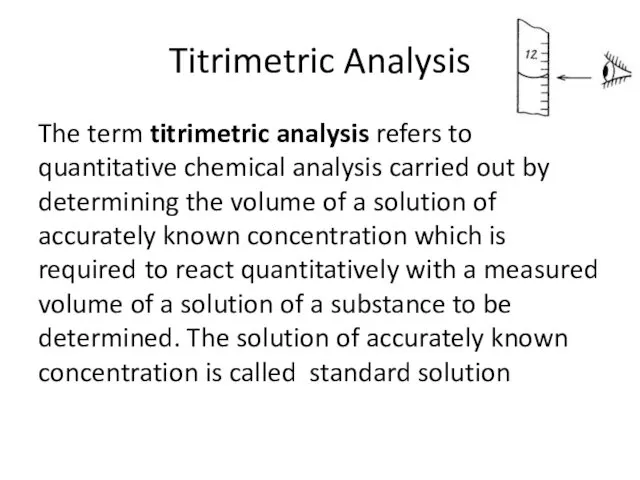
Titrimetric Analysis
The term titrimetric analysis refers to quantitative chemical analysis carried
Titrimetric Analysis
The term titrimetric analysis refers to quantitative chemical analysis carried
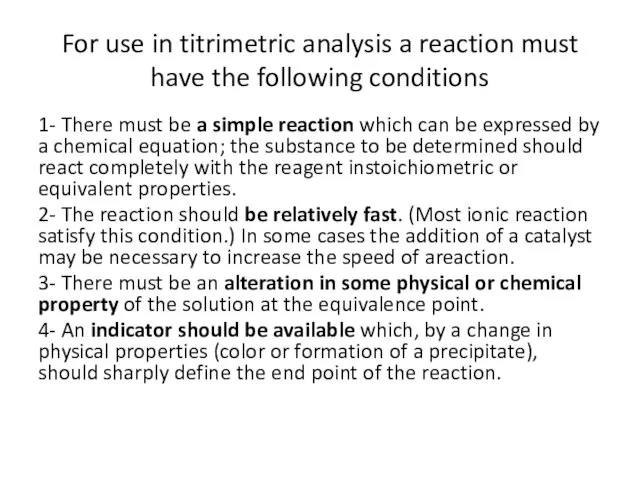
For use in titrimetric analysis a reaction must have the following
For use in titrimetric analysis a reaction must have the following
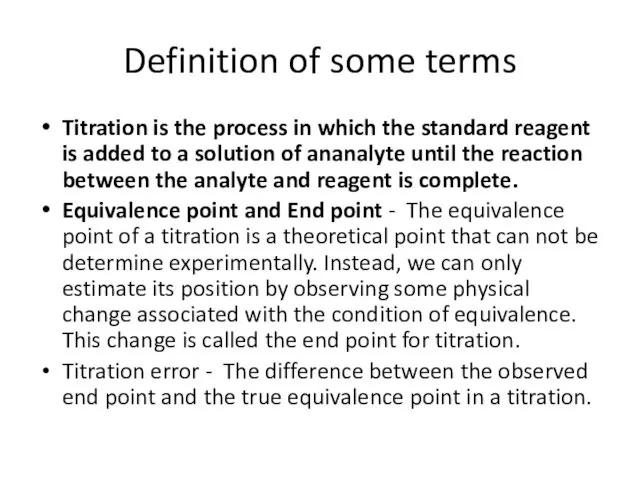
Definition of some terms
Titration is the process in which the standard
Definition of some terms
Titration is the process in which the standard
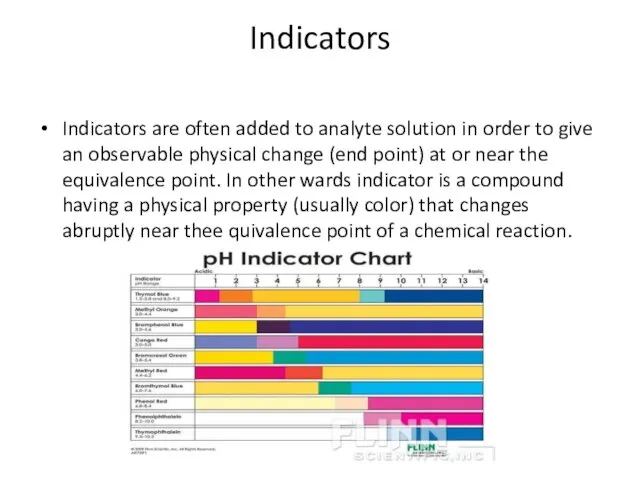
Indicators
Indicators are often added to analyte solution in order to give
Indicators
Indicators are often added to analyte solution in order to give
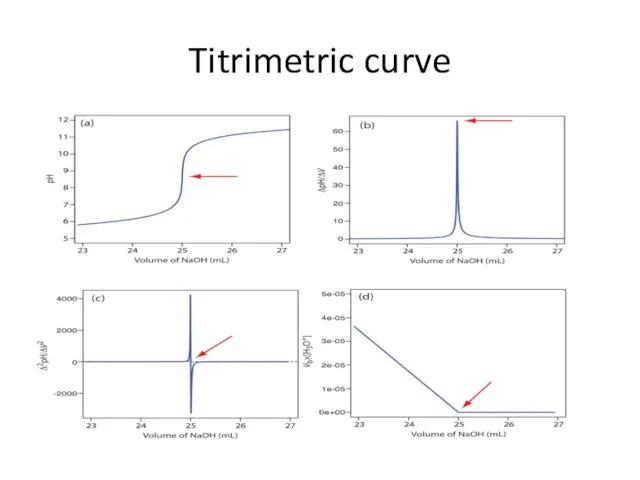
Titrimetric curve
Titrimetric curve
Classification of reaction in titrimetric analysis
Neutralization reaction, or acidimetry and alkalimetry.
Classification of reaction in titrimetric analysis
Neutralization reaction, or acidimetry and alkalimetry.
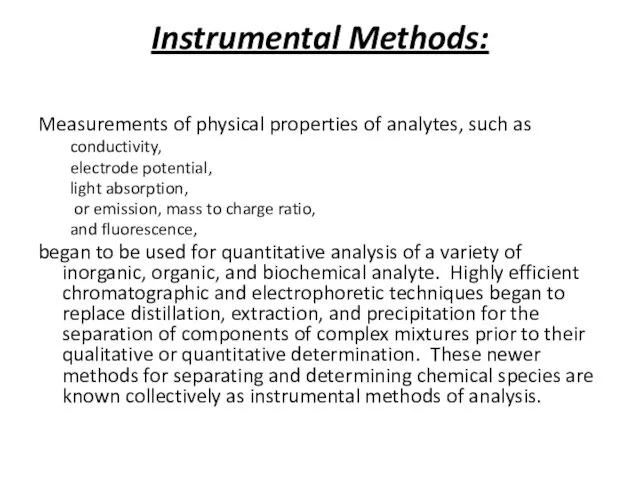
Instrumental Methods:
Measurements of physical properties of analytes, such as
conductivity,
electrode
Instrumental Methods:
Measurements of physical properties of analytes, such as
conductivity,
electrode
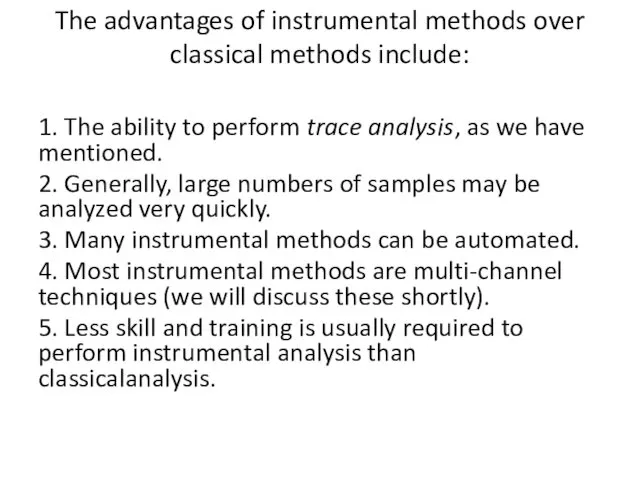
The advantages of instrumental methods over classical methods include:
1. The ability
The advantages of instrumental methods over classical methods include:
1. The ability
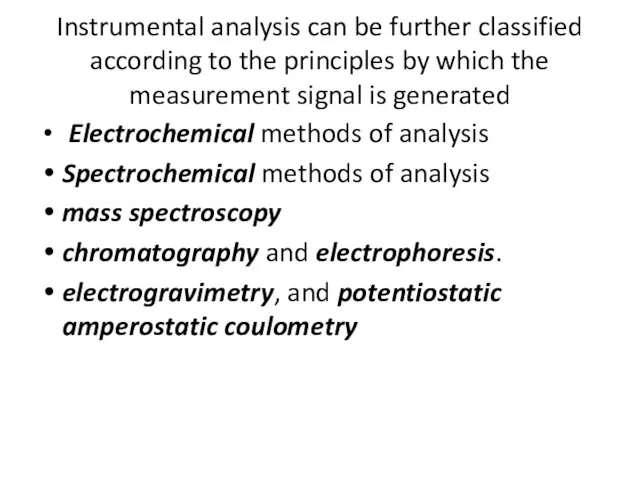
Instrumental analysis can be further classified according to the principles by
Instrumental analysis can be further classified according to the principles by
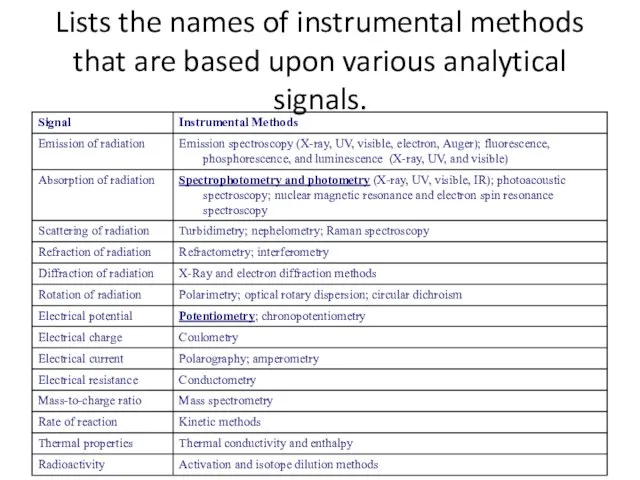
Lists the names of instrumental methods that are based upon various
Lists the names of instrumental methods that are based upon various
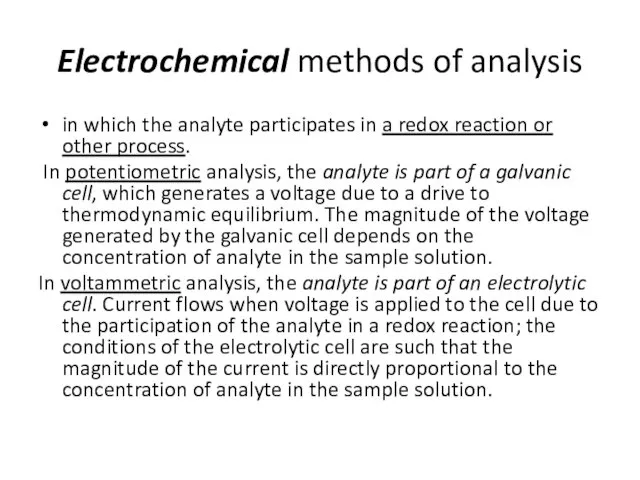
Electrochemical methods of analysis
in which the analyte participates in a redox
Electrochemical methods of analysis
in which the analyte participates in a redox
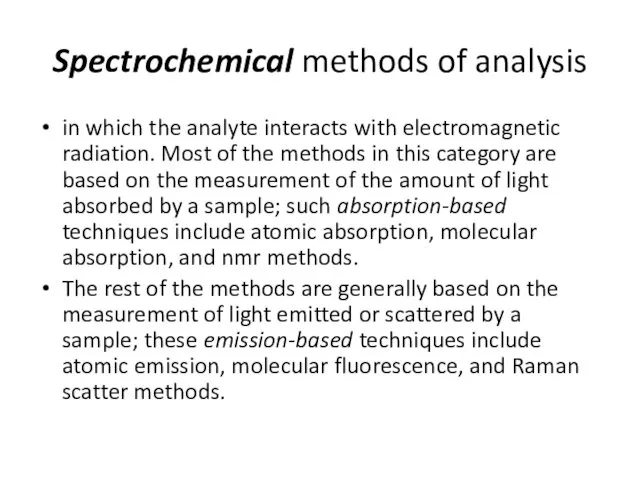
Spectrochemical methods of analysis
in which the analyte interacts with electromagnetic radiation.
Spectrochemical methods of analysis
in which the analyte interacts with electromagnetic radiation.

The technique of mass spectroscopy
in which the analyte is ionized and
The technique of mass spectroscopy
in which the analyte is ionized and
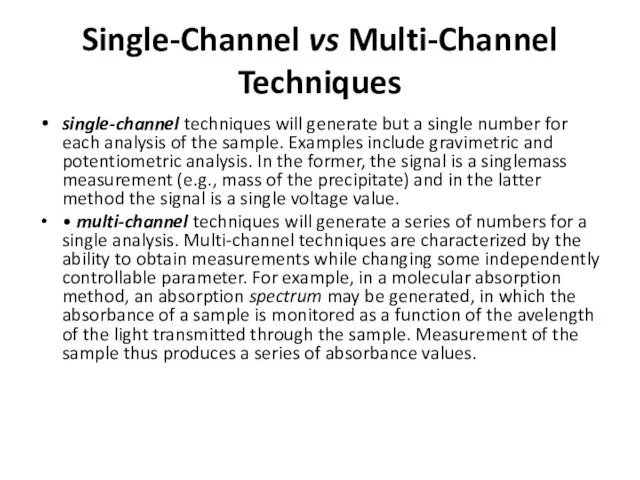
Single-Channel vs Multi-Channel Techniques
single-channel techniques will generate but a single number
Single-Channel vs Multi-Channel Techniques
single-channel techniques will generate but a single number
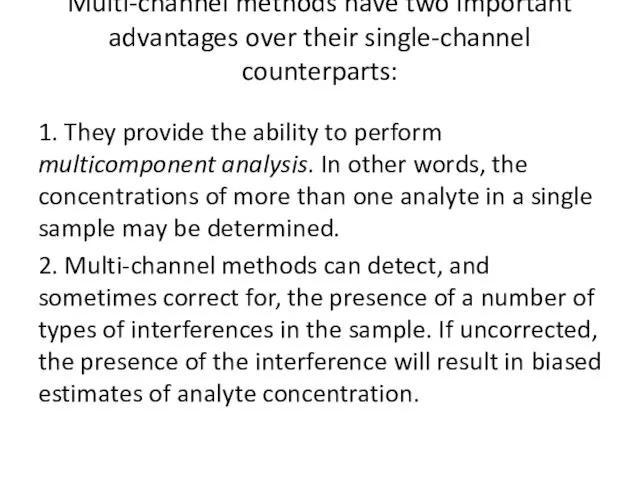
Multi-channel methods have two important advantages over their single-channel counterparts:
1. They
Multi-channel methods have two important advantages over their single-channel counterparts:
1. They
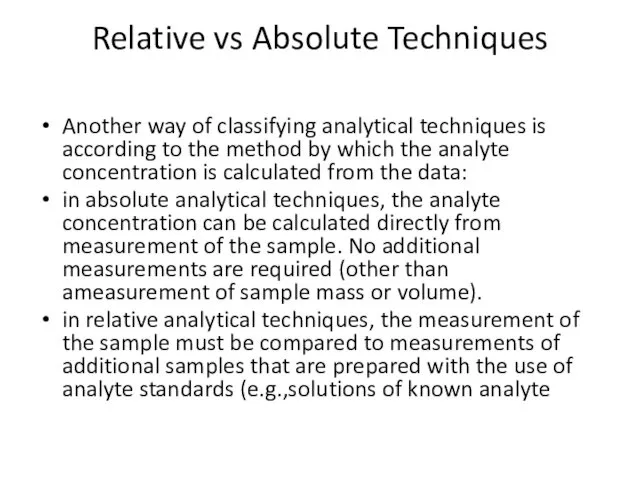
Relative vs Absolute Techniques
Another way of classifying analytical techniques is according
Relative vs Absolute Techniques
Another way of classifying analytical techniques is according

The difference between absolute and relative techniques is that the latter
The difference between absolute and relative techniques is that the latter
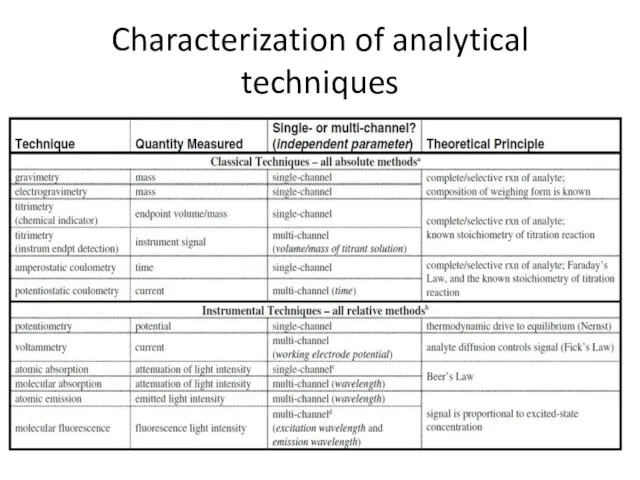
Characterization of analytical techniques
Characterization of analytical techniques
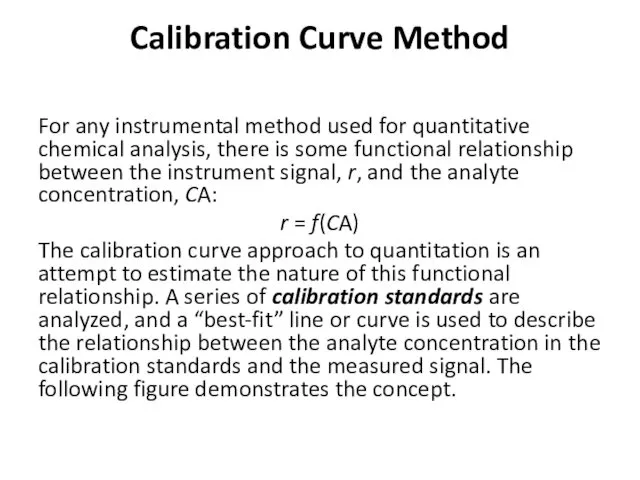
Calibration Curve Method
For any instrumental method used for quantitative chemical analysis,
Calibration Curve Method
For any instrumental method used for quantitative chemical analysis,
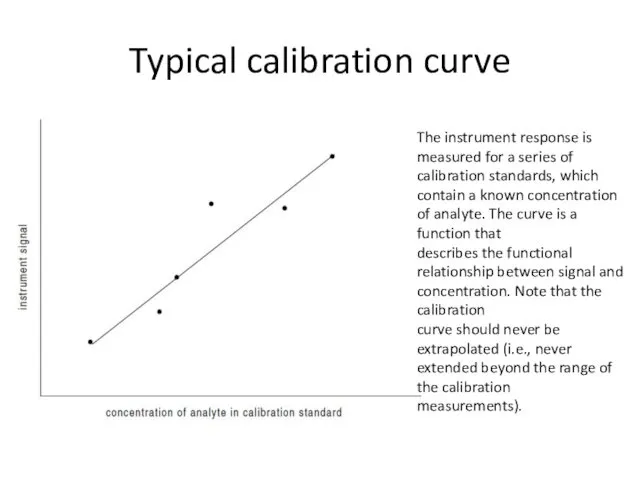
Typical calibration curve
The instrument response is measured for a series of
calibration
Typical calibration curve
The instrument response is measured for a series of
calibration
The following points should be made about this method of quantitation:
The
The following points should be made about this method of quantitation:
The
Electroanalytical methods
Electroanalytical methods are a class of techniques in analytical chemistry
Electroanalytical methods
Electroanalytical methods are a class of techniques in analytical chemistry
 Мале Полісся
 Оценка радиационного фона в зоне влияния отвалов угледобывающей промышленности в Луганской области
 Особо охраняемые территории России. Заповедники
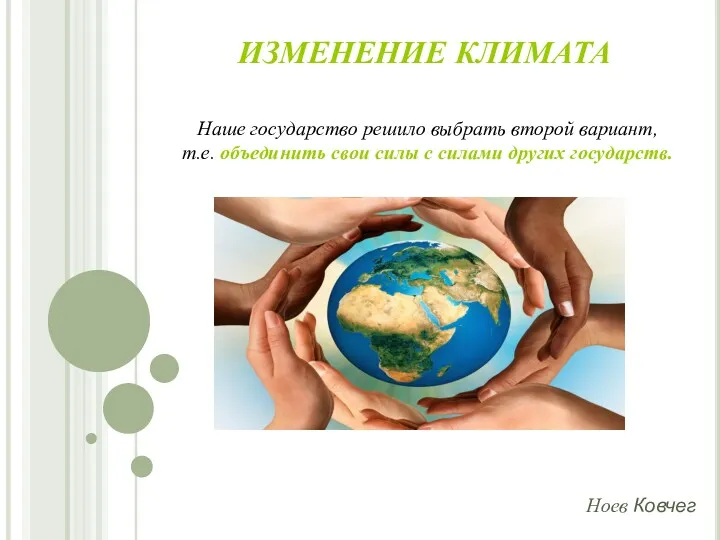 Изменение климата Земли
 Water pollutions
 презентация био 0804
 Экологическая экспертиза
 Методы и организация комплексного геоэкологического мониторинга
 Збережи природу
 Экологический кризис
 Влияние экологических факторов Земли на растения
 Экологический подход, как методология современного образования
 Учение о биосфере презентация по экологии по учебнику Зверев А.Т. Зверева Е.Г
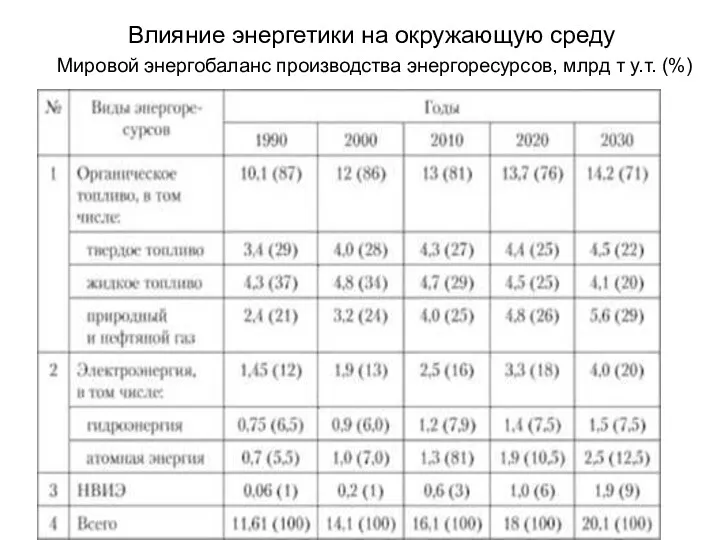 Влияние энергетики на окружающую среду. Мировой энергобаланс производства энергоресурсов
 Экологические проблемы городов народных республик Донбасса
 The pollution of lake Baikal
 Влияние экологии на здоровье человека
 Санитарлық қорғау зоналары және шығарындыларды шектеу
 Проблемы экологии в современном мире
 Правила поведения в лесу
 Глобальные экологические проблемы современности
 Экология Черного моря
 презентация Породы деревьев произрастающие на Шаимской территории
 Збалансоване природокористування
 Биосфера и человек
 Основы природопользования. (Экологическое образование и воспитание.)
 Экологический отряд Клевер
 Особливості сучасної цивілізації