- Analysis of financial and economic activities

Содержание
- 2. CHAPTER 1. CONCEPT, SUBJECT AND METHOD OF ECONOMIC ANALYSIS 1.1 The concept of economic analysis 1.2
- 3. 1.1 THE CONCEPT OF ECONOMIC ANALYSIS Economic analysis is a means to help bring about a
- 4. ECONOMIC ANALYSIS An economic analysis or evaluation is a process carried out by economists, statisticians and
- 5. THE MAIN TASKS OF ECONOMIC ANALYSIS objective and comprehensive assessment of the degree of implementation of
- 6. 1.2 CHARACTERISTICS OF THE BASIC METHODS OF ECONOMIC ANALYSIS
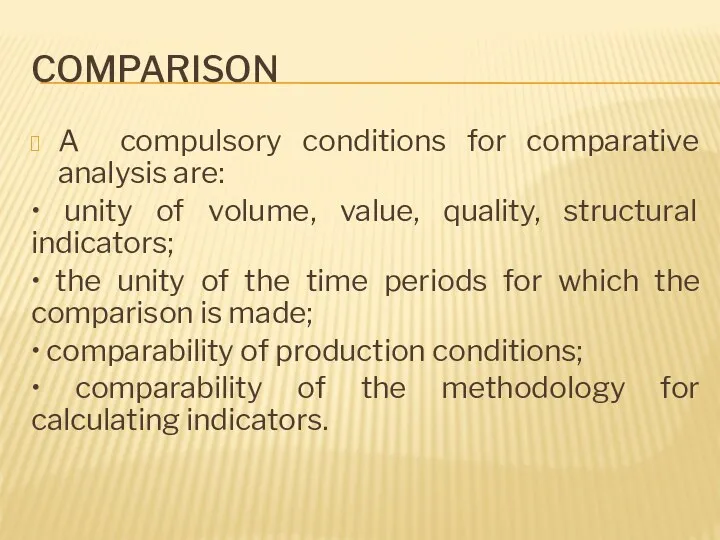
- 7. COMPARISON A compulsory conditions for comparative analysis are: • unity of volume, value, quality, structural indicators;
- 8. THE BALANCE METHOD
- 10. In deterministic models, the output of the model is fully determined by the parameter values and
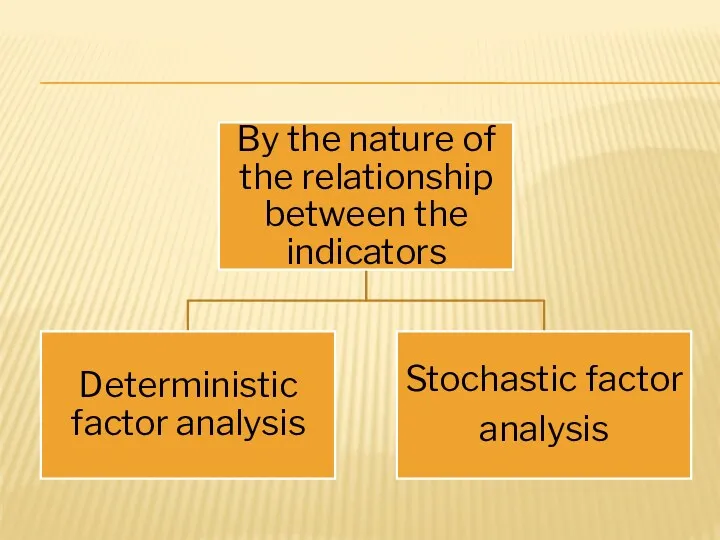
- 11. 1.3 METHODOLOGY OF FACTOR ANALYSIS All phenomena and processes of economic activity of enterprises are in
- 12. THE BASIC PROPERTIES OF THE DETERMINISTIC APPROACH TO ANALYSIS: • constructing a deterministic model through logical
- 13. TYPES OF DETERMINISTIC APPROACHES
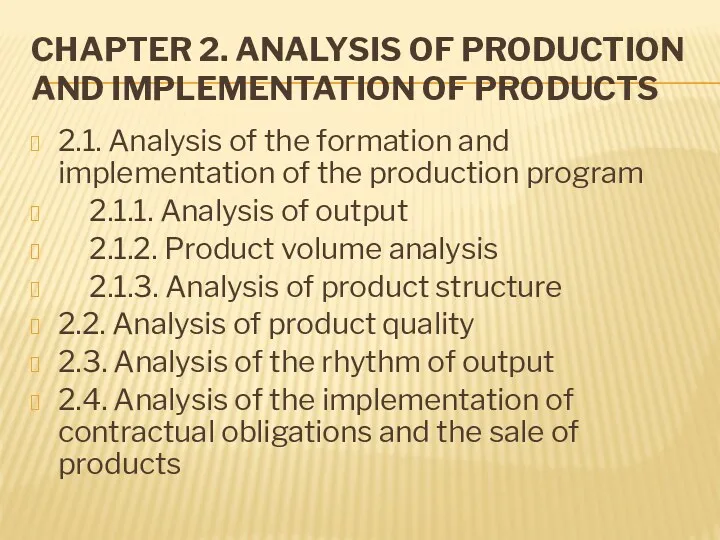
- 14. CHAPTER 2. ANALYSIS OF PRODUCTION AND IMPLEMENTATION OF PRODUCTS 2.1. Analysis of the formation and implementation
- 15. Enterprises independently plan their activities on the basis of contracts concluded with consumers of products and
- 16. STAGES OF STUDY OF OUTPUT INDICATORS
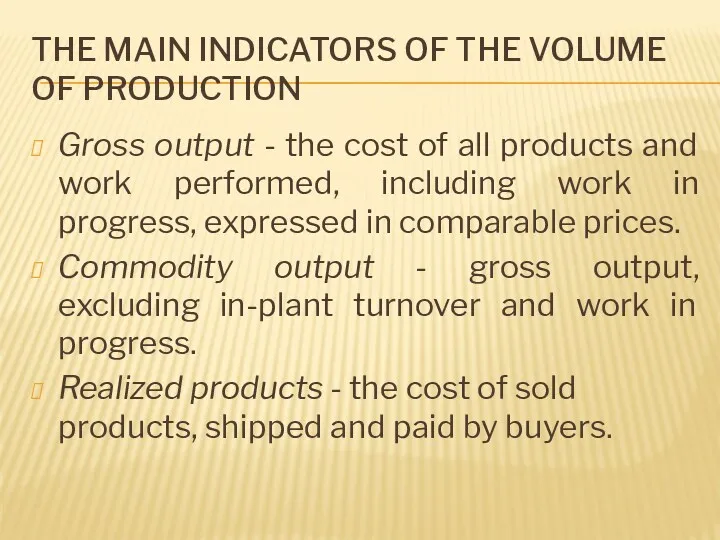
- 17. THE MAIN INDICATORS OF THE VOLUME OF PRODUCTION Gross output - the cost of all products
- 18. 2.1. ANALYSIS OF THE FORMATION AND IMPLEMENTATION OF THE PRODUCTION PROGRAM The cost indicators of output
- 19. «Методика переоценки объектов бухгалтерского учета в текущую стоимость». ВП1ЦП = ВП1 : Jц , где ВП1
- 20. 2.1.1. PRODUCT VOLUME ANALYSIS The analysis of the volume of production begins with the study of
- 21. The dynamics of commercial output Where ТПi-1; ТПi – volume of commercial output in value terms
- 22. 2.1.2. PRODUCT RANGE ANALYSIS An essential element of the analytical work is the analysis of the
- 23. ANALYSIS OF THE IMPLEMENTATION OF THE PLAN FOR THE ASSORTMENT (RANGE)
- 24. ВПа = ВПn : ВП0 х 100%, где ВПа - выполнение плана по ассортименту, %; ВПn
- 25. In this case the product produced over the plan or not in the plan are not
- 26. External changes in market conditions demand for certain types of products untimely entry of production capacities
- 27. 2.1.3. ANALYSIS OF PRODUCT STRUCTURE The product structure is the ratio of individual types of products
- 28. РАСЧЕТ ВЛИЯНИЯ СТРУКТУРНЫХ СДВИГОВ Метод прямого счета по всем изделиям Метод средних цен и т.д
- 29. ПРЯМОЙ СЧЕТ ПО ВСЕМ ВИДАМ ИЗДЕЛИЙ ПРОИЗВОДИТСЯ ПО ФОРМУЛЕ ΔВПс = ВП1 – ВП1, 0 ,
- 30. ПРИ ИСПОЛЬЗОВАНИИ СРЕДНИХ ЦЕН РАСЧЕТ ПРОИЗВОДИТСЯ ПО ФОРМУЛЕ Δ ВПс = (Ц1 – Цо) . VВП1,
- 31. ФАКТИЧЕСКИЙ ВЫПУСК ПРОДУКЦИИ ПРИ ПЛАНОВОЙ СТРУКТУРЕ
- 32. АНАЛИЗ СТРУКТУРЫ ПРОДУКЦИИ
- 33. 2.2. ANALYSIS OF PRODUCT QUALITY Product quality is a combination of product features that can meet
- 34. TYPES OF PRODUCT QUALITY INDICATORS Individual utility manufacturability (labor intensity and energy intensity) reliability Indirect fines
- 35. Качество продукции является параметром, оказывающим влияние на такие стоимостные показатели работы предприятия, как выпуск продукции (ВП),
- 36. Изменение качества затрагивает прежде всего изменение цены и себестоимости продукции, поэтому формулы для расчета будут иметь
- 37. Defect Correctible Irreclaimable Internal (identified in the enterprise) External (identified by customer)
- 38. ОПРЕДЕЛИТЬ ПОТЕРИ ПРОДУКЦИИ Стоимость товарной продукции в действительных ценах составляет 104300 тыс тн Себестоимость ТП 84168
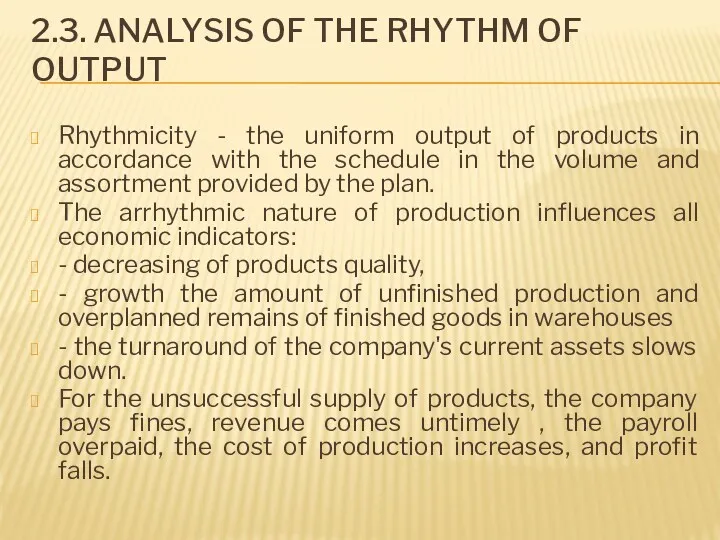
- 39. 2.3. ANALYSIS OF THE RHYTHM OF OUTPUT Rhythmicity - the uniform output of products in accordance
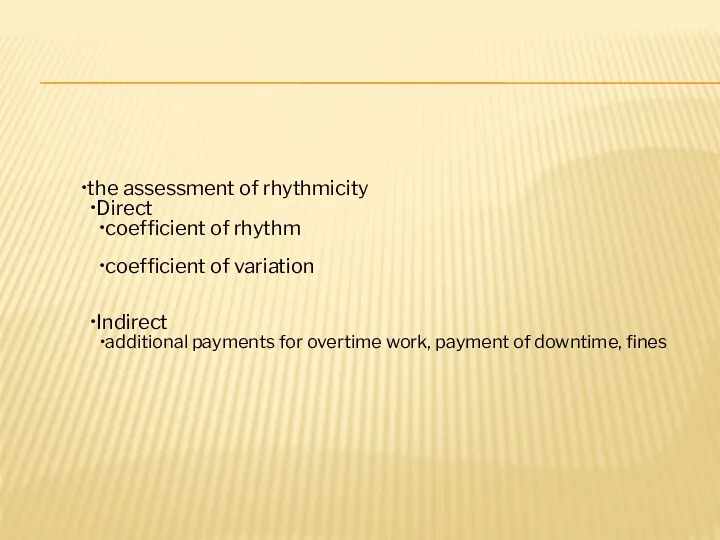
- 40. the assessment of rhythmicity Direct coefficient of rhythm coefficient of variation Indirect additional payments for overtime
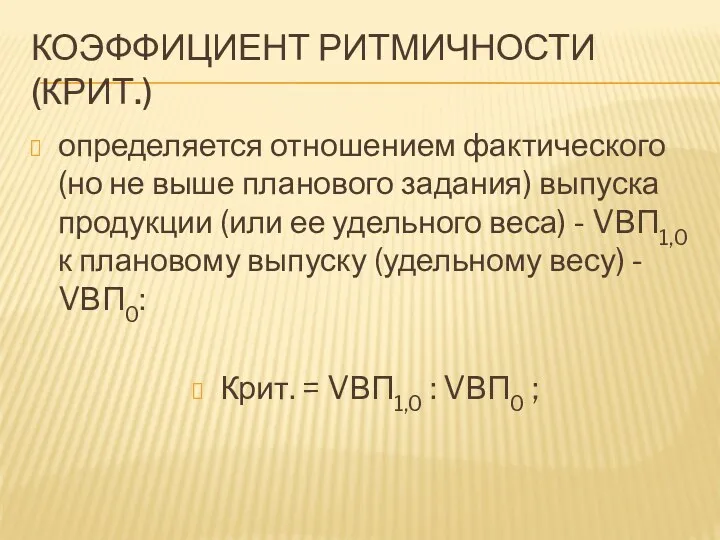
- 41. КОЭФФИЦИЕНТ РИТМИЧНОСТИ (КРИТ.) определяется отношением фактического (но не выше планового задания) выпуска продукции (или ее удельного
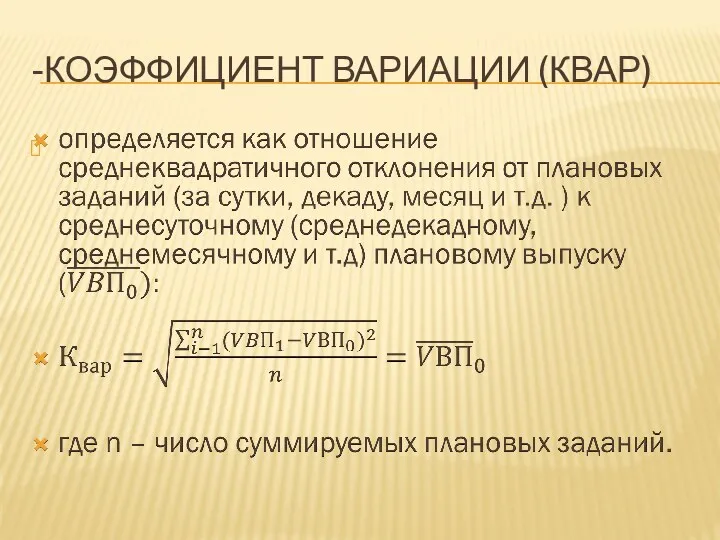
- 42. -КОЭФФИЦИЕНТ ВАРИАЦИИ (КВАР)
- 43. 2.4. ANALYSIS OF THE IMPLEMENTATION OF CONTRACTUAL OBLIGATIONS AND THE SALE OF PRODUCTS На изменение объема
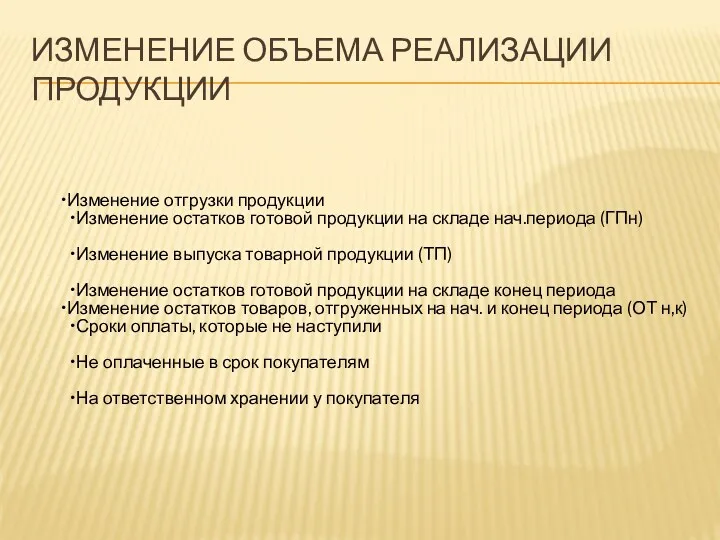
- 44. ИЗМЕНЕНИЕ ОБЪЕМА РЕАЛИЗАЦИИ ПРОДУКЦИИ Изменение отгрузки продукции Изменение остатков готовой продукции на складе нач.периода (ГПн) Изменение
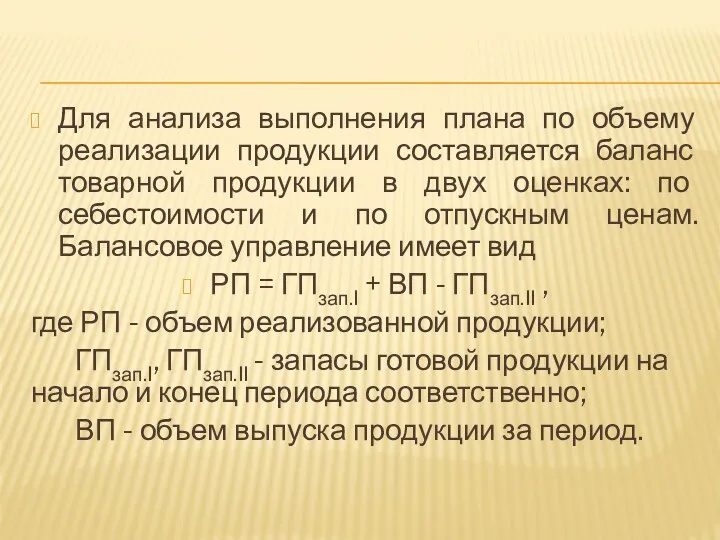
- 45. Для анализа выполнения плана по объему реализации продукции составляется баланс товарной продукции в двух оценках: по
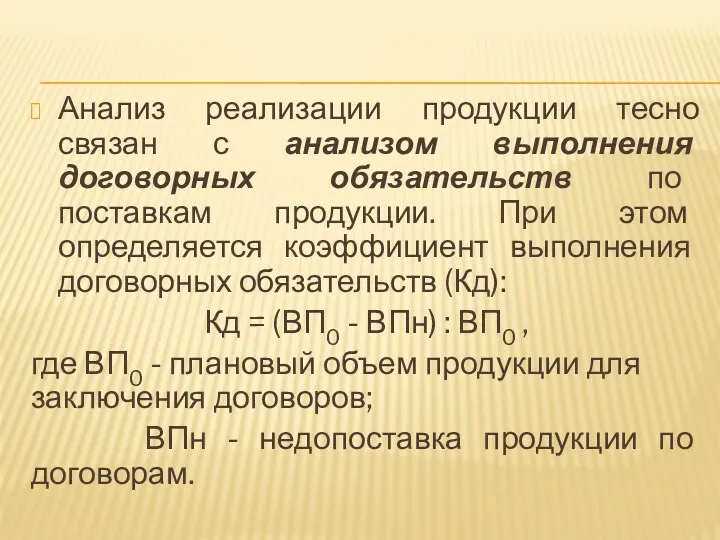
- 46. Анализ реализации продукции тесно связан с анализом выполнения договорных обязательств по поставкам продукции. При этом определяется
- 47. CHAPTER 3. ANALYSIS OF THE USE OF FIXED ASSETS
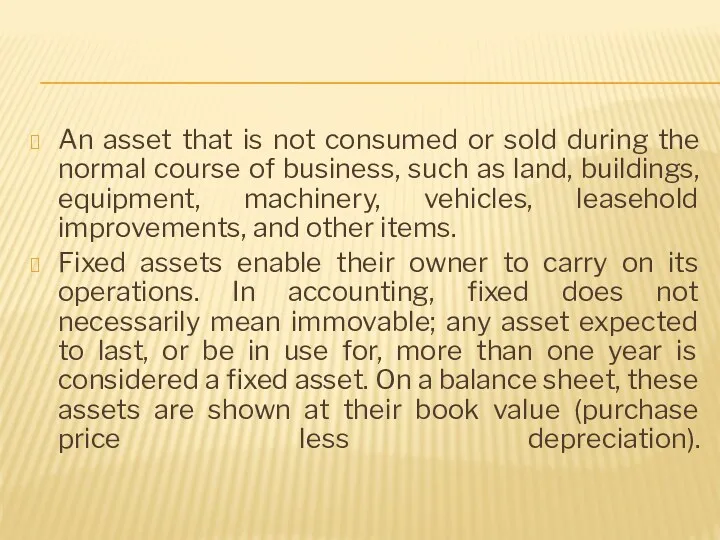
- 48. An asset that is not consumed or sold during the normal course of business, such as
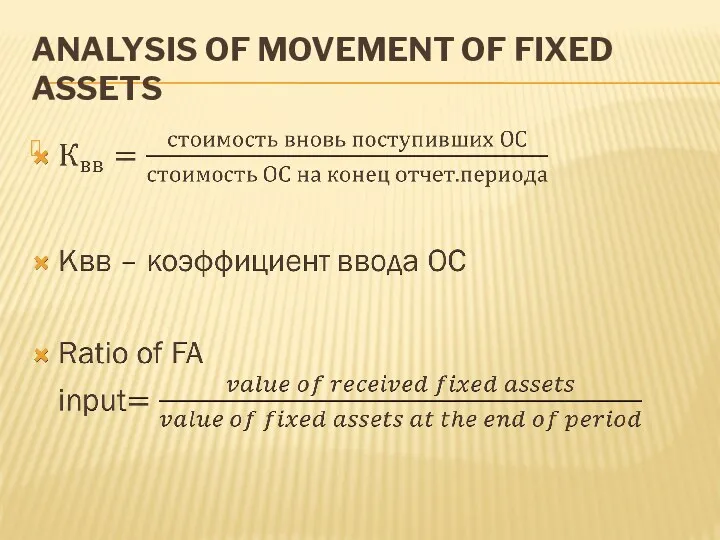
- 49. ANALYSIS OF MOVEMENT OF FIXED ASSETS
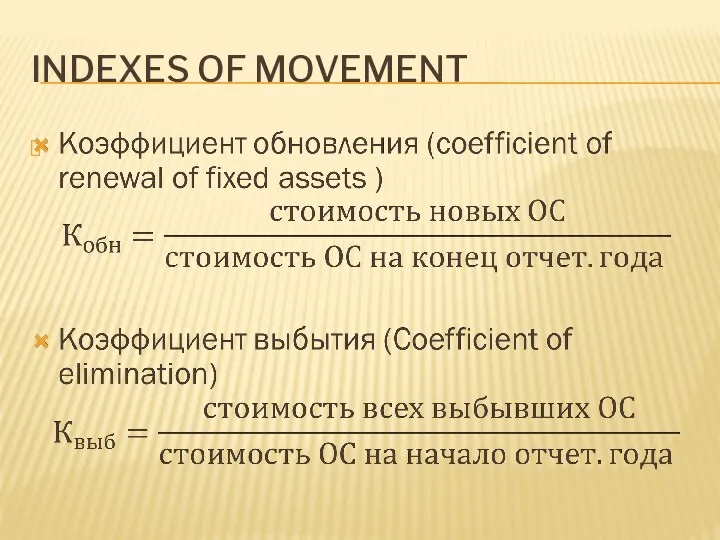
- 50. INDEXES OF MOVEMENT
- 51. INDEXES OF MOVEMENT
- 52. INDEXES OF STATUS OF FIXED ASSETS
- 53. 3.2 ANALYSIS OF THE EFFECTIVENESS OF USE FIXED ASSETS
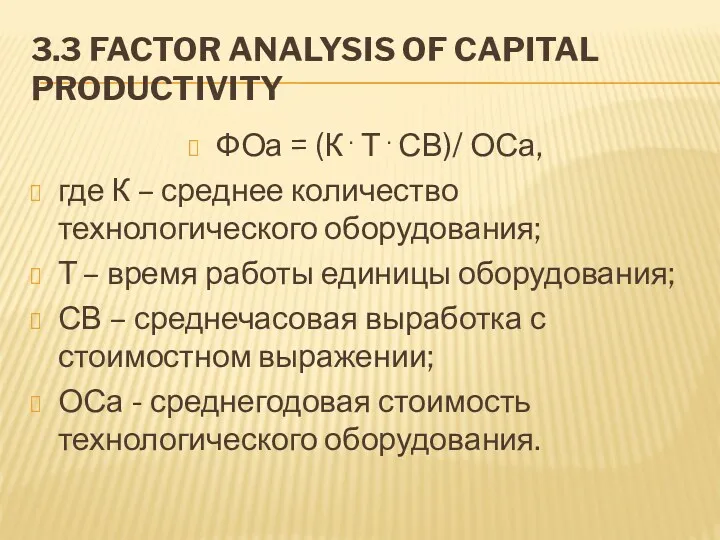
- 55. 3.3 FACTOR ANALYSIS OF CAPITAL PRODUCTIVITY ФОа = (К . Т . СВ)/ ОСа, где К
- 56. ФАКТОРНЫЙ АНАЛИЗ ФОНДООТДАЧИ
- 57. 3.4 ANALYSIS OF THE USE OF EQUIPMENT
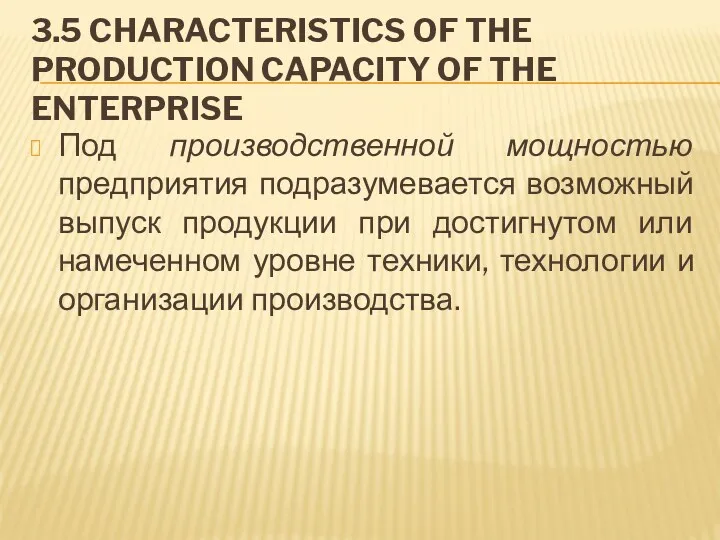
- 58. 3.5 CHARACTERISTICS OF THE PRODUCTION CAPACITY OF THE ENTERPRISE Под производственной мощностью предприятия подразумевается возможный выпуск
- 59. КОЭФФИЦИЕНТЫ ХАРАКТЕРИЗУЮЩИЕ ПРОИЗВОДСТВЕННУЮ МОЩНОСТЬ ПРЕДПРИЯТИЯ
- 60. FIXED ASSETS TURNOVER RATIO Fixed Asset Turnover = Net Sales / Net Fixed Assets Fixed asset
- 61. The fixed asset turnover ratio is a calculation that shows the ratio of net sales to
- 63. Скачать презентацию
CHAPTER 1. CONCEPT, SUBJECT AND METHOD OF ECONOMIC ANALYSIS
1.1 The concept
CHAPTER 1. CONCEPT, SUBJECT AND METHOD OF ECONOMIC ANALYSIS
1.1 The concept
1.1 THE CONCEPT OF ECONOMIC ANALYSIS
Economic analysis is a means to help
1.1 THE CONCEPT OF ECONOMIC ANALYSIS
Economic analysis is a means to help
ECONOMIC ANALYSIS
An economic analysis or evaluation is a process carried out
ECONOMIC ANALYSIS
An economic analysis or evaluation is a process carried out
THE MAIN TASKS OF ECONOMIC ANALYSIS
objective and comprehensive assessment of the
THE MAIN TASKS OF ECONOMIC ANALYSIS
objective and comprehensive assessment of the
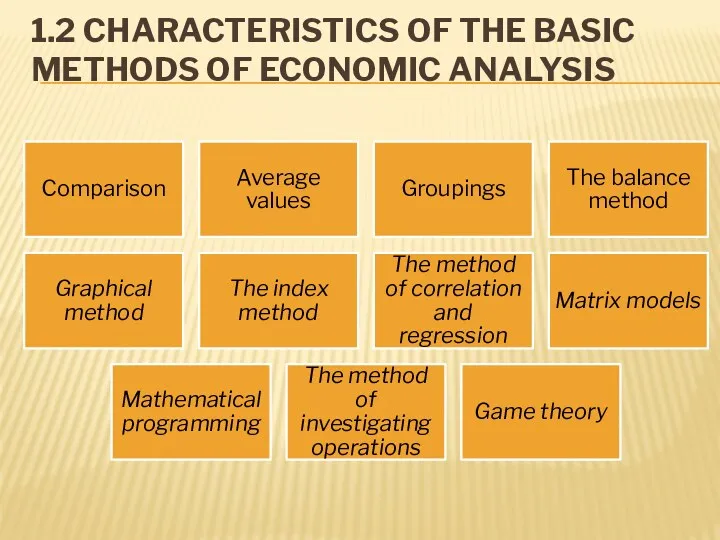
1.2 CHARACTERISTICS OF THE BASIC METHODS OF ECONOMIC ANALYSIS
1.2 CHARACTERISTICS OF THE BASIC METHODS OF ECONOMIC ANALYSIS
COMPARISON
A compulsory conditions for comparative analysis are:
• unity of volume, value,
COMPARISON
A compulsory conditions for comparative analysis are:
• unity of volume, value,
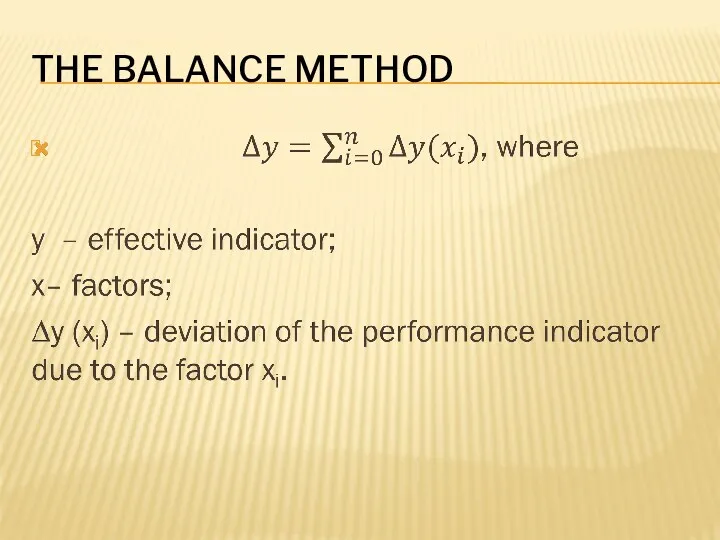
THE BALANCE METHOD
THE BALANCE METHOD
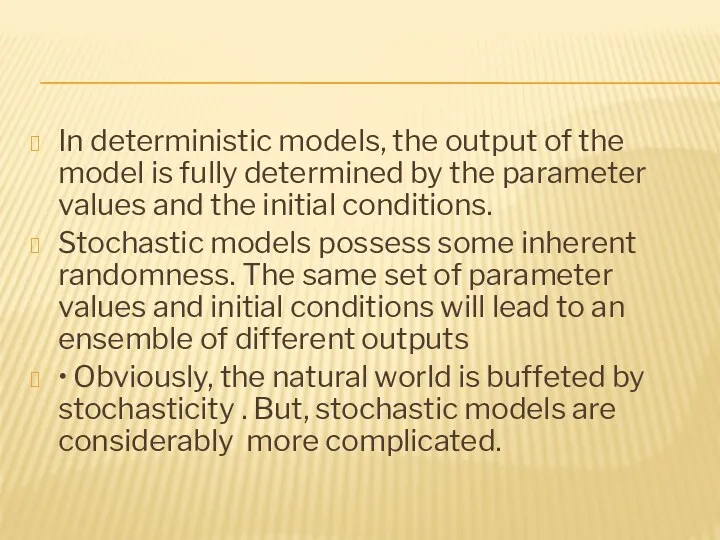
In deterministic models, the output of the model is fully determined
In deterministic models, the output of the model is fully determined
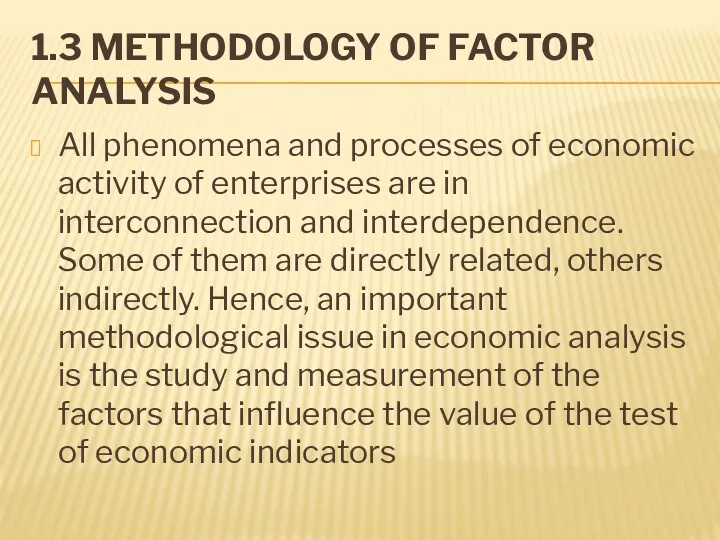
1.3 METHODOLOGY OF FACTOR ANALYSIS
All phenomena and processes of economic activity
1.3 METHODOLOGY OF FACTOR ANALYSIS
All phenomena and processes of economic activity
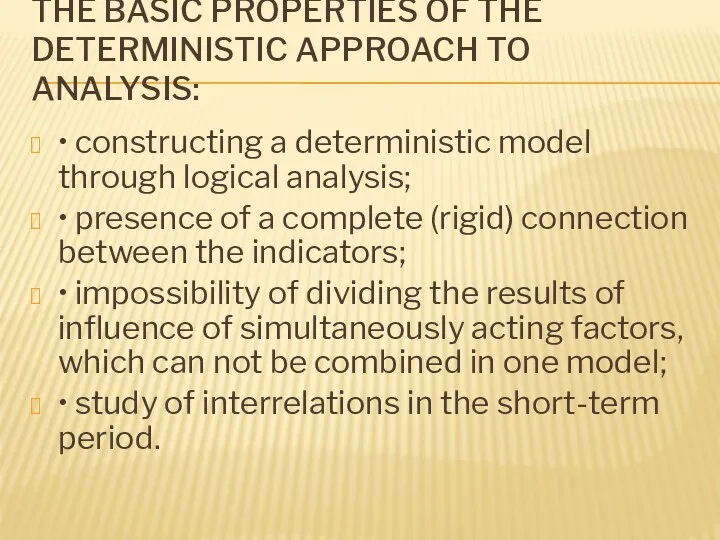
THE BASIC PROPERTIES OF THE DETERMINISTIC APPROACH TO ANALYSIS:
• constructing a
THE BASIC PROPERTIES OF THE DETERMINISTIC APPROACH TO ANALYSIS:
• constructing a
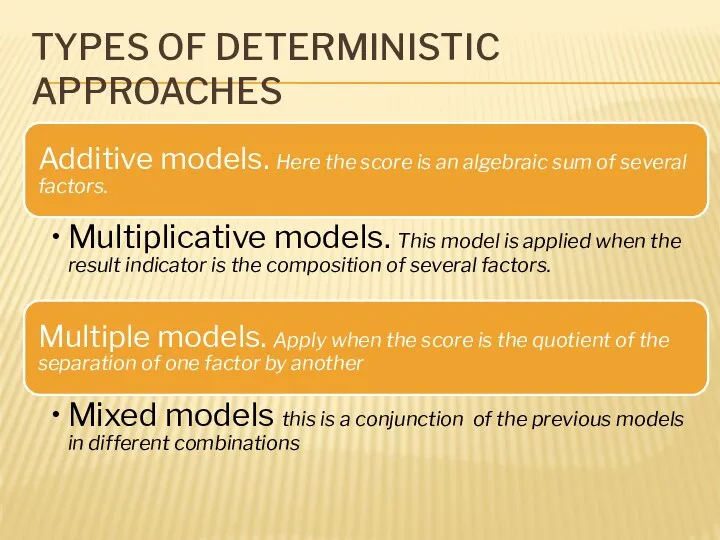
TYPES OF DETERMINISTIC APPROACHES
TYPES OF DETERMINISTIC APPROACHES
CHAPTER 2. ANALYSIS OF PRODUCTION AND IMPLEMENTATION OF PRODUCTS
2.1. Analysis of
CHAPTER 2. ANALYSIS OF PRODUCTION AND IMPLEMENTATION OF PRODUCTS
2.1. Analysis of
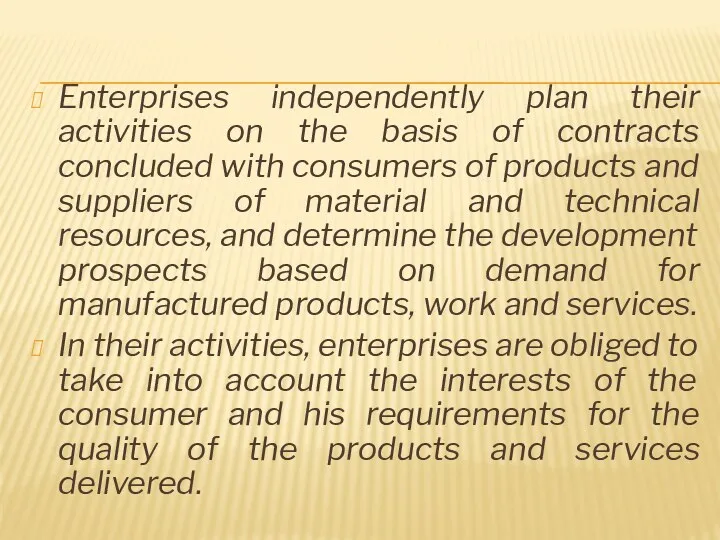
Enterprises independently plan their activities on the basis of contracts concluded
Enterprises independently plan their activities on the basis of contracts concluded
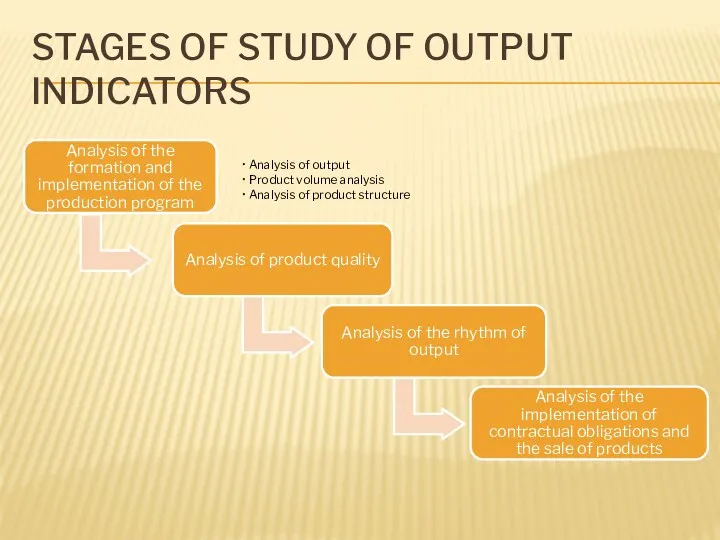
STAGES OF STUDY OF OUTPUT INDICATORS
STAGES OF STUDY OF OUTPUT INDICATORS
THE MAIN INDICATORS OF THE VOLUME OF PRODUCTION
Gross output - the
THE MAIN INDICATORS OF THE VOLUME OF PRODUCTION
Gross output - the
2.1. ANALYSIS OF THE FORMATION AND IMPLEMENTATION OF THE PRODUCTION PROGRAM
The
2.1. ANALYSIS OF THE FORMATION AND IMPLEMENTATION OF THE PRODUCTION PROGRAM
The
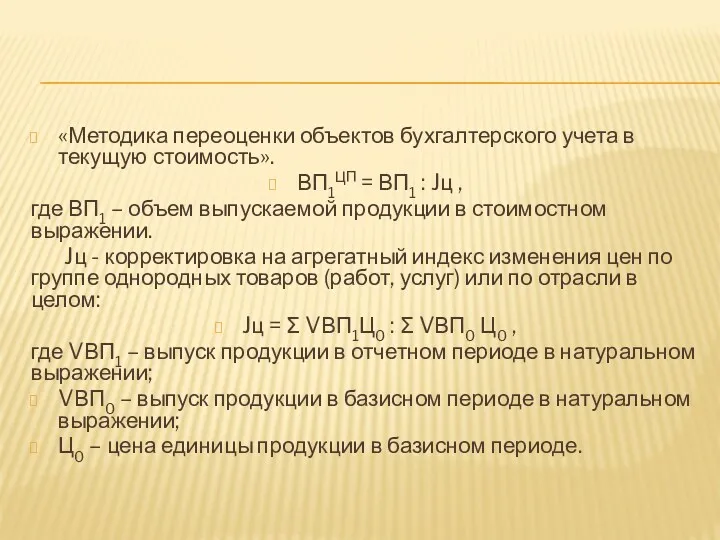
«Методика переоценки объектов бухгалтерского учета в текущую стоимость».
ВП1ЦП = ВП1
«Методика переоценки объектов бухгалтерского учета в текущую стоимость».
ВП1ЦП = ВП1
2.1.1. PRODUCT VOLUME ANALYSIS
The analysis of the volume of production begins
2.1.1. PRODUCT VOLUME ANALYSIS
The analysis of the volume of production begins
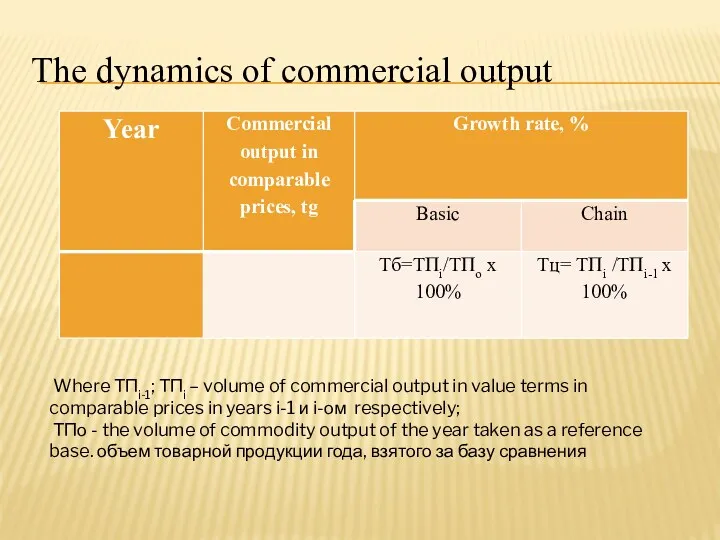
The dynamics of commercial output
Where ТПi-1; ТПi – volume of
The dynamics of commercial output
Where ТПi-1; ТПi – volume of
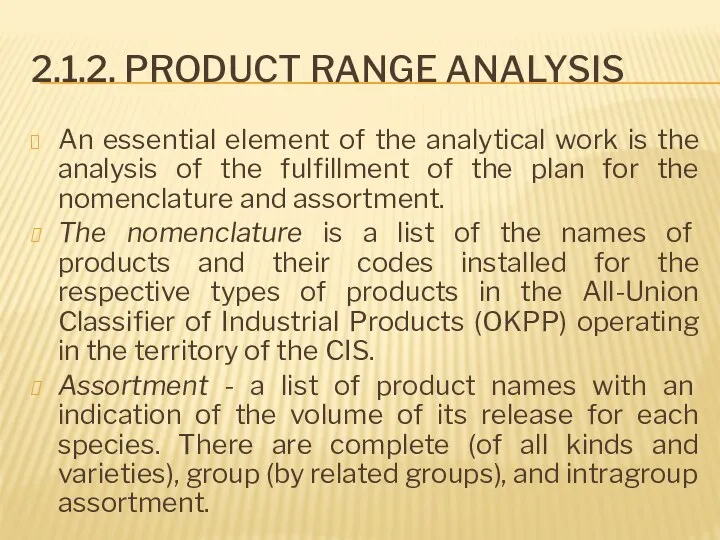
2.1.2. PRODUCT RANGE ANALYSIS
An essential element of the analytical work is
2.1.2. PRODUCT RANGE ANALYSIS
An essential element of the analytical work is
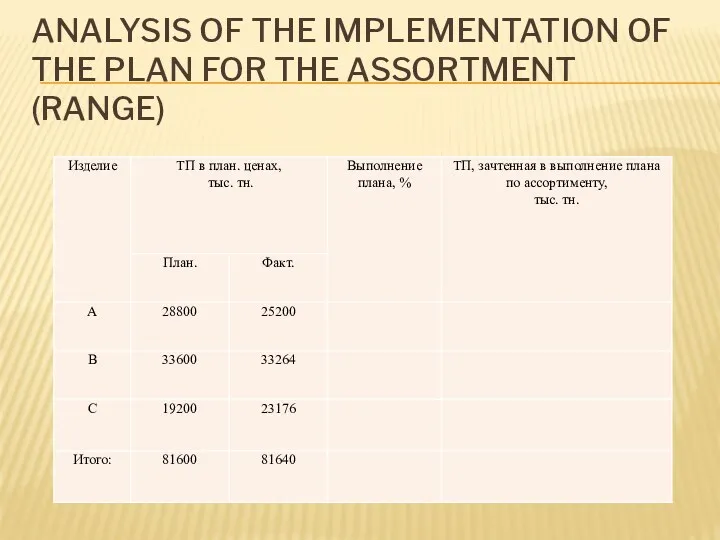
ANALYSIS OF THE IMPLEMENTATION OF THE PLAN FOR THE ASSORTMENT (RANGE)
ANALYSIS OF THE IMPLEMENTATION OF THE PLAN FOR THE ASSORTMENT (RANGE)
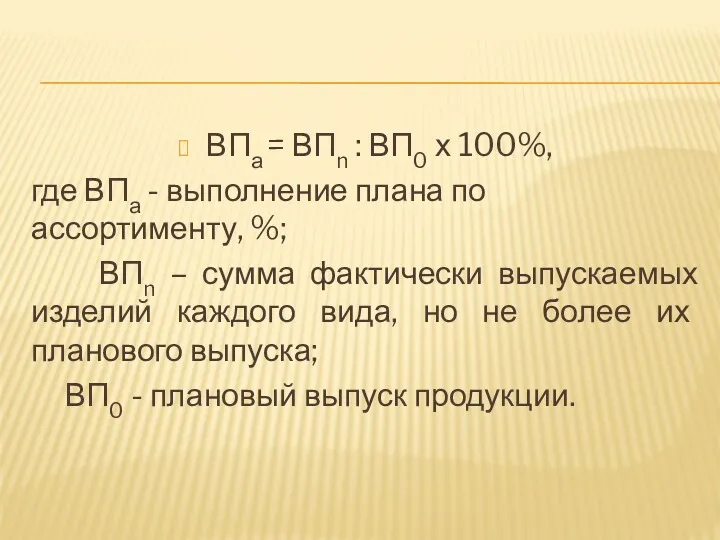
ВПа = ВПn : ВП0 х 100%,
где ВПа - выполнение плана
ВПа = ВПn : ВП0 х 100%,
где ВПа - выполнение плана
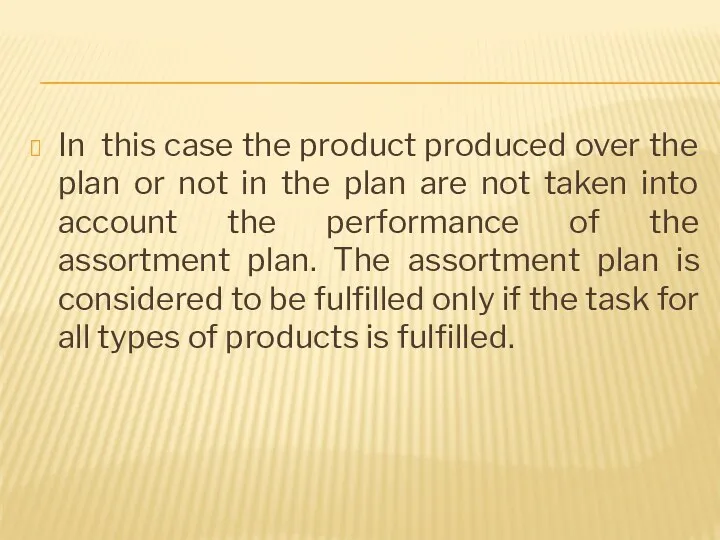
In this case the product produced over the plan or not
In this case the product produced over the plan or not
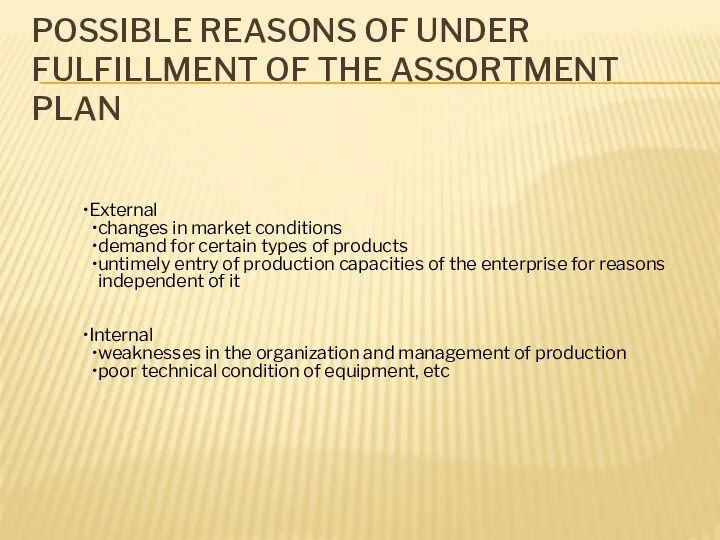
External
changes in market conditions
demand for certain types of products
untimely entry
External
changes in market conditions
demand for certain types of products
untimely entry
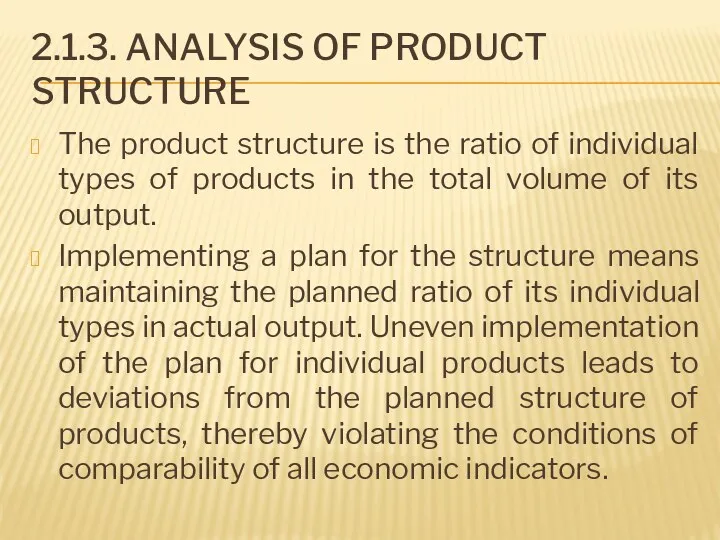
2.1.3. ANALYSIS OF PRODUCT STRUCTURE
The product structure is the ratio of
2.1.3. ANALYSIS OF PRODUCT STRUCTURE
The product structure is the ratio of
РАСЧЕТ ВЛИЯНИЯ СТРУКТУРНЫХ СДВИГОВ
Метод прямого счета по всем изделиям
Метод средних
РАСЧЕТ ВЛИЯНИЯ СТРУКТУРНЫХ СДВИГОВ
Метод прямого счета по всем изделиям
Метод средних
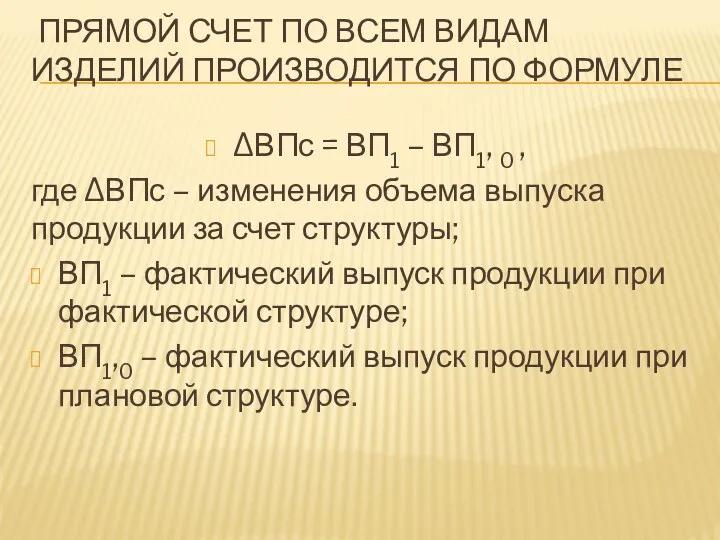
ПРЯМОЙ СЧЕТ ПО ВСЕМ ВИДАМ ИЗДЕЛИЙ ПРОИЗВОДИТСЯ ПО ФОРМУЛЕ
ΔВПс =
ПРЯМОЙ СЧЕТ ПО ВСЕМ ВИДАМ ИЗДЕЛИЙ ПРОИЗВОДИТСЯ ПО ФОРМУЛЕ
ΔВПс =
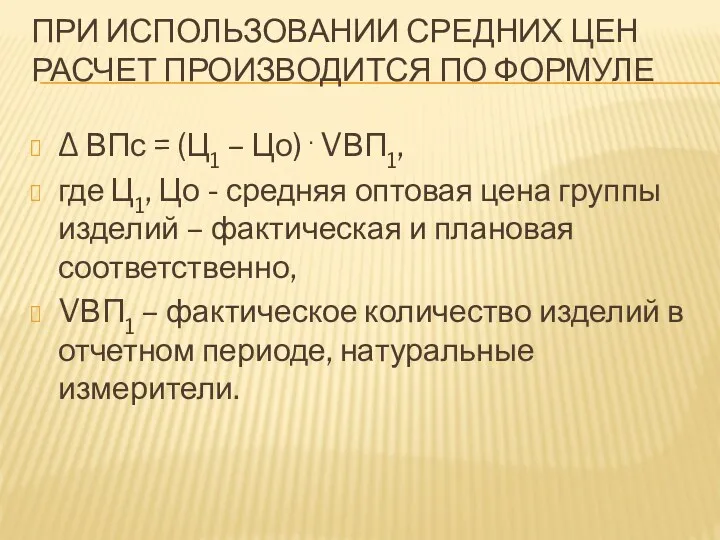
ПРИ ИСПОЛЬЗОВАНИИ СРЕДНИХ ЦЕН РАСЧЕТ ПРОИЗВОДИТСЯ ПО ФОРМУЛЕ
Δ ВПс = (Ц1
ПРИ ИСПОЛЬЗОВАНИИ СРЕДНИХ ЦЕН РАСЧЕТ ПРОИЗВОДИТСЯ ПО ФОРМУЛЕ
Δ ВПс = (Ц1
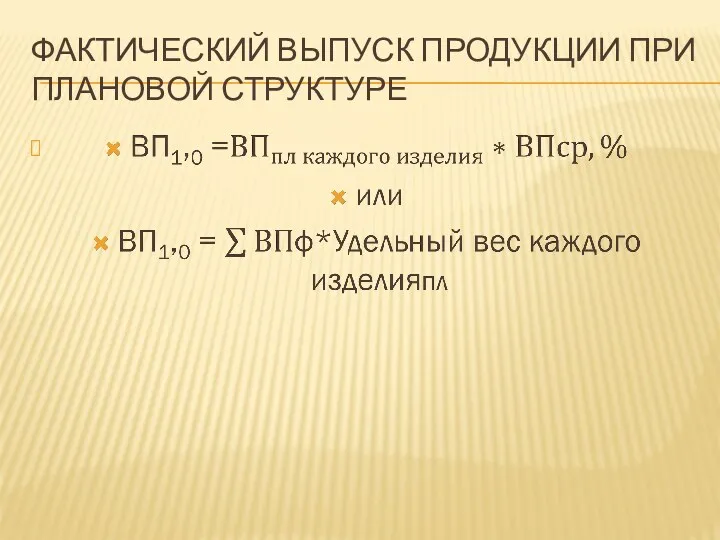
ФАКТИЧЕСКИЙ ВЫПУСК ПРОДУКЦИИ ПРИ ПЛАНОВОЙ СТРУКТУРЕ
ФАКТИЧЕСКИЙ ВЫПУСК ПРОДУКЦИИ ПРИ ПЛАНОВОЙ СТРУКТУРЕ
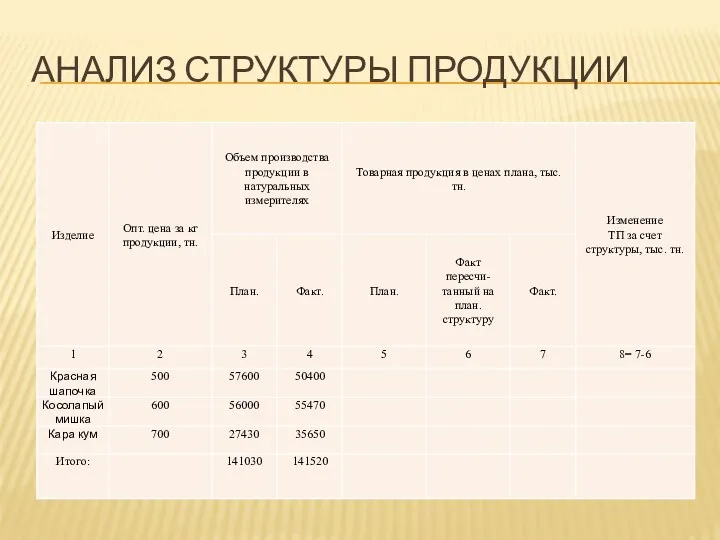
АНАЛИЗ СТРУКТУРЫ ПРОДУКЦИИ
АНАЛИЗ СТРУКТУРЫ ПРОДУКЦИИ

2.2. ANALYSIS OF PRODUCT QUALITY
Product quality is a combination of product
2.2. ANALYSIS OF PRODUCT QUALITY
Product quality is a combination of product
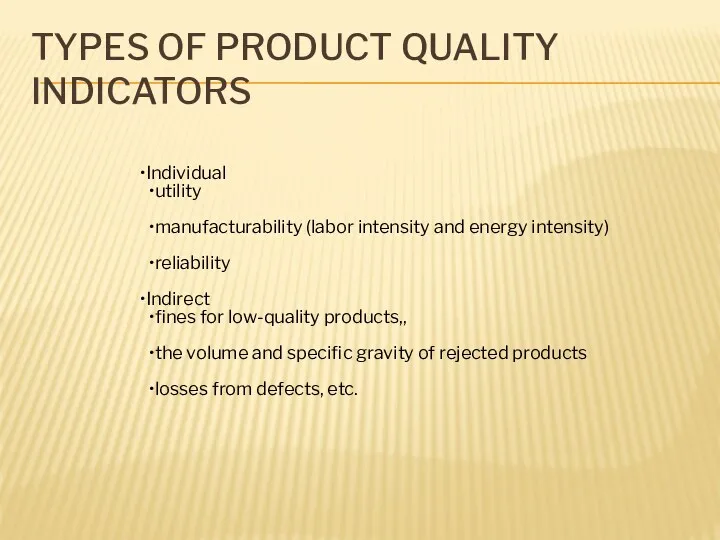
TYPES OF PRODUCT QUALITY INDICATORS
Individual
utility
manufacturability (labor intensity and energy intensity)
reliability
TYPES OF PRODUCT QUALITY INDICATORS
Individual
utility
manufacturability (labor intensity and energy intensity)
reliability
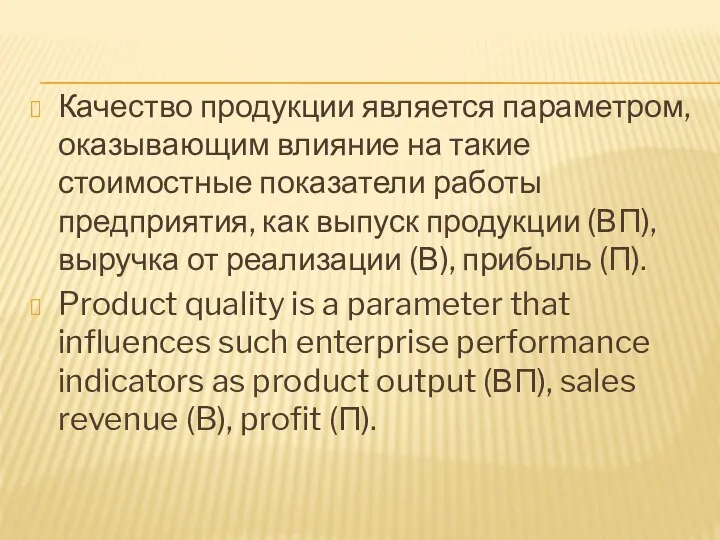
Качество продукции является параметром, оказывающим влияние на такие стоимостные показатели работы
Качество продукции является параметром, оказывающим влияние на такие стоимостные показатели работы
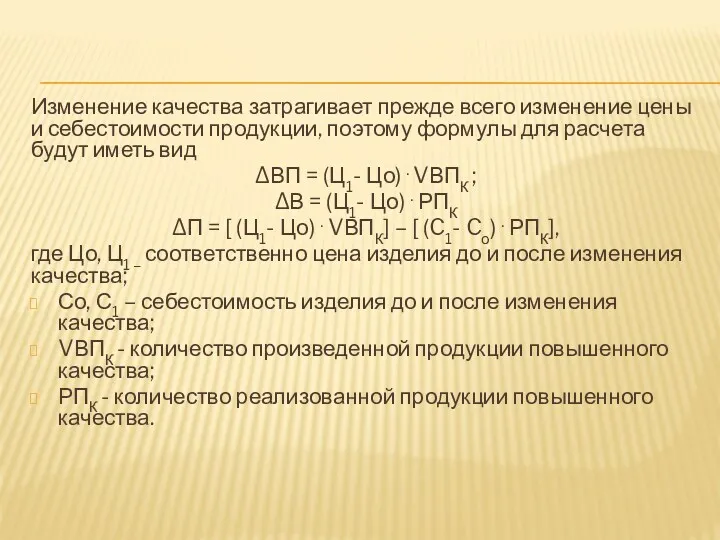
Изменение качества затрагивает прежде всего изменение цены и себестоимости продукции, поэтому
Изменение качества затрагивает прежде всего изменение цены и себестоимости продукции, поэтому
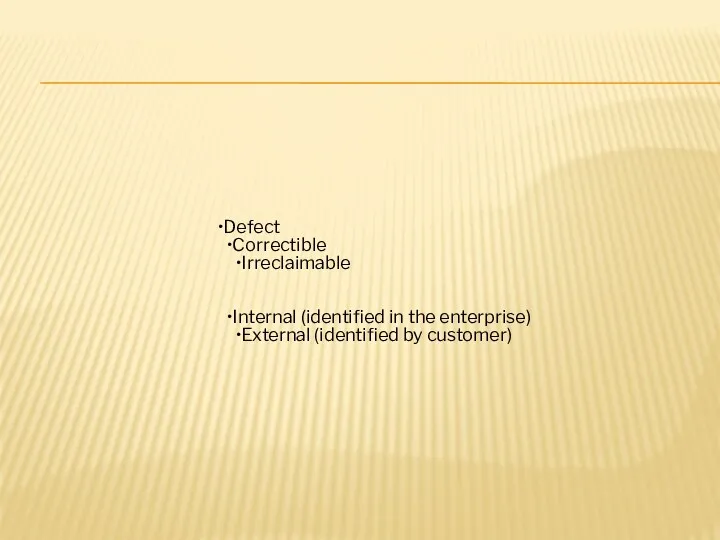
Defect
Correctible
Irreclaimable
Internal (identified in the enterprise)
External (identified by customer)
Defect
Correctible
Irreclaimable
Internal (identified in the enterprise)
External (identified by customer)
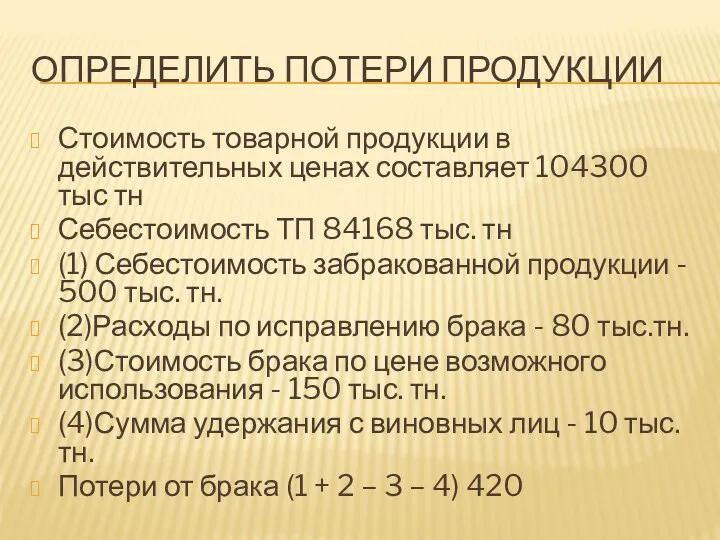
ОПРЕДЕЛИТЬ ПОТЕРИ ПРОДУКЦИИ
Стоимость товарной продукции в действительных ценах составляет 104300 тыс
ОПРЕДЕЛИТЬ ПОТЕРИ ПРОДУКЦИИ
Стоимость товарной продукции в действительных ценах составляет 104300 тыс
2.3. ANALYSIS OF THE RHYTHM OF OUTPUT
Rhythmicity - the uniform
2.3. ANALYSIS OF THE RHYTHM OF OUTPUT
Rhythmicity - the uniform
the assessment of rhythmicity
Direct
coefficient of rhythm
coefficient of variation
Indirect
additional payments
the assessment of rhythmicity
Direct
coefficient of rhythm
coefficient of variation
Indirect
additional payments
КОЭФФИЦИЕНТ РИТМИЧНОСТИ (КРИТ.)
определяется отношением фактического (но не выше планового задания) выпуска
КОЭФФИЦИЕНТ РИТМИЧНОСТИ (КРИТ.)
определяется отношением фактического (но не выше планового задания) выпуска
-КОЭФФИЦИЕНТ ВАРИАЦИИ (КВАР)
-КОЭФФИЦИЕНТ ВАРИАЦИИ (КВАР)
2.4. ANALYSIS OF THE IMPLEMENTATION OF CONTRACTUAL OBLIGATIONS AND THE SALE
2.4. ANALYSIS OF THE IMPLEMENTATION OF CONTRACTUAL OBLIGATIONS AND THE SALE
ИЗМЕНЕНИЕ ОБЪЕМА РЕАЛИЗАЦИИ ПРОДУКЦИИ
Изменение отгрузки продукции
Изменение остатков готовой продукции на складе
ИЗМЕНЕНИЕ ОБЪЕМА РЕАЛИЗАЦИИ ПРОДУКЦИИ
Изменение отгрузки продукции
Изменение остатков готовой продукции на складе
Для анализа выполнения плана по объему реализации продукции составляется баланс товарной
Для анализа выполнения плана по объему реализации продукции составляется баланс товарной
Анализ реализации продукции тесно связан с анализом выполнения договорных обязательств по
Анализ реализации продукции тесно связан с анализом выполнения договорных обязательств по
CHAPTER 3. ANALYSIS OF THE USE OF FIXED ASSETS
CHAPTER 3. ANALYSIS OF THE USE OF FIXED ASSETS
An asset that is not consumed or sold during the normal
An asset that is not consumed or sold during the normal
ANALYSIS OF MOVEMENT OF FIXED ASSETS
ANALYSIS OF MOVEMENT OF FIXED ASSETS
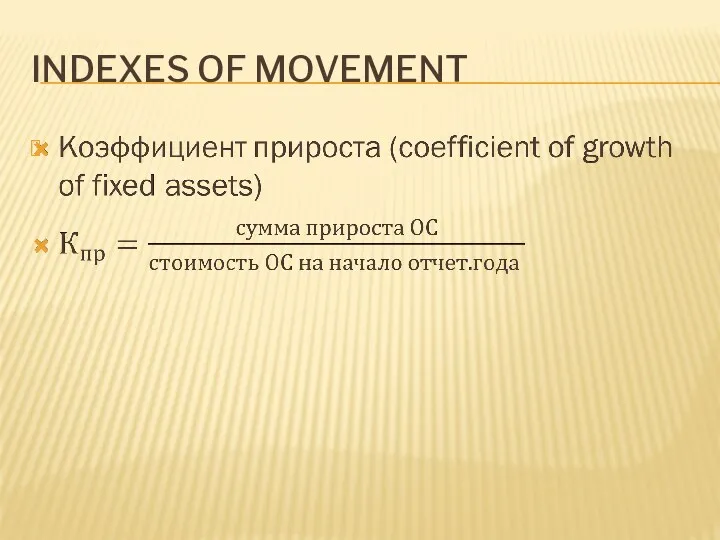
INDEXES OF MOVEMENT
INDEXES OF MOVEMENT
INDEXES OF MOVEMENT
INDEXES OF MOVEMENT
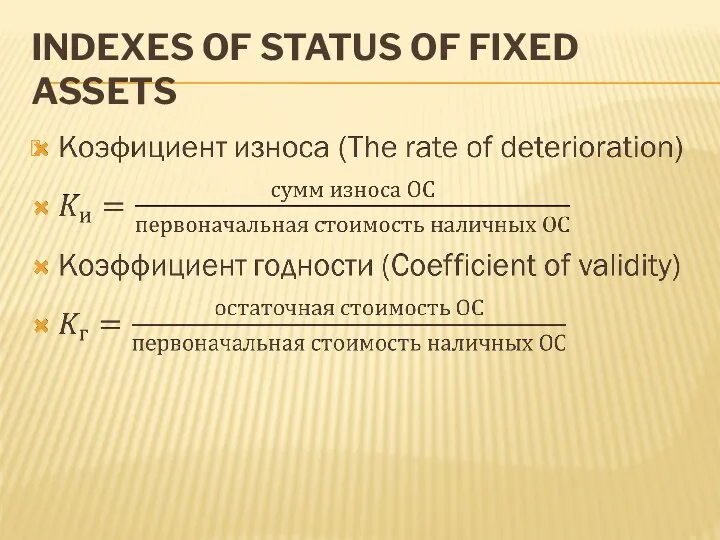
INDEXES OF STATUS OF FIXED ASSETS
INDEXES OF STATUS OF FIXED ASSETS
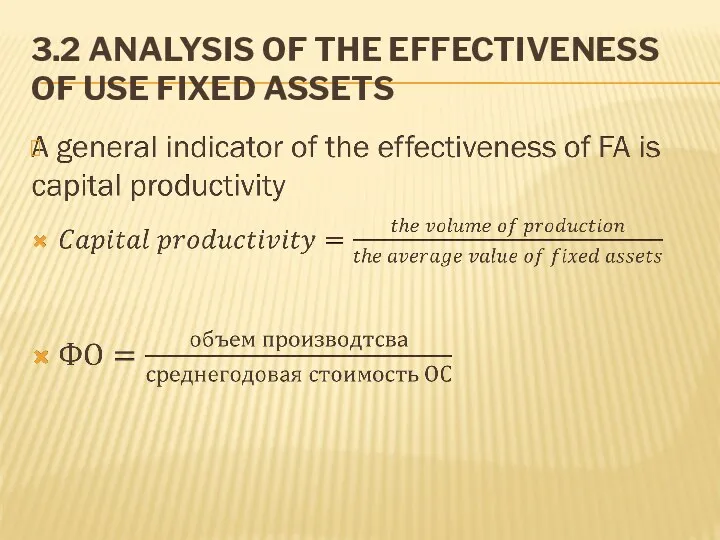
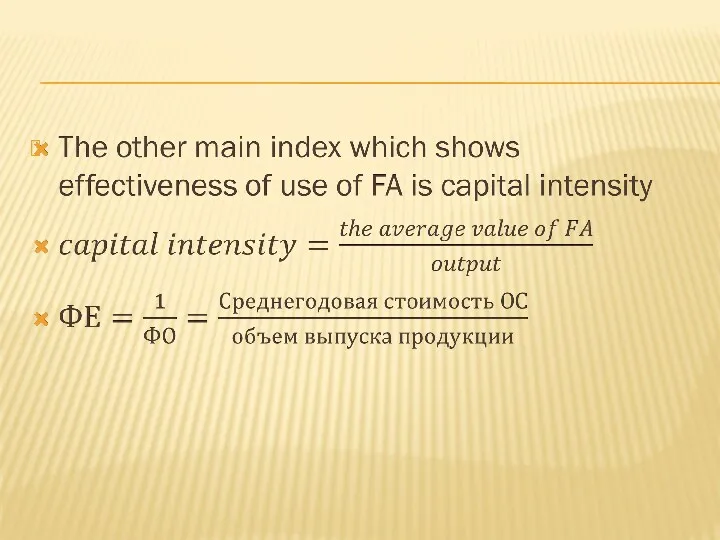
3.2 ANALYSIS OF THE EFFECTIVENESS OF USE FIXED ASSETS
3.2 ANALYSIS OF THE EFFECTIVENESS OF USE FIXED ASSETS
3.3 FACTOR ANALYSIS OF CAPITAL PRODUCTIVITY
ФОа = (К . Т .
3.3 FACTOR ANALYSIS OF CAPITAL PRODUCTIVITY
ФОа = (К . Т .
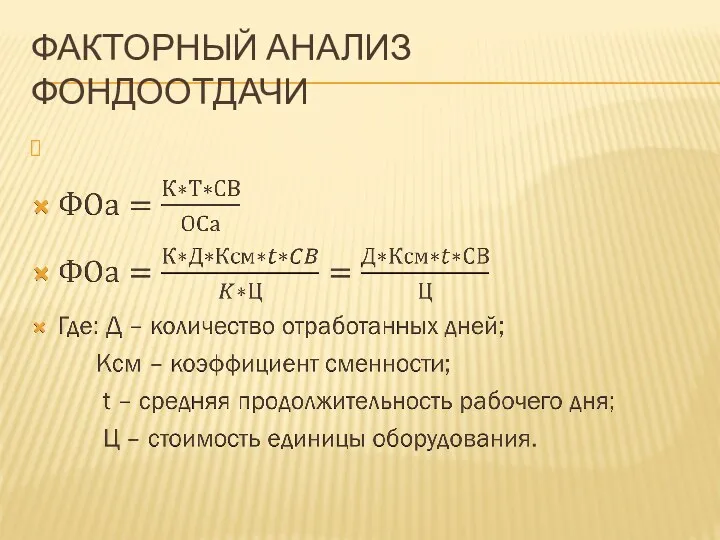
ФАКТОРНЫЙ АНАЛИЗ ФОНДООТДАЧИ
ФАКТОРНЫЙ АНАЛИЗ ФОНДООТДАЧИ
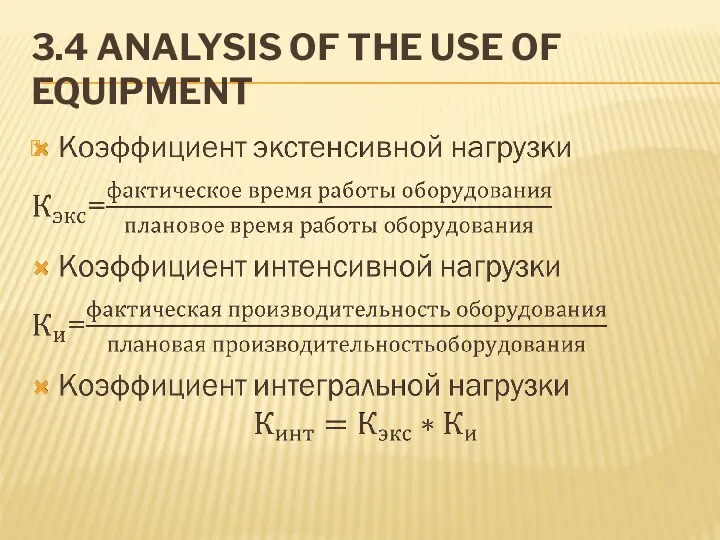
3.4 ANALYSIS OF THE USE OF EQUIPMENT
3.4 ANALYSIS OF THE USE OF EQUIPMENT
3.5 CHARACTERISTICS OF THE PRODUCTION CAPACITY OF THE ENTERPRISE
Под производственной мощностью
3.5 CHARACTERISTICS OF THE PRODUCTION CAPACITY OF THE ENTERPRISE
Под производственной мощностью
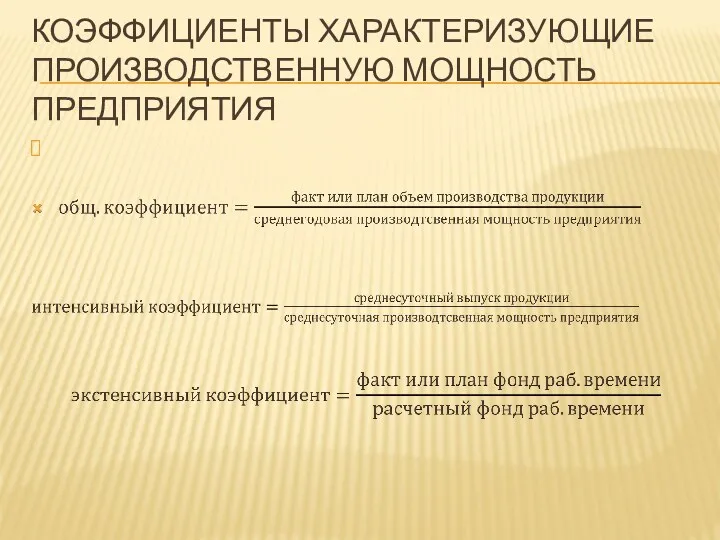
КОЭФФИЦИЕНТЫ ХАРАКТЕРИЗУЮЩИЕ ПРОИЗВОДСТВЕННУЮ МОЩНОСТЬ ПРЕДПРИЯТИЯ
КОЭФФИЦИЕНТЫ ХАРАКТЕРИЗУЮЩИЕ ПРОИЗВОДСТВЕННУЮ МОЩНОСТЬ ПРЕДПРИЯТИЯ
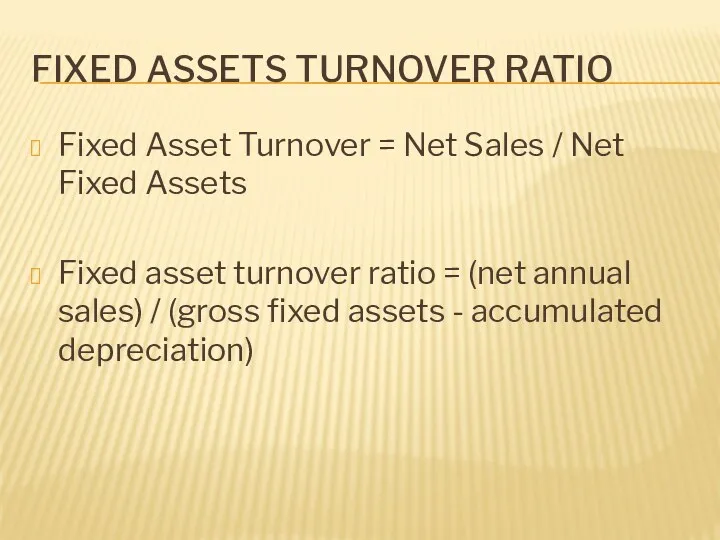
FIXED ASSETS TURNOVER RATIO
Fixed Asset Turnover = Net Sales / Net
FIXED ASSETS TURNOVER RATIO
Fixed Asset Turnover = Net Sales / Net
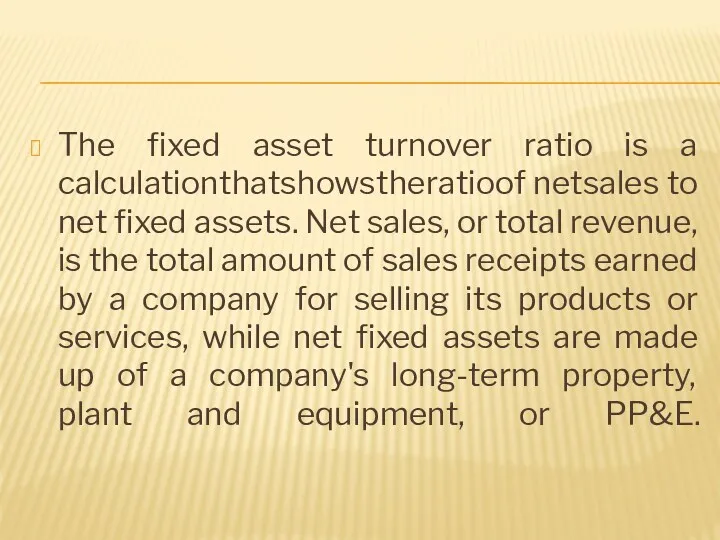
The fixed asset turnover ratio is a calculation that shows the
The fixed asset turnover ratio is a calculation that shows the
 Торгово-экономические отношения России и Чехии
 Тема 14. Несостоятельность рынка и вмешательство государства
 Типы экономических систем
 Сущность (классификация) и организация прогнозирования
 Предмет экономической теории
 Экономические учения Адама Смита
 Экономический кризис и конфликт. Лекция 5
 Рыночная экономика
 Меркантилизм
 Экономика, часть 2. Вопросы кодификатора
 Электронные финансовые и фондовые рынки
 Нетарифное регулирование. Запреты и ограничения внешнеторговой деятельности
 Роль экономики в жизни общества
 Підприємницька ідея: механізм генерування та впровадження
 География основных типов экономики на территории России
 Панельные данные. Проблема эндогенности
 Типологія держав. Міжнародні організації
 Денежная система Диск
 Экономические результаты хозяйственной деятельности предприятий
 Факторы производства
 Обмен, торговля, реклама
 Сущность и цели государственного регулирования экономики
 Дракер Хенди и Туроу о капитализме. Сравнение подходов
 Трансакционные издержки
 Особенности прогнозирования Национальной экономики в условиях рынка Понятие социально-экономическое прогнозирование
 Человек и экономика. Экономика и ее основные участники. (7 класс)
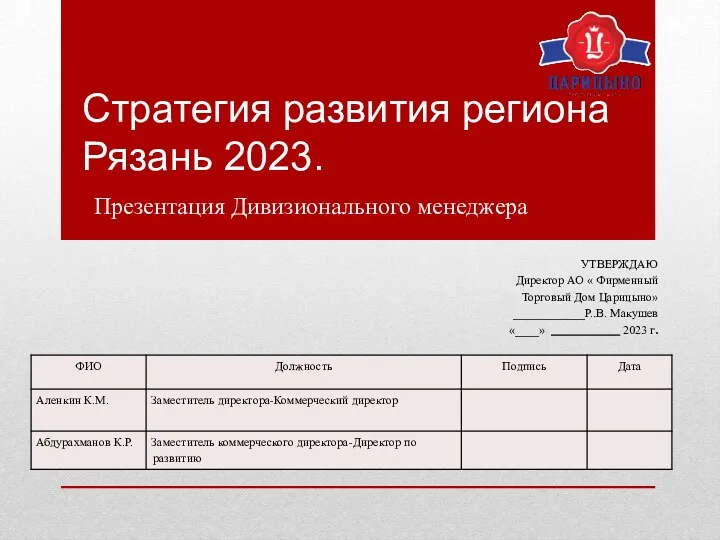 Стратегия развития региона Рязань 2023
 Экономический анализ ответственности за неумышленное причинение ущерба: расширения базового подхода