- Demand and supply. The purchasing power of money

Содержание
- 2. The Purchasing Power of Money The price level P is measured in units of dollars per
- 3. Inflation The absolute price level at any given time is not as interesting as changes in
- 4. Indices of Inflation Consumer Price Index (CPI) “producer price index” (PPI) “GDP deflator” They generally correlate
- 5. Consumer Price Index - is a collection of goods and services developed to replicate the spending
- 6. Producer price index (PPI) purports to represent the costs faced by typical producers
- 7. “GDP deflator” attempts to measure the prices of all the goods and services produced in the
- 8. Annual rates of change of three price indices
- 9. The Law of Demand for Money The law of demand says that as the price of
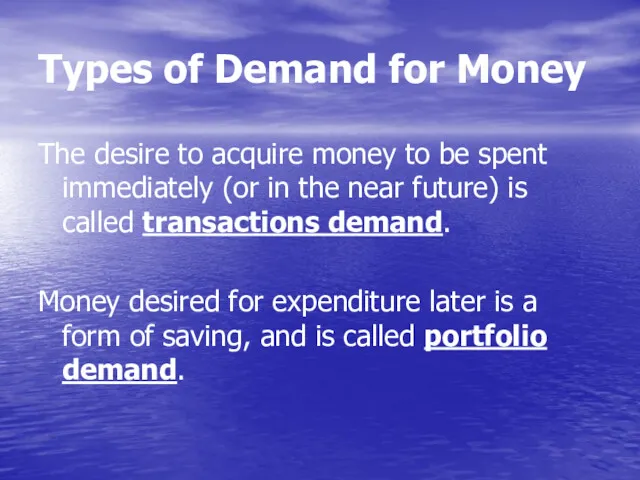
- 10. Types of Demand for Money The desire to acquire money to be spent immediately (or in
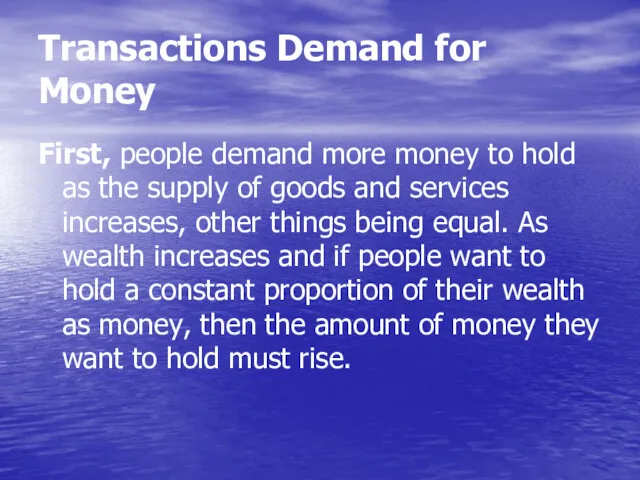
- 11. Transactions Demand for Money First, people demand more money to hold as the supply of goods
- 12. Second influence is the cost of acquiring cash. If acquiring cash requires standing in line at
- 13. Third influence – the clearing system Concerning electronic money… Clearing system efficiencies reduce the demand to
- 14. The degree of vertical integration among business firms A forth and somewhat minor influence on the
- 15. Portfolio Demand for Money Money is the most liquid form of savings – you can spend
- 16. Opportunity cost of money The demand for a good or service depends in part on its
- 17. One more classification of reasons for money demand There are three fundamental reasons as to why
- 18. Demand for money is the amount of money that people desire to hold
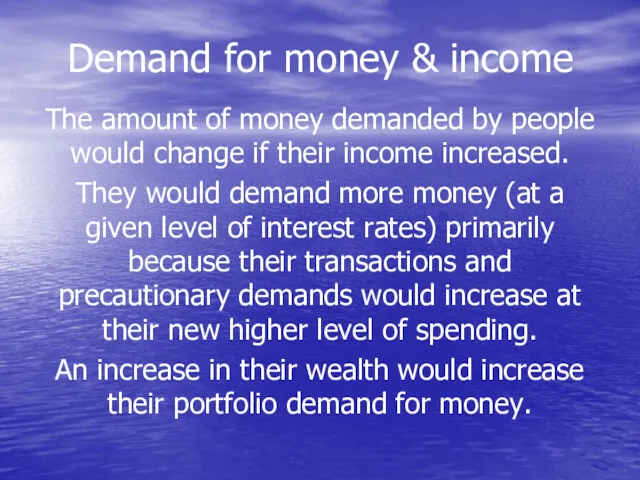
- 19. Demand for money & income The amount of money demanded by people would change if their
- 20. A households' demand for money primarily depends on: the interest rate, their income, and wealth, other
- 21. The demand for money can be represented by the following equation: Md = k × P×
- 22. If income is zero then the demand for money is zero? This is unrealistic because money
- 23. The demand for any good or service is usually pictured in economics as a function of
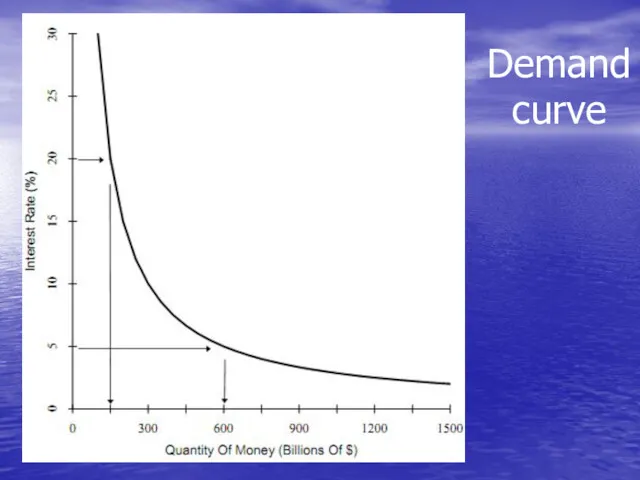
- 24. Demand curve
- 25. The quantity of money demanded is higher when the interest rate is lower. This inverse relationship
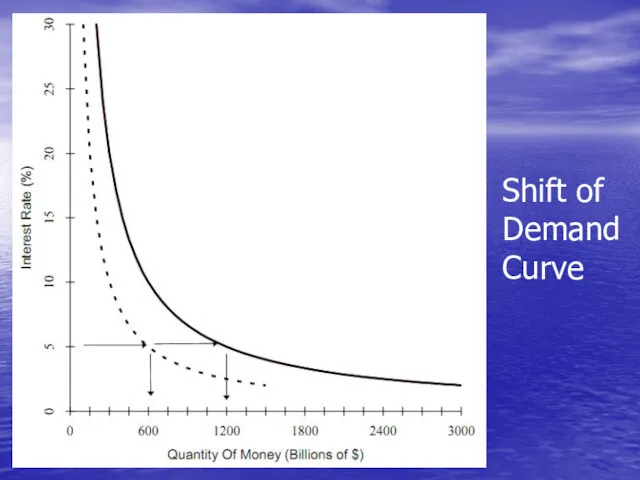
- 26. Shift of Demand Curve
- 27. Rising wealth will contribute to higher demand for money holdings through the portfolio motive. Wealth would
- 28. Demand for Money & Velocity Since every dollar spent is someone’s dollar of income, an overall
- 29. Demand for Money & Real Output Another factor that influences the demand for money is real
- 30. Demand for Money & PPM Decline in the purchasing power of money (i.e., a rise in
- 31. Equation of exchange MV=PY the number of dollars (M) the average number of transactions (V )
- 32. Units of Account M is in dollars, V is in transactions per year, so MV is
- 33. Let's put together a simple economy of four people where each person has the following: Person
- 34. Suppose the following transactions take place: Person 1 wants a calculator, so she trades her $100
- 35. In this economy, the $100 in currency was used three times and generated $300 worth of
- 36. M ¤ V = Nominal GDP Nominal GDP = Price Level *Real GDP Nominal GDP =
- 37. According to Irving Fisher MV=P1Q1 + MV=P2Q2 + MV=P3Q3 + etc. Thus, MV=∑PQ
- 38. The Quantity Theory of Money The quantity theory of money states that money growth translates directly
- 39. The equation explains why money growth exceed inflation in low-inflation economies The money growth can be
- 40. Individuals require money to complete transactions which means that: the number of dollars needed equals the
- 41. The Supply of Money is the quantity of money (currency and bank deposits) set by the
- 42. Supply of Money depends on: The reserve requirement Total amount of refinancing made by central bank
- 43. The reserve requirements (or cash reserve ratio) is a central bank regulation that sets the minimum
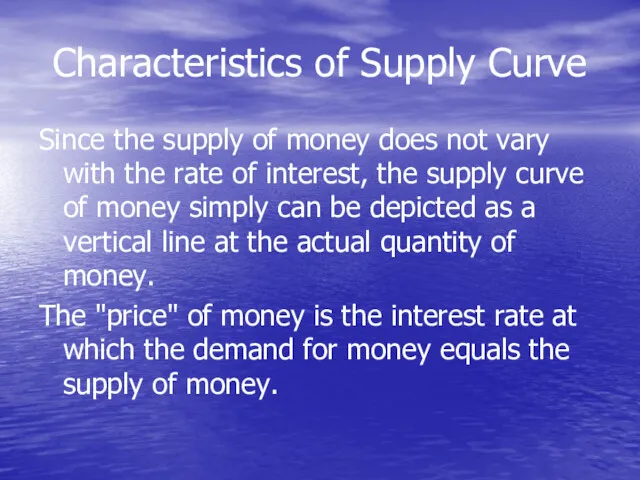
- 44. Characteristics of Supply Curve Since the supply of money does not vary with the rate of
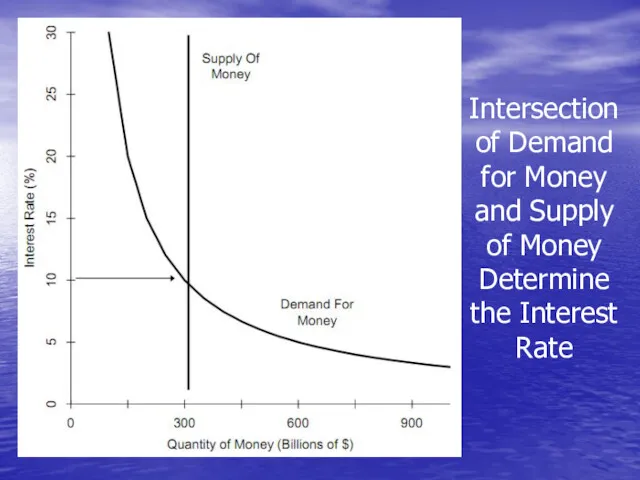
- 45. Intersection of Demand for Money and Supply of Money Determine the Interest Rate
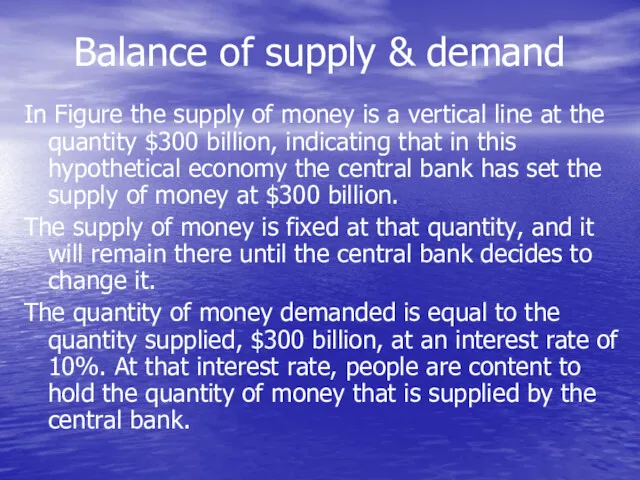
- 46. Balance of supply & demand In Figure the supply of money is a vertical line at
- 47. If there is no balance of S&D… If the interest rate is 9% instead of 10%.
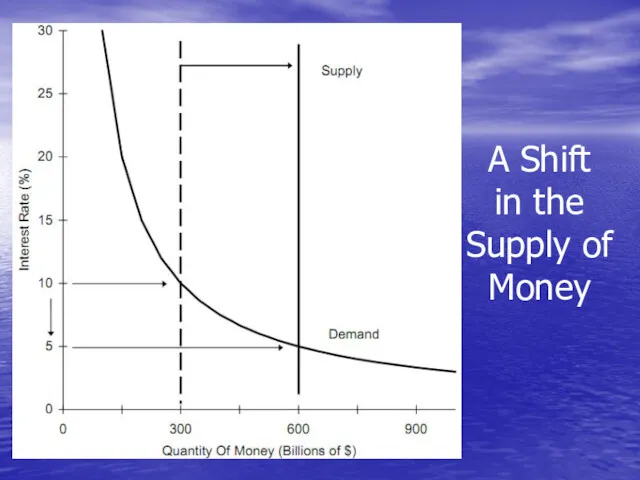
- 48. A Shift in the Supply of Money Imagine that the central bank boosts the money supply
- 49. A Shift in the Supply of Money
- 50. Central Bank Increases Supply of Money When the central bank buys bonds in an open market
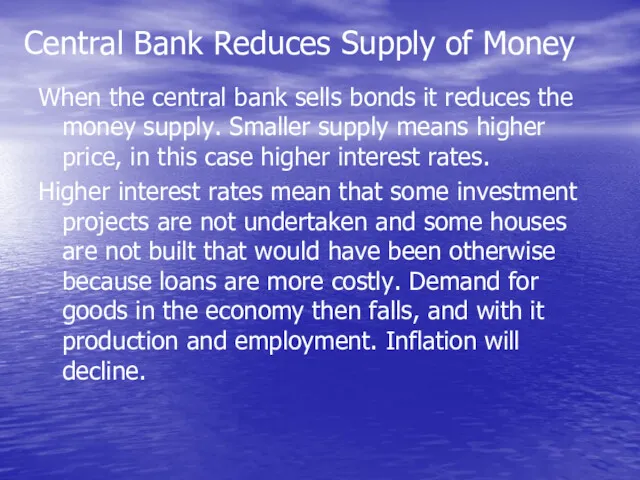
- 51. Central Bank Reduces Supply of Money When the central bank sells bonds it reduces the money
- 53. Скачать презентацию
The Purchasing Power of Money
The price level P is measured in
The Purchasing Power of Money
The price level P is measured in
Inflation
The absolute price level at any given time is not as
Inflation
The absolute price level at any given time is not as
Indices of Inflation
Consumer Price Index (CPI)
“producer price index” (PPI)
“GDP deflator”
They generally
Indices of Inflation
Consumer Price Index (CPI)
“producer price index” (PPI)
“GDP deflator”
They generally
Consumer Price Index
- is a collection of goods and services developed
Consumer Price Index
- is a collection of goods and services developed
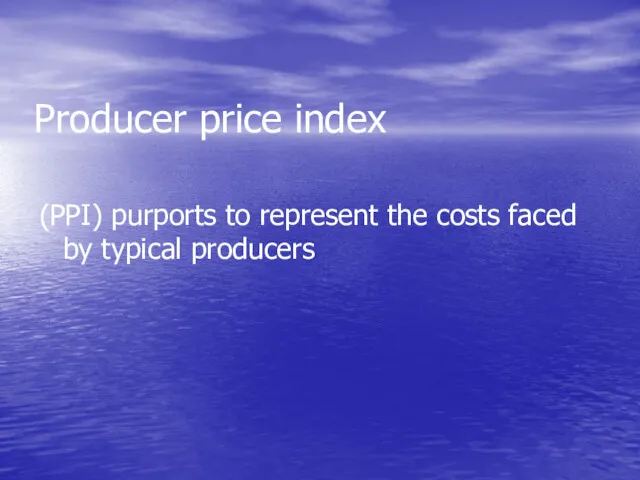
Producer price index
(PPI) purports to represent the costs faced by typical
Producer price index
(PPI) purports to represent the costs faced by typical
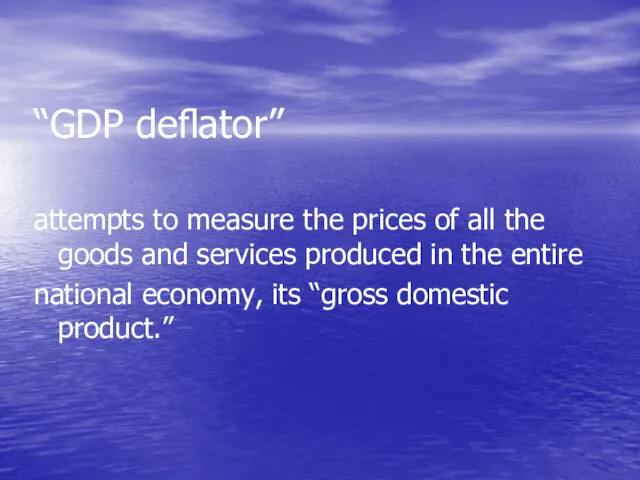
“GDP deflator”
attempts to measure the prices of all the goods and
“GDP deflator”
attempts to measure the prices of all the goods and
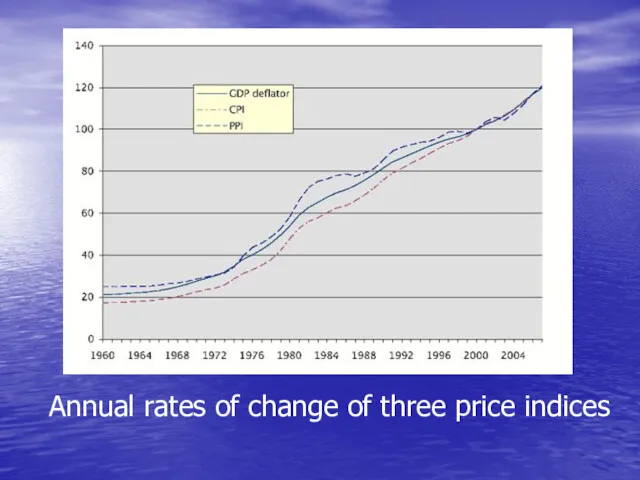
Annual rates of change of three price indices
Annual rates of change of three price indices
The Law of Demand for Money
The law of demand says that
The Law of Demand for Money
The law of demand says that
Types of Demand for Money
The desire to acquire money to be
Types of Demand for Money
The desire to acquire money to be
Transactions Demand for Money
First, people demand more money to hold as
Transactions Demand for Money
First, people demand more money to hold as
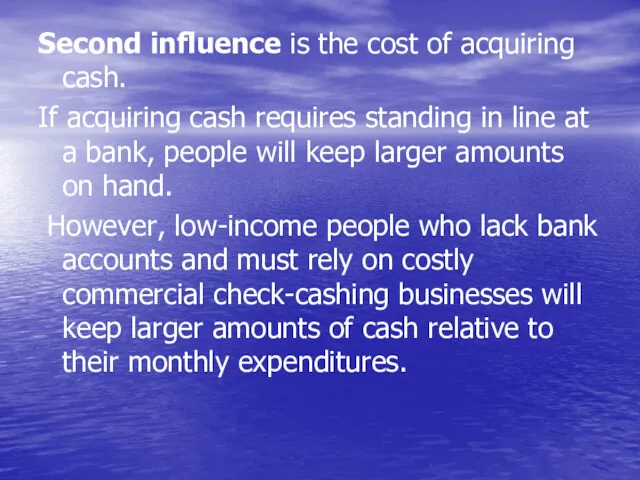
Second influence is the cost of acquiring cash.
If acquiring cash
Second influence is the cost of acquiring cash.
If acquiring cash
Third influence – the clearing system
Concerning electronic money…
Clearing system efficiencies reduce
Third influence – the clearing system
Concerning electronic money…
Clearing system efficiencies reduce
The degree of vertical integration among business firms
A forth and somewhat
The degree of vertical integration among business firms
A forth and somewhat
Portfolio Demand for Money
Money is the most liquid form of savings
Portfolio Demand for Money
Money is the most liquid form of savings
Opportunity cost of money
The demand for a good or service depends
Opportunity cost of money
The demand for a good or service depends
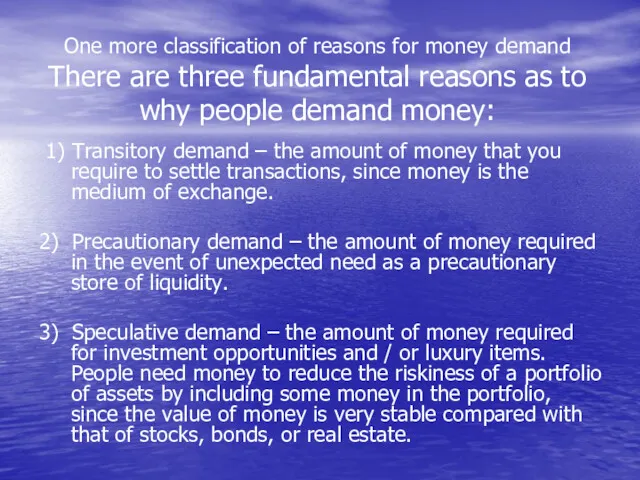
One more classification of reasons for money demand
There are three
One more classification of reasons for money demand There are three

Demand for money
is the amount of money
that people desire to
Demand for money
is the amount of money
that people desire to
Demand for money & income
The amount of money demanded by people
Demand for money & income
The amount of money demanded by people
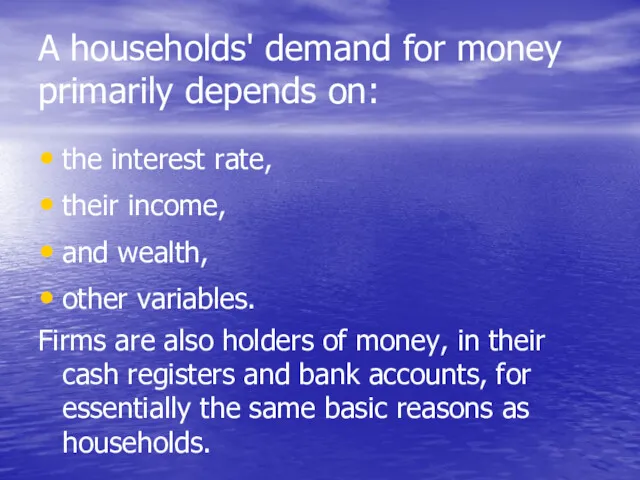
A households' demand for money primarily depends on:
the interest rate,
their
A households' demand for money primarily depends on:
the interest rate,
their
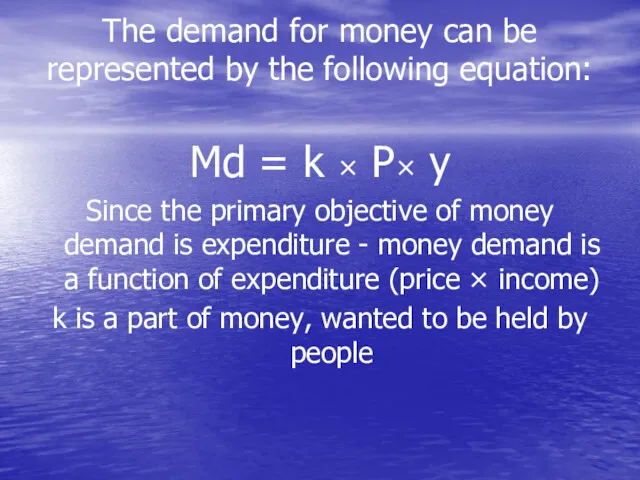
The demand for money can be represented by the following equation:
The demand for money can be represented by the following equation:
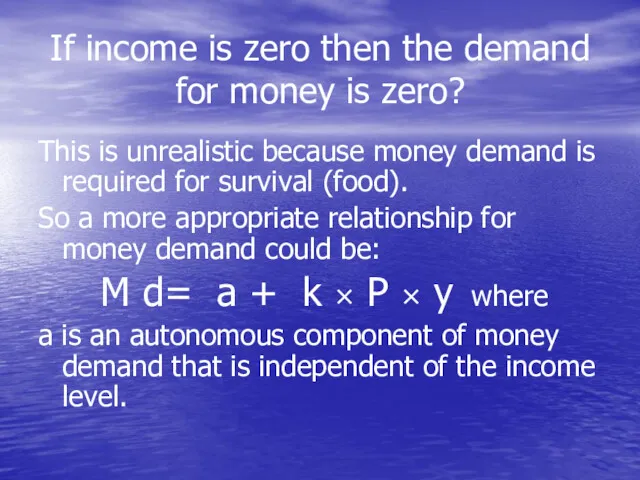
If income is zero then the demand for money is zero?
This
If income is zero then the demand for money is zero?
This
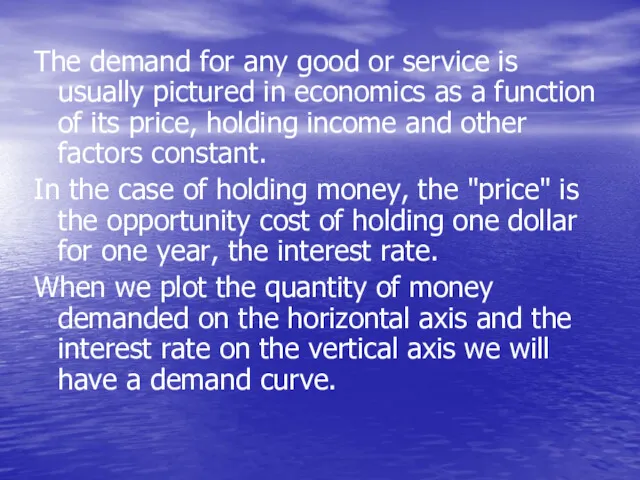
The demand for any good or service is usually pictured in
The demand for any good or service is usually pictured in
Demand
curve
Demand
curve
The quantity of money demanded is higher when the interest rate
The quantity of money demanded is higher when the interest rate
Shift of
Demand Curve
Shift of
Demand Curve
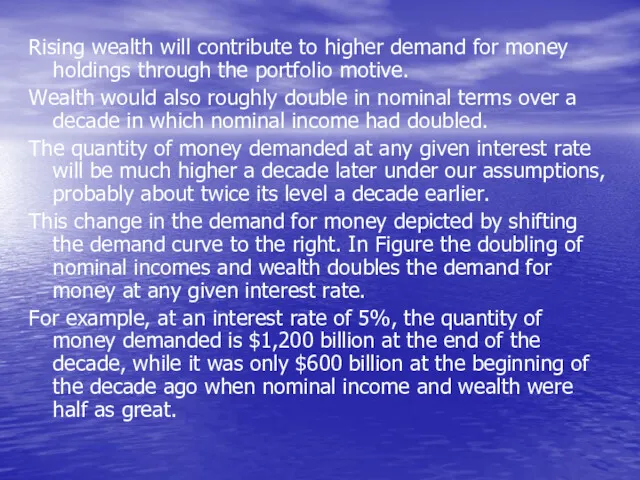
Rising wealth will contribute to higher demand for money holdings through
Rising wealth will contribute to higher demand for money holdings through
Demand for Money & Velocity
Since every dollar spent is someone’s dollar
Demand for Money & Velocity
Since every dollar spent is someone’s dollar
Demand for Money & Real Output
Another factor that influences the demand
Demand for Money & Real Output
Another factor that influences the demand
Demand for Money & PPM
Decline in the purchasing power of money
Demand for Money & PPM
Decline in the purchasing power of money
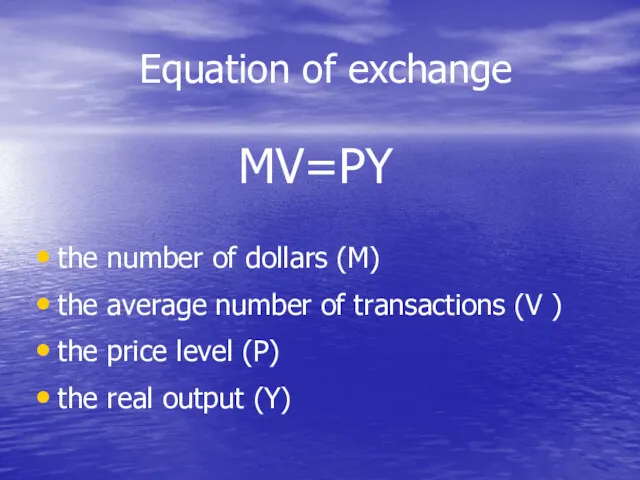
Equation of exchange
MV=PY
the number of dollars (M)
the average number
Equation of exchange
MV=PY
the number of dollars (M)
the average number
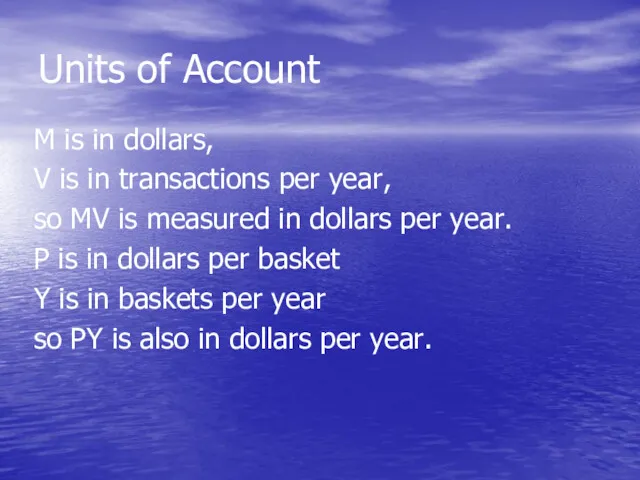
Units of Account
M is in dollars,
V is in transactions per
Units of Account
M is in dollars,
V is in transactions per
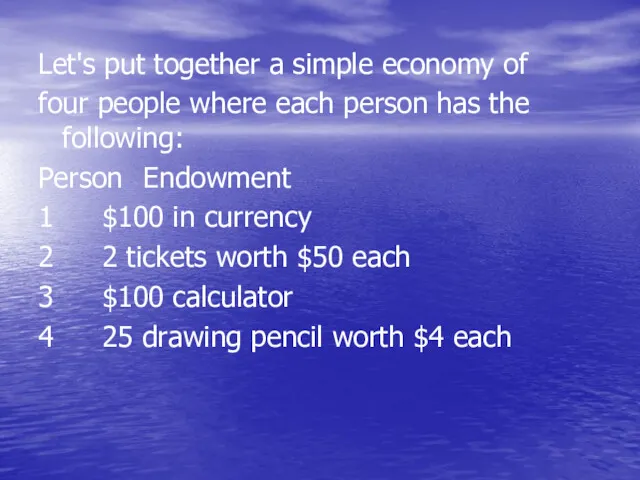
Let's put together a simple economy of
four people where each person
Let's put together a simple economy of
four people where each person
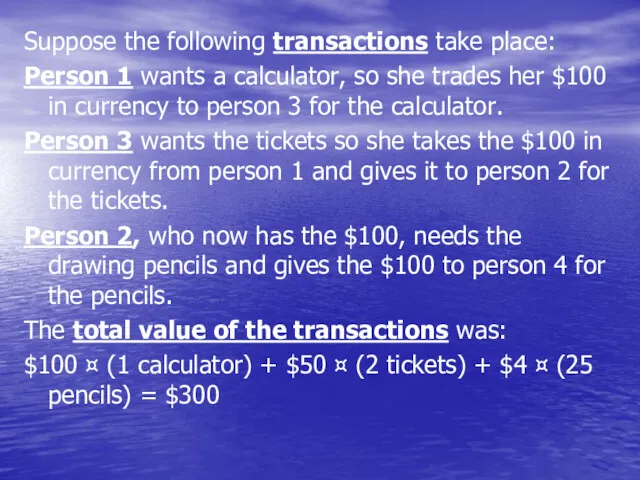
Suppose the following transactions take place:
Person 1 wants a calculator, so
Suppose the following transactions take place:
Person 1 wants a calculator, so
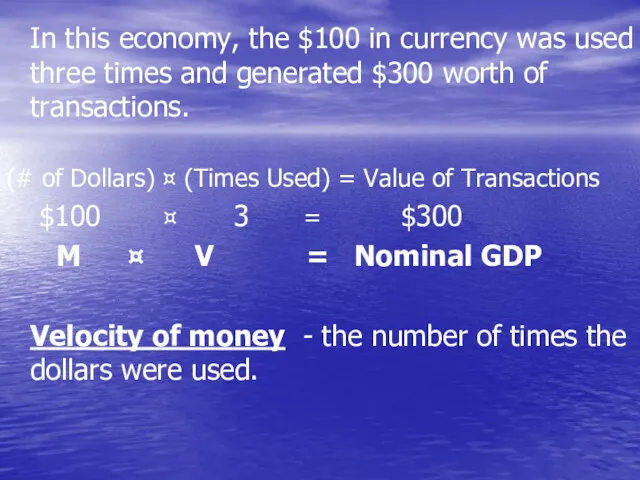
In this economy, the $100 in currency was used three times
In this economy, the $100 in currency was used three times
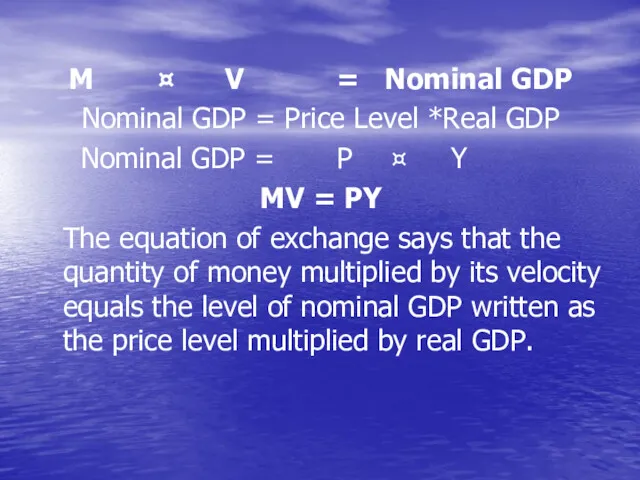
M ¤ V = Nominal GDP
Nominal GDP = Price Level *Real
M ¤ V = Nominal GDP
Nominal GDP = Price Level *Real
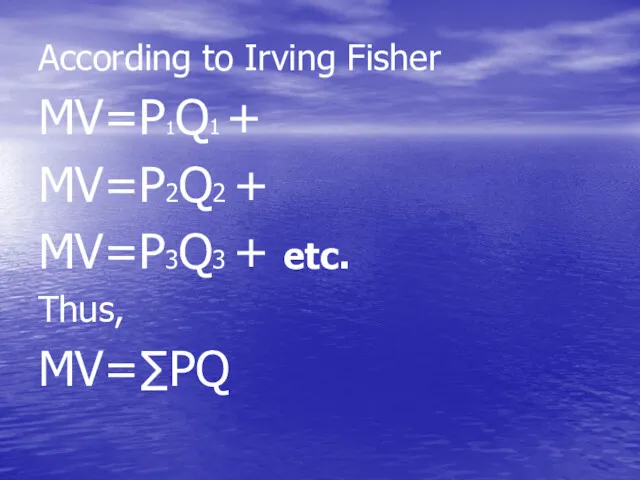
According to Irving Fisher
MV=P1Q1 +
MV=P2Q2 +
MV=P3Q3 + etc.
Thus,
MV=∑PQ
According to Irving Fisher
MV=P1Q1 +
MV=P2Q2 +
MV=P3Q3 + etc.
Thus,
MV=∑PQ
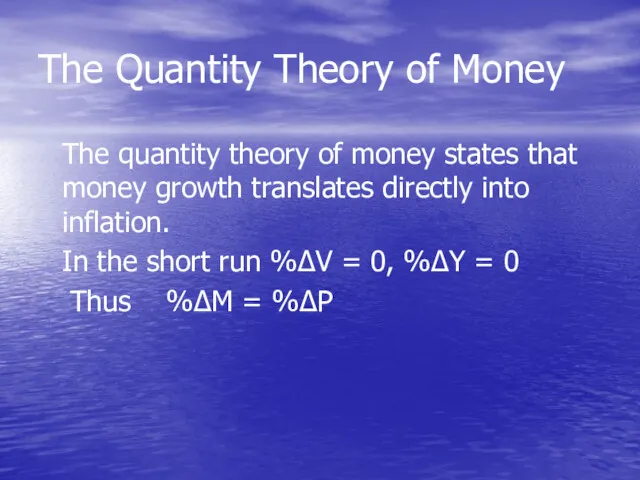
The Quantity Theory of Money
The quantity theory of money states that
The Quantity Theory of Money
The quantity theory of money states that
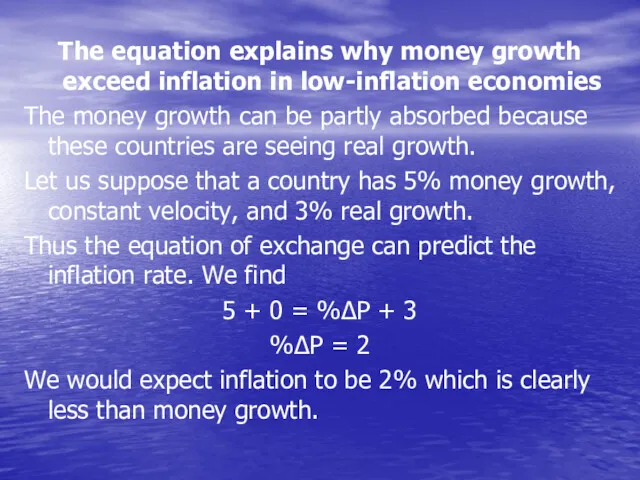
The equation explains why money growth exceed inflation in low-inflation economies
The
The equation explains why money growth exceed inflation in low-inflation economies
The
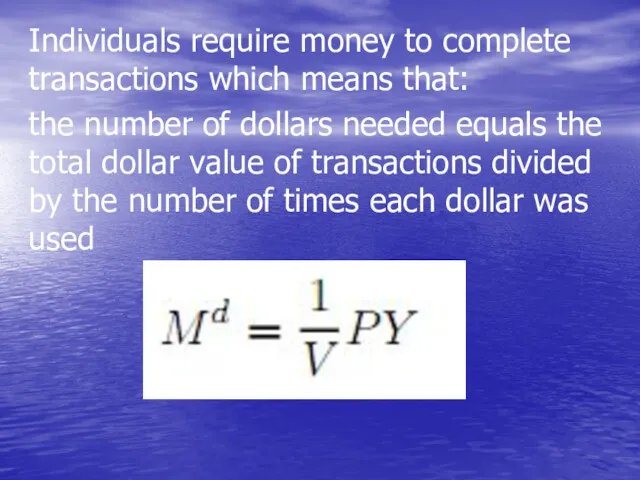
Individuals require money to complete transactions which means that:
the number of
Individuals require money to complete transactions which means that:
the number of
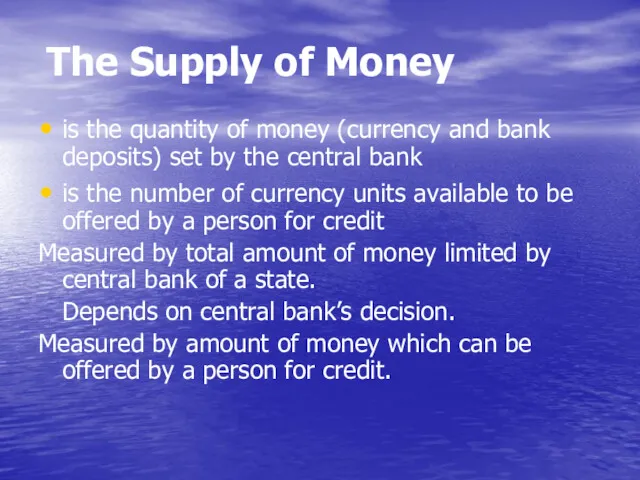
The Supply of Money
is the quantity of money (currency and
The Supply of Money
is the quantity of money (currency and
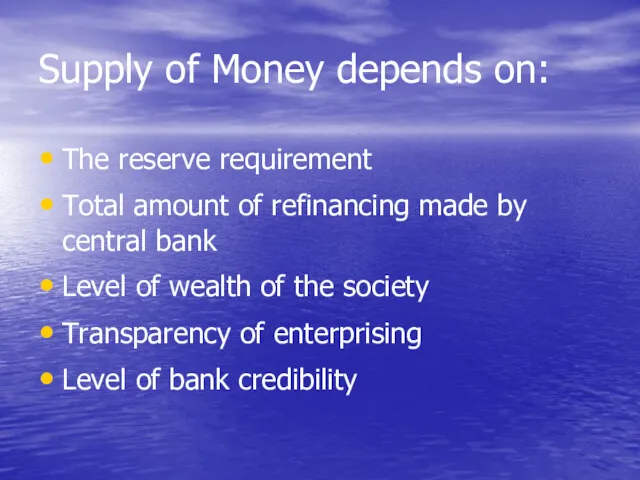
Supply of Money depends on:
The reserve requirement
Total amount of refinancing made
Supply of Money depends on:
The reserve requirement
Total amount of refinancing made
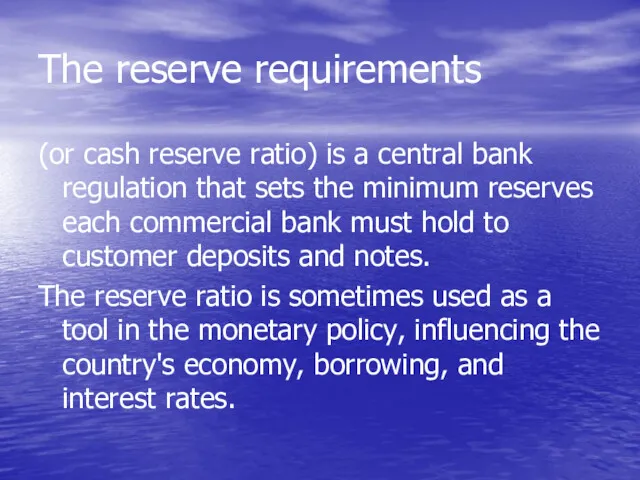
The reserve requirements
(or cash reserve ratio) is a central bank regulation
The reserve requirements
(or cash reserve ratio) is a central bank regulation
Characteristics of Supply Curve
Since the supply of money does not vary
Characteristics of Supply Curve
Since the supply of money does not vary
Intersection of Demand for Money and Supply of Money Determine the
Intersection of Demand for Money and Supply of Money Determine the
Balance of supply & demand
In Figure the supply of money is
Balance of supply & demand
In Figure the supply of money is
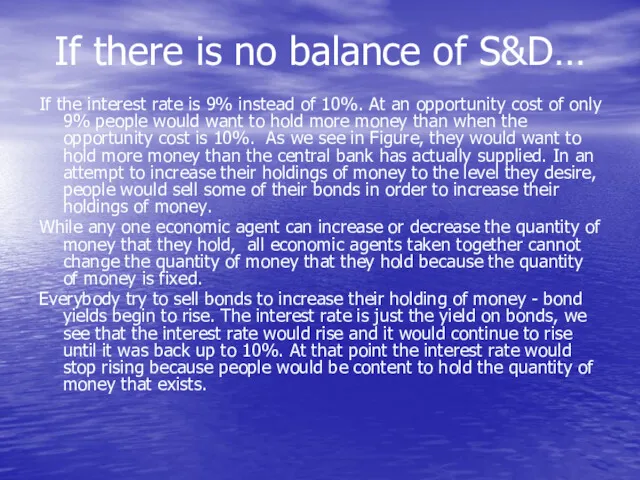
If there is no balance of S&D…
If the interest rate is
If there is no balance of S&D…
If the interest rate is
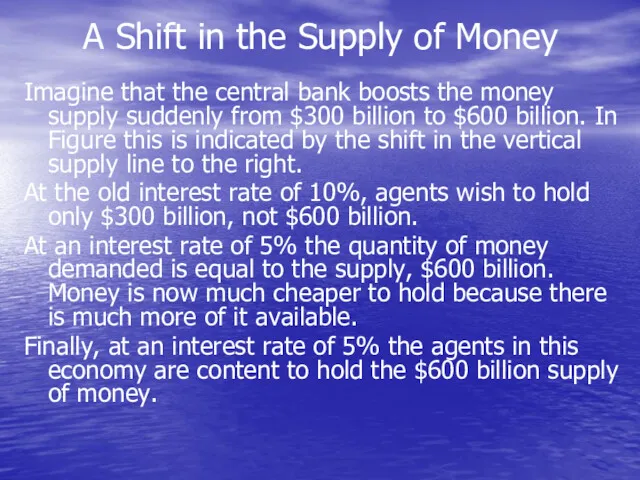
A Shift in the Supply of Money
Imagine that the central
A Shift in the Supply of Money
Imagine that the central
A Shift
in the Supply of Money
A Shift
in the Supply of Money
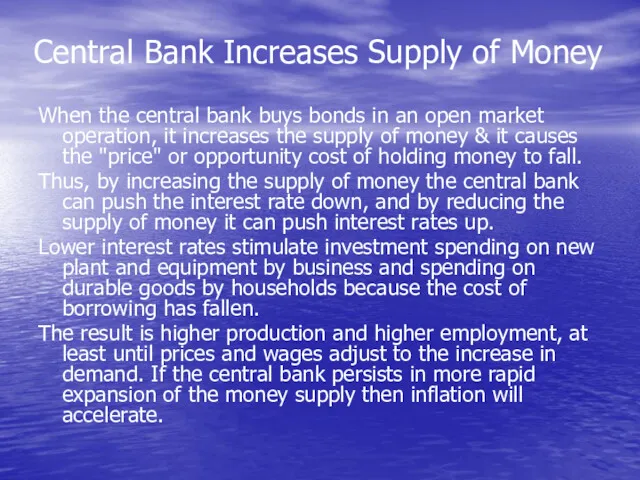
Central Bank Increases Supply of Money
When the central bank buys
Central Bank Increases Supply of Money
When the central bank buys
Central Bank Reduces Supply of Money
When the central bank sells bonds
Central Bank Reduces Supply of Money
When the central bank sells bonds
 Инновационные центры Индии
 Экономический рост и развитие. Понятие ВВП
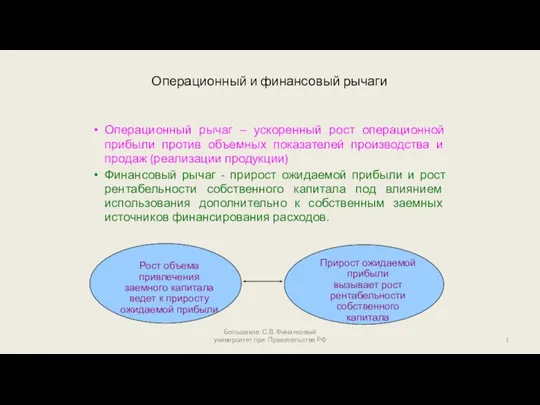 Операционный и финансовый рычаги
 Перебудова та розпад Радянського Союзу
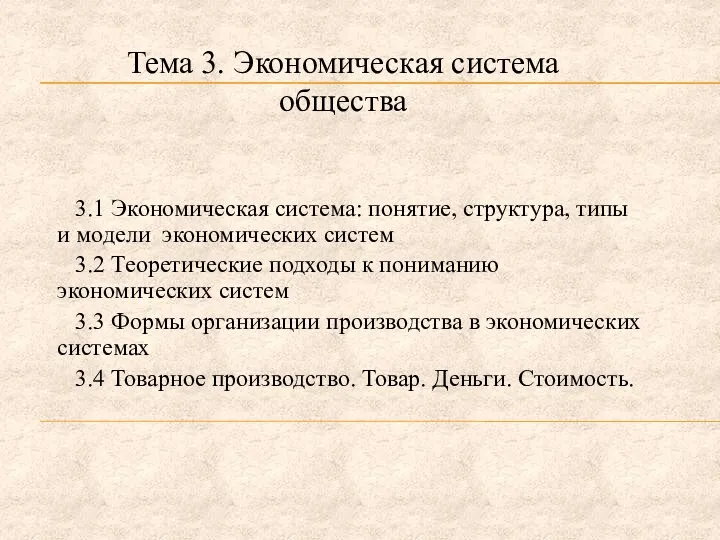 Экономическая система общества
 Индексный метод
 Рыночная экономика
 Социально-экономическое развитие Республики Крым и Севастополя на период до 2020 года
 Социология экономики и труда (тема №13 )
 Природные ресурсы. (Глава 8)
 Особые экономические зоны как разновидность СЭЗ
 Экономика, как наука. Возникновение и основные этапы развития экономической науки
 Политика привлечения прямых иностранных инвестиций
 Economic system
 Антимонопольное регулирование и антимонопольная политика
 Світова валютна система і міжнародні валютно-фінансові відносини. (Лекція 11)
 Химическая промышленность мира
 Технико-экономическая характеристика транспортно-логистической цепи доставки стали
 Управление конкурентноспособностью
 Виды барьеров входа-выхода
 Кругооборот ресурсов, товаров и услуг, денег
 Рынок труда. Самые востребованные профессии. Прогнозы специалистов
 Национальная инновационная политика и инновационная среда
 Исследование перехода к хаосу в экономических системах
 Экономическая оценка инвестиционных проектов
 Востребованность японского языка на трудовом рынке России
 Қазақстанның саласындағы инвестициялық хал-ахуалдың проблемалары мен перспективаларыпроблемаларын талқылау
 Задачи антикризисных менеджеров