- Topics in Macroeconomics

Содержание
- 2. Topics in Macroeconomics WIUT Date: January 8, 2018 Presenter: Dr. Bilol Buzurukov MODULE
- 3. Module Leader Module leader: Bilol Buzurukov Email: bbuzurukov@wiut.uz Office hours: Thursday 09:00-11:00 Room number: ATB-216 Telephone
- 4. Module Delivery The module will be taught by a combination of lectures and tutorials. Lectures are
- 5. Module Content TW-1: Introduction to growth theory; TW-2: Solow Model of Economic Growth I; TW-3: Solow
- 6. Learning Outcomes Upon completion of the module, successful students will be able to: 1. Critically evaluate
- 7. Learning Platform University Intranet System Lecture and Seminar slides posted weekly; Support materials, such as articles,
- 8. Textbooks and Reading Resources Core Textbooks Sorensen & Whitta Jacobsen (2010), " Introducing Advanced Macroeconomics: Growth
- 9. Assessment Assessment 1 – Coursework 40% Assessment 2 – Final Exam 60%
- 10. Guidelines for Assessment 1 Each team should consist of 5 students who belong to the same
- 11. LECTURE 1 Introduction to Growth Theory
- 12. Some Facts about Prosperity and Growth The average level of prosperity in a country can be
- 13. Some Facts about Prosperity and Growth How do we measure the prosperity of a country? What
- 14. GDP per capita Why is GDP per capita a flawed measure of economic well-being? GDP counts
- 15. The importance of growth in GDP per worker for the level of GDP per worker Real
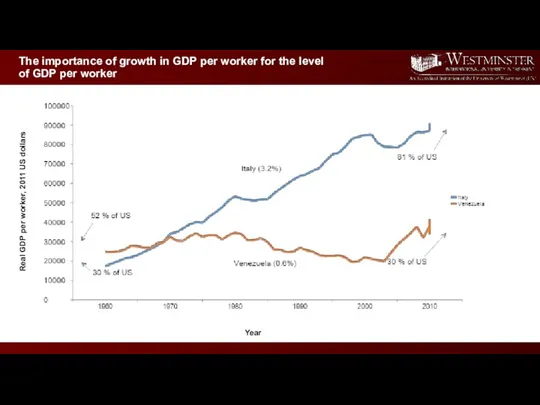
- 16. Real GDP per worker, 2011 US dollars Year The importance of growth in GDP per worker
- 17. Real GDP per worker, 2011 US dollars Year The importance of growth in GDP per worker
- 18. Measuring the Wealth of a Nation How do we compare the income per person across countries?
- 19. GDP PPP versus Nominal GDP Take a basket of commodities, such as 1 kg sugar, wheat
- 20. Measuring the Wealth of a Nation Competing proxies: GDP per capita GDP per worker Some issues
- 21. GDP per capita and per worker (2000)
- 22. The rich and the poor, the growing and the declining
- 23. The world income distribution 2003: Gini 0.51 2007: Gini 0.38 According to CIA data (overall) Source:
- 24. 1988 2011 Global Income Distribution
- 25. 15 poorest nations
- 26. 15 richest nations
- 27. World growth ‘bottom 10’ and ‘top 10’ 1965-2003 Growth Disasters Growth Miracles Growth rates vary substantially
- 28. Quiz What do you think? What are the main reasons for some sub-Saharan and Middle East
- 29. CONVERGENCE Types of Convergence Absolute Convergence Conditional Convergence Club Convergence An interesting idea in economics would,
- 30. Absolute Convergence Hypothesis: In the long run GDP per worker (or per capita) converges to one
- 31. Convergence of GDP per worker Log of Real GDP per worker, 2011 US dollars Year Source:
- 32. Foreign Aid As you witnessed from the graph, if the poverty disappears by itself, doesn’t it
- 33. In other words, average growth in GDP per worker from year 0 to year T. say,
- 34. Average annual growth rate of GDP per worker against initial level of GDP per worker OLS
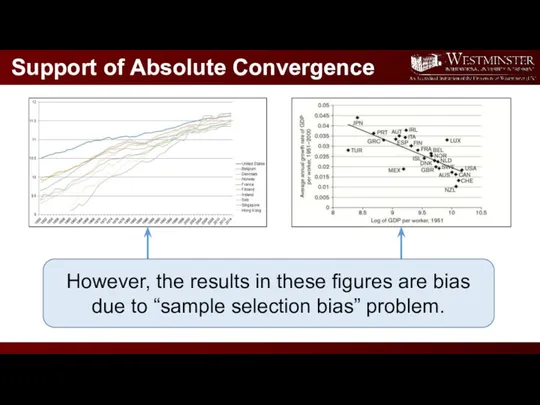
- 35. Support of Absolute Convergence However, the results in these figures are bias due to “sample selection
- 36. Results without “sample selection bias” OLS results y= 0.013- 0.0006x R2 = 0.0013 t= 0.34 Avoiding
- 37. Structural Characteristics of Countries Countries with higher rates of saving and investment have higher rates of
- 38. Conditional Convergence Hypothesis: A country's income per worker converges to a country-specific long-run growth path which
- 39. Modeling Conditional Convergence Where: z – a vector of variables capturing country-specific structural characteristics; Ϫ -is
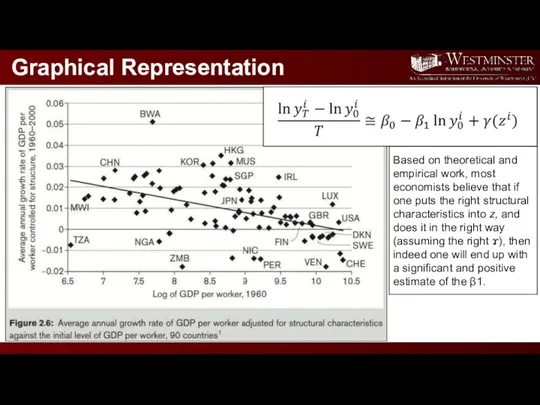
- 40. Graphical Representation Based on theoretical and empirical work, most economists believe that if one puts the
- 41. Foreign Aid What is the role of foreign aid in conditional convergence?
- 42. Club Convergence Hypothesis: A country's income per worker converges to a long-run growth path that depends
- 43. Club Convergence What is the role of foreign aid in club convergence?
- 44. Summary of Convergence Convergence: lf one controls appropriately for structural differences between the countries of the
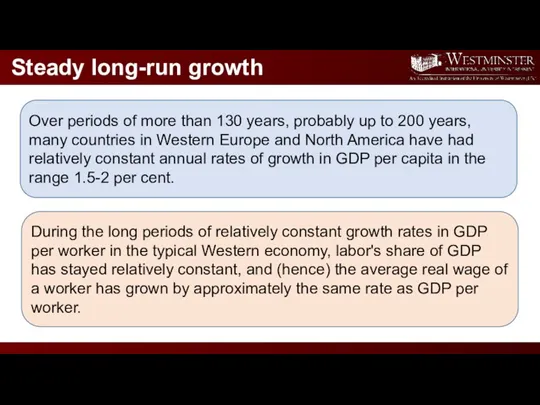
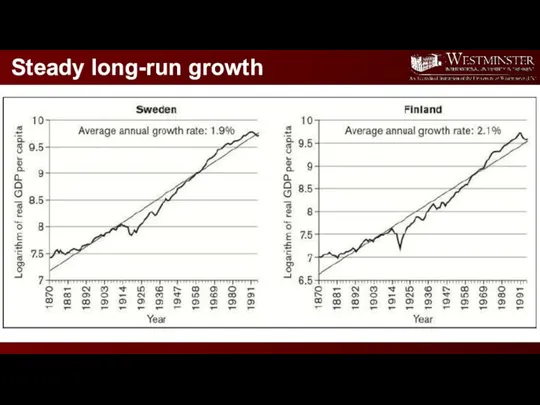
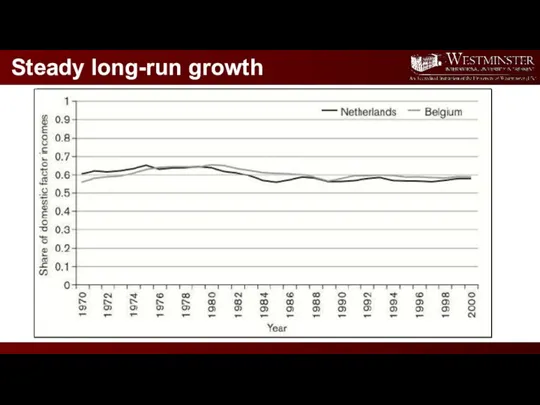
- 45. Steady long-run growth Over periods of more than 130 years, probably up to 200 years, many
- 46. Steady long-run growth
- 47. Steady long-run growth
- 48. Balanced Growth The growth process follows a balanced growth path if GDP per worker, consumption per
- 49. Reference Sorensen & Whitta Jacobsen (2010), " Introducing Advanced Macroeconomics: Growth and Business Cycles", 2nd ed.
- 51. Скачать презентацию

Topics in Macroeconomics
WIUT
Date: January 8, 2018
Presenter: Dr. Bilol Buzurukov
MODULE
Topics in Macroeconomics
WIUT
Date: January 8, 2018
Presenter: Dr. Bilol Buzurukov
MODULE
Module Leader
Module leader: Bilol Buzurukov
Email: bbuzurukov@wiut.uz
Office hours: Thursday 09:00-11:00
Room number: ATB-216
Telephone
Module Leader
Module leader: Bilol Buzurukov
Email: bbuzurukov@wiut.uz
Office hours: Thursday 09:00-11:00
Room number: ATB-216
Telephone

Module Delivery
The module will be taught by a combination of lectures
Module Delivery
The module will be taught by a combination of lectures
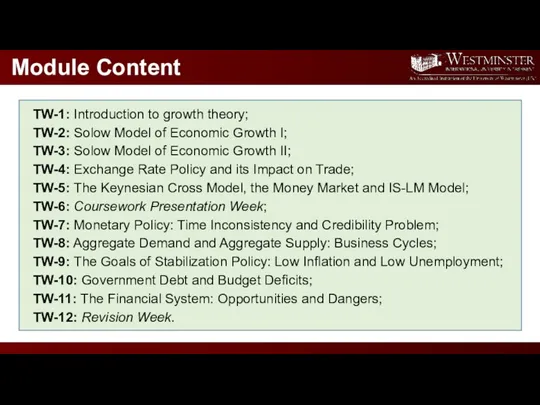
Module Content
TW-1: Introduction to growth theory;
TW-2: Solow Model of Economic Growth
Module Content
TW-1: Introduction to growth theory;
TW-2: Solow Model of Economic Growth
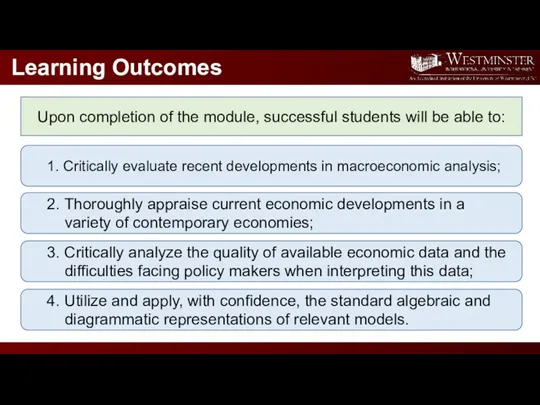
Learning Outcomes
Upon completion of the module, successful students will be able
Learning Outcomes
Upon completion of the module, successful students will be able

Learning Platform
University Intranet System
Lecture and Seminar slides posted weekly;
Support materials, such
Learning Platform
University Intranet System
Lecture and Seminar slides posted weekly;
Support materials, such

Textbooks and Reading Resources
Core Textbooks
Sorensen & Whitta Jacobsen (2010), " Introducing
Textbooks and Reading Resources
Core Textbooks
Sorensen & Whitta Jacobsen (2010), " Introducing
Assessment
Assessment 1 – Coursework
40%
Assessment 2 – Final Exam
60%
Assessment
Assessment 1 – Coursework
40%
Assessment 2 – Final Exam
60%

Guidelines for Assessment 1
Each team should consist of 5 students who
Guidelines for Assessment 1
Each team should consist of 5 students who
LECTURE 1
Introduction to Growth Theory
LECTURE 1
Introduction to Growth Theory
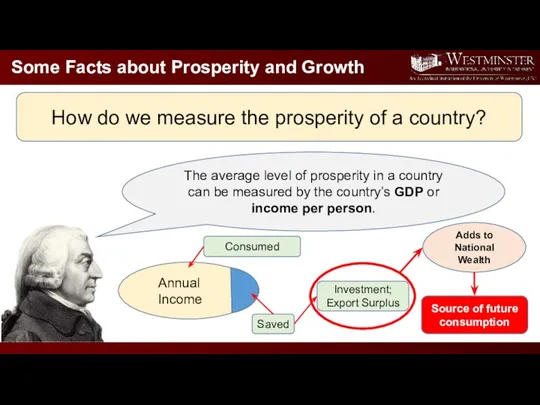
Some Facts about Prosperity and Growth
The average level of prosperity in
Some Facts about Prosperity and Growth
The average level of prosperity in
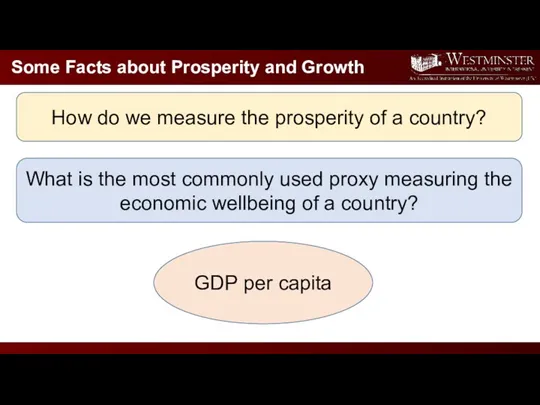
Some Facts about Prosperity and Growth
How do we measure the prosperity
Some Facts about Prosperity and Growth
How do we measure the prosperity
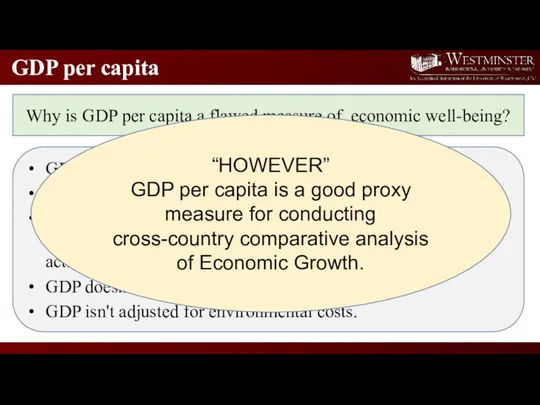
GDP per capita
Why is GDP per capita a flawed measure of
GDP per capita
Why is GDP per capita a flawed measure of
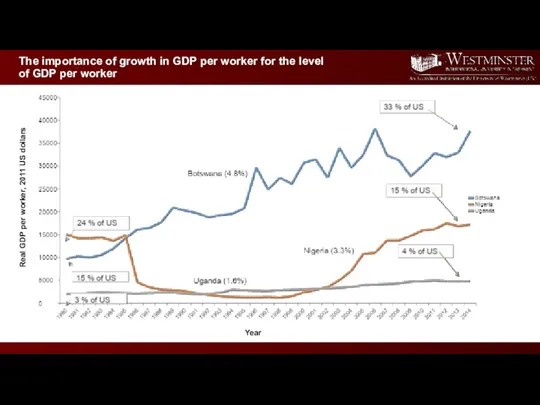
The importance of growth in GDP per worker for the level
The importance of growth in GDP per worker for the level
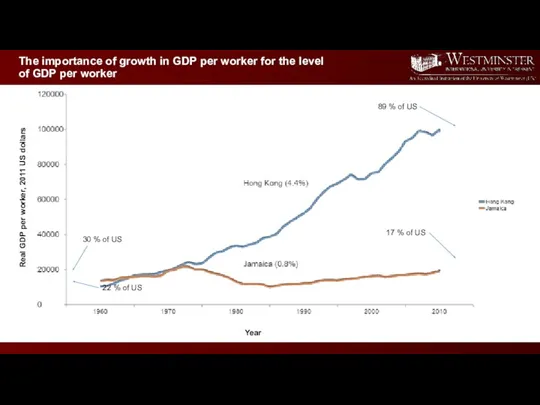
Real GDP per worker, 2011 US dollars
Year
The importance of growth in
Real GDP per worker, 2011 US dollars
Year
The importance of growth in
Real GDP per worker, 2011 US dollars
Year
The importance of growth in
Real GDP per worker, 2011 US dollars
Year
The importance of growth in

Measuring the Wealth of a Nation
How do we compare the income
Measuring the Wealth of a Nation
How do we compare the income
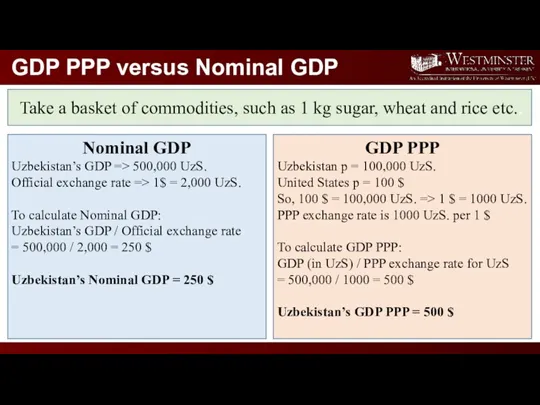
GDP PPP versus Nominal GDP
Take a basket of commodities, such as
GDP PPP versus Nominal GDP
Take a basket of commodities, such as
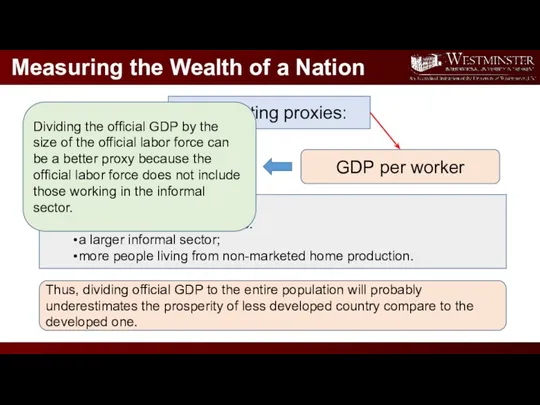
Measuring the Wealth of a Nation
Competing proxies:
GDP per capita
GDP per worker
Some
Measuring the Wealth of a Nation
Competing proxies:
GDP per capita
GDP per worker
Some
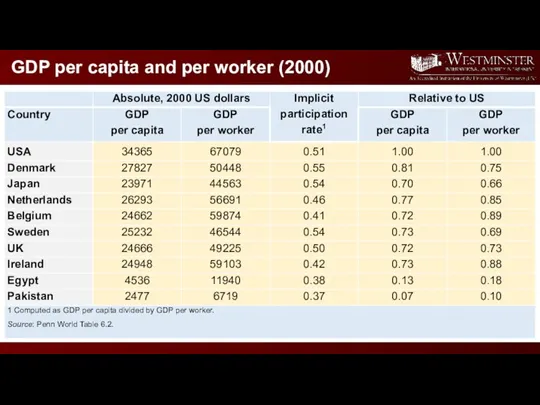
GDP per capita and per worker (2000)
GDP per capita and per worker (2000)
The rich and the poor,
the growing and the declining
The rich and the poor,
the growing and the declining
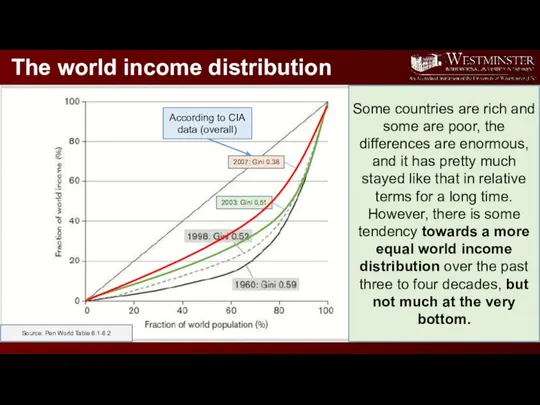
The world income distribution
2003: Gini 0.51
2007: Gini 0.38
According to CIA data
The world income distribution
2003: Gini 0.51
2007: Gini 0.38
According to CIA data
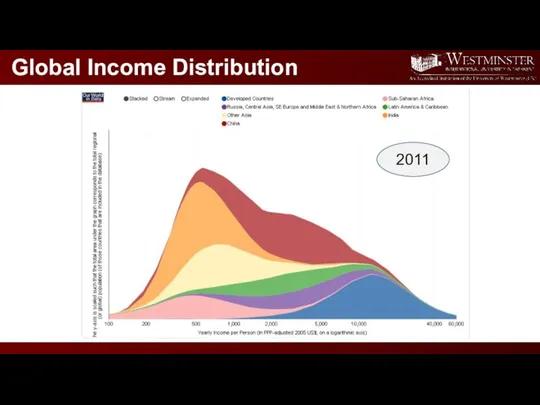
1988
2011
Global Income Distribution
1988
2011
Global Income Distribution
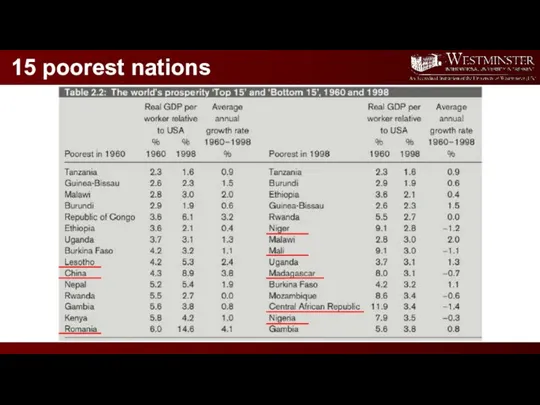
15 poorest nations
15 poorest nations
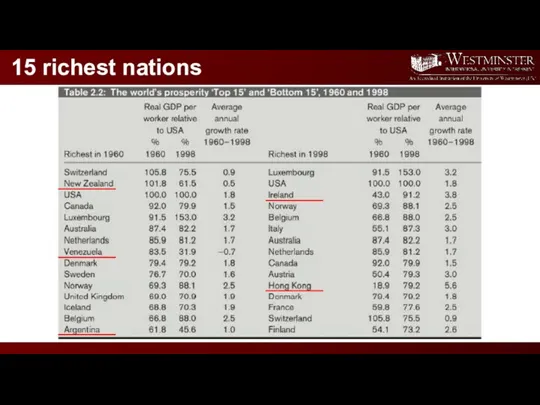
15 richest nations
15 richest nations
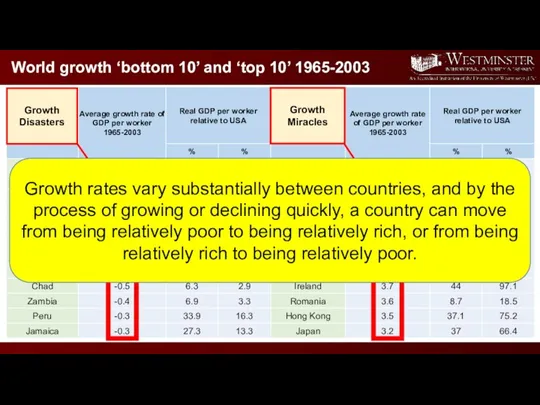
World growth ‘bottom 10’ and ‘top 10’ 1965-2003
Growth Disasters
Growth Miracles
Growth rates
World growth ‘bottom 10’ and ‘top 10’ 1965-2003
Growth Disasters
Growth Miracles
Growth rates
Quiz
What do you think?
What are the main reasons for some sub-Saharan
Quiz
What do you think?
What are the main reasons for some sub-Saharan
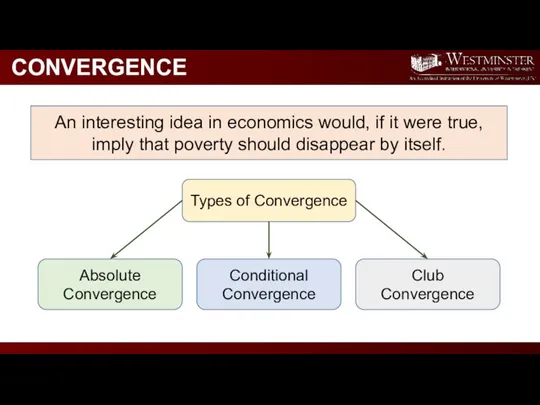
CONVERGENCE
Types of Convergence
Absolute Convergence
Conditional Convergence
Club
Convergence
An interesting idea in economics would, if
CONVERGENCE
Types of Convergence
Absolute Convergence
Conditional Convergence
Club
Convergence
An interesting idea in economics would, if

Absolute Convergence
Hypothesis: In the long run GDP per worker (or per
Absolute Convergence
Hypothesis: In the long run GDP per worker (or per
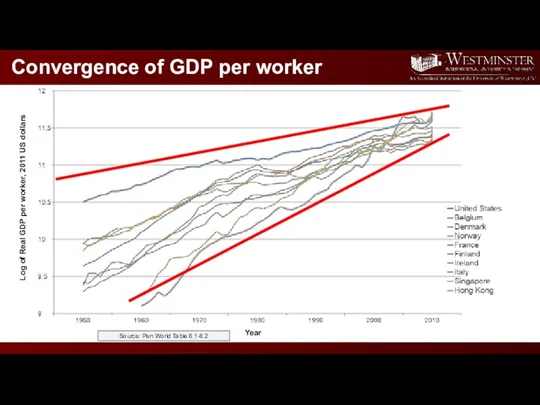
Convergence of GDP per worker
Log of Real GDP per worker, 2011
Convergence of GDP per worker
Log of Real GDP per worker, 2011
Foreign Aid
As you witnessed from the graph, if the poverty disappears
Foreign Aid
As you witnessed from the graph, if the poverty disappears
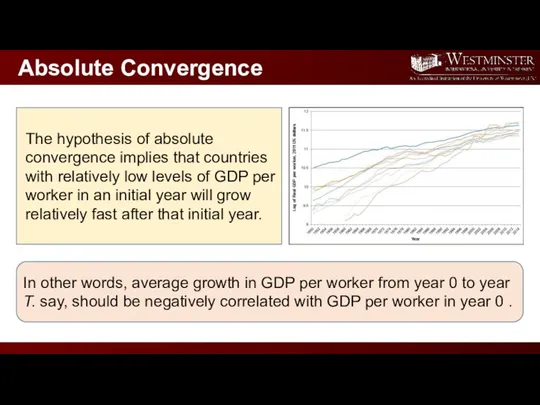
In other words, average growth in GDP per worker from year
In other words, average growth in GDP per worker from year
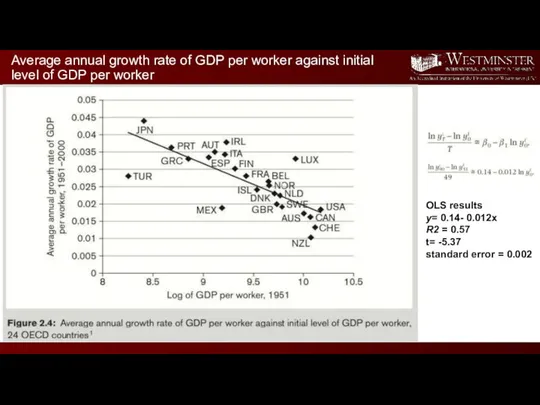
Average annual growth rate of GDP per worker against initial level
Average annual growth rate of GDP per worker against initial level
Support of Absolute Convergence
However, the results in these figures are bias
Support of Absolute Convergence
However, the results in these figures are bias
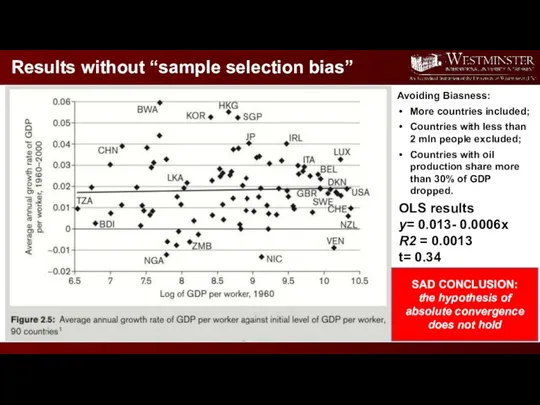
Results without “sample selection bias”
OLS results
y= 0.013- 0.0006x
R2 = 0.0013
t= 0.34
Avoiding
Results without “sample selection bias”
OLS results
y= 0.013- 0.0006x
R2 = 0.0013
t= 0.34
Avoiding
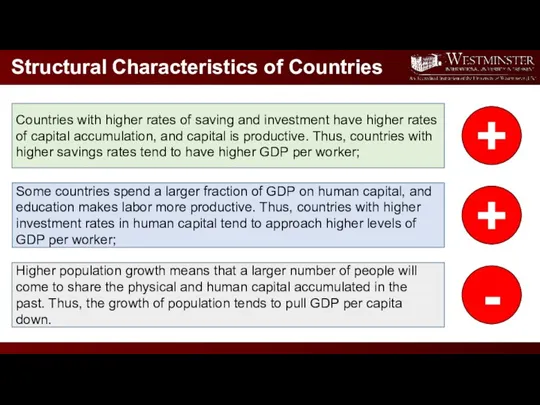
Structural Characteristics of Countries
Countries with higher rates of saving and investment
Structural Characteristics of Countries
Countries with higher rates of saving and investment
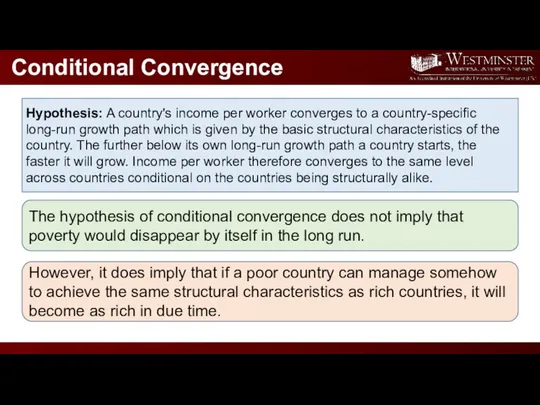
Conditional Convergence
Hypothesis: A country's income per worker converges to a country-specific
Conditional Convergence
Hypothesis: A country's income per worker converges to a country-specific
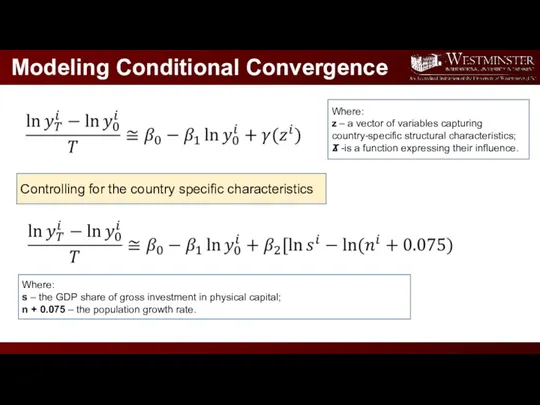
Modeling Conditional Convergence
Where:
z – a vector of variables capturing country-specific structural
Modeling Conditional Convergence
Where:
z – a vector of variables capturing country-specific structural
Graphical Representation
Based on theoretical and empirical work, most economists believe that
Graphical Representation
Based on theoretical and empirical work, most economists believe that
Foreign Aid
What is the role of foreign aid in conditional convergence?
Foreign Aid
What is the role of foreign aid in conditional convergence?
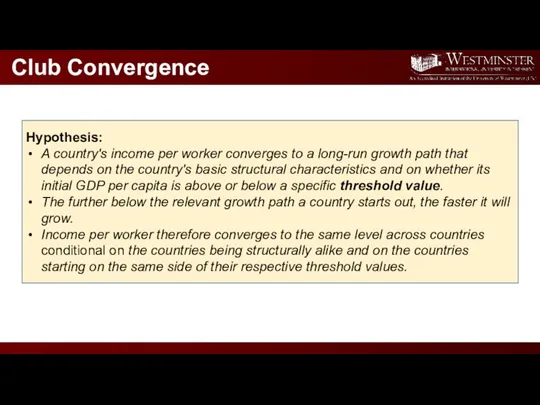
Club Convergence
Hypothesis:
A country's income per worker converges to a long-run growth
Club Convergence
Hypothesis:
A country's income per worker converges to a long-run growth
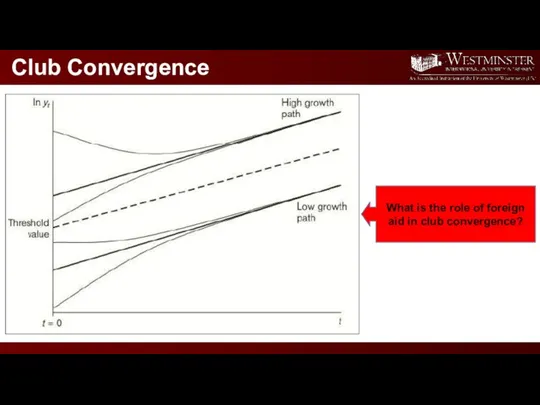
Club Convergence
What is the role of foreign aid in club convergence?
Club Convergence
What is the role of foreign aid in club convergence?

Summary of Convergence
Convergence: lf one controls appropriately for structural differences between
Summary of Convergence
Convergence: lf one controls appropriately for structural differences between
Steady long-run growth
Over periods of more than 130 years, probably up
Steady long-run growth
Over periods of more than 130 years, probably up
Steady long-run growth
Steady long-run growth
Steady long-run growth
Steady long-run growth
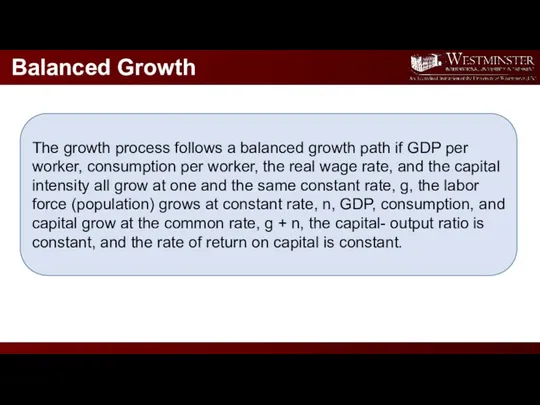
Balanced Growth
The growth process follows a balanced growth path if GDP
Balanced Growth
The growth process follows a balanced growth path if GDP
Reference
Sorensen & Whitta Jacobsen (2010), " Introducing Advanced Macroeconomics: Growth and Business
Reference
Sorensen & Whitta Jacobsen (2010), " Introducing Advanced Macroeconomics: Growth and Business
 Предприятие. Предпринимательство
 Аралас экономика және қазіргі қоғамдық өндіріс қызмет етуінің объективті нысаны
 Великое экономическое чудо Сингапура. Ли Куан Ю
 Экономика и ее роль в жизни общества
 Издержки производства и себестоимость продукции
 Центральный экономический район (ЦЭР)
 Трудовые ресурсы и рынок труда
 Азық-түлік мәселесінің себептері
 Рыночные отношения в здравоохранении
 Анализ целевого рынка
 ЕГЭ обществознание. Сборник типовых КИМов
 Роль Грузии в Новом шёлковом пути
 Научные исследования, как объект финансирования
 Теория потребительского выбора
 Устойчивое развитие Тверской области
 Рынок труда
 Impact of 2013 banking crisis in Republic of Cyprus on national economy
 Экономика страхования и финансовые основы страховой деятельности. Инвестиционная деятельность страховых компаний
 Национальное хозяйство (экономика) России. 9 класс
 Занятость и безработица
 Теория спроса и предложения. (Тема 1)
 Производственная мощность
 Факторы удовлетворенности жизнью в пожилом возрасте и политика государства
 Экономическая доктрина марксизма
 Спрос и предложение. (8 класс)
 Мировая экономика
 Труд. Индустриальное общество
 Муниципальное образование город Обнинск