Design and mechanical stability analysis of the interaction region for the inverse compton scattering gamma-ray source презентация
- Design and mechanical stability analysis of the interaction region for the inverse compton scattering gamma-ray source

Содержание
- 2. Introduction Design Static analysis Modal analysis Harmonic analysis Conclusion Contents
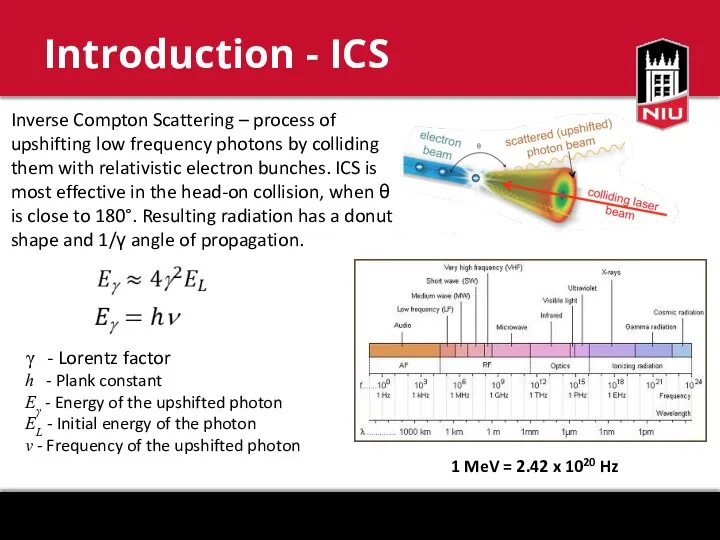
- 3. Introduction - ICS Inverse Compton Scattering – process of upshifting low frequency photons by colliding them
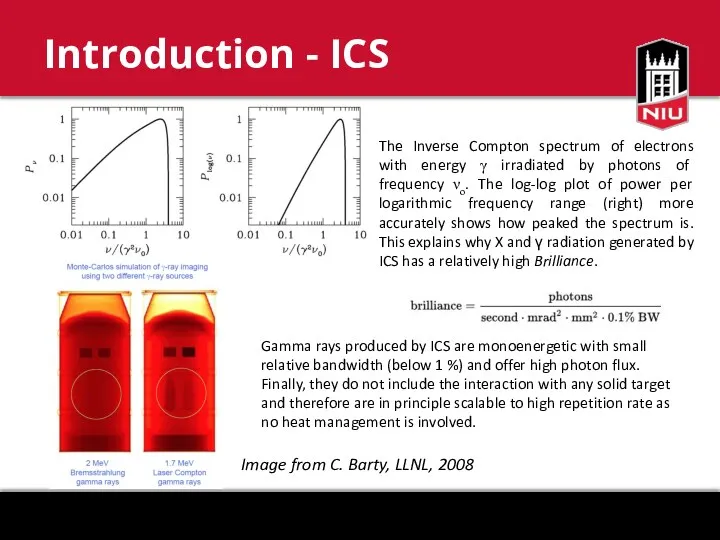
- 4. Introduction - ICS The Inverse Compton spectrum of electrons with energy γ irradiated by photons of
- 5. Introduction - Applications Standoff inspection Nuclear element detection Oncology Nuclear astrophysics Nuclear medicine
- 6. Introduction - FAST 120 m
- 7. Introduction - Interaction region Concept of the interaction region
- 8. Introduction - Main challenge Histograms of the stacked laser intensity. Left – prior to the improvement
- 9. Cavity requirements: Recirculation cavity Target finesse > 1000 Vacuum chamber Impulse frequency 3 MHz No bending
- 10. Finesse is a characteristic of oscillatory systems and resonators. R1 =99.9% (entrance mirror) R2 =99.995% (high
- 11. Design - Herriott cell Francesco D'amato - “Variable length Herriott-type multipass cell”, EP 1972922 A1
- 12. Design - Finesse and amplification estimates
- 13. Design - Herriott cell α = 360°/23 = 15.65°
- 14. Designing - Dimensions Herriot cell length 1035 mm Herriot mirror diameter 65 mm Distance between concave
- 15. Design - mounts and supports Number of individual models - 33 Number of assembly elements -
- 16. Design - Vacuum chamber and frame Dimensions: 1500x420x336 mm Weight: 280 kg Dimensions: 1400x1015x780 mm Weight:
- 17. Static analysis - Implosion test The von Mises yield criterion The von Mises stress is often
- 18. ANSYS stress units - MPa A36 steel properties: Density of 7,800 kg/m3 Young's modulus 200 GPa
- 19. Static analysis - Implosion test
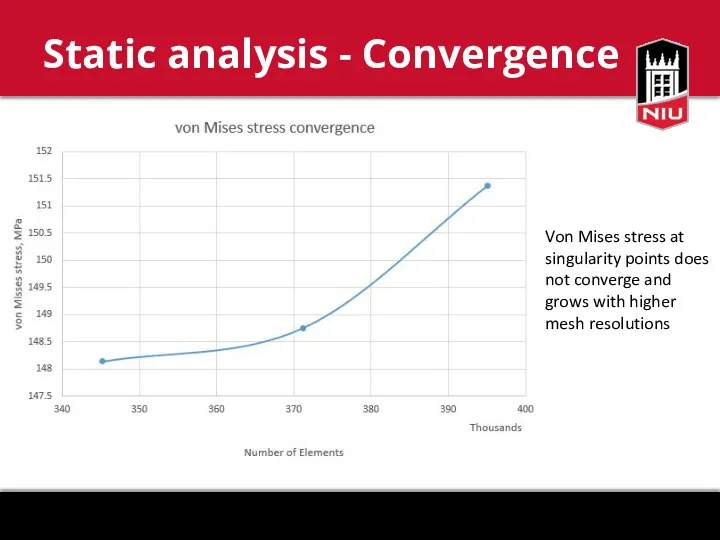
- 20. Static analysis - Convergence Von Mises stress at singularity points does not converge and grows with
- 21. Static analysis - Displacement
- 22. Static analysis - Gravity compression Von Mises stress - 9.29 MPa Generally, the stands are fastened
- 23. The purpose of performing a modal analysis is to find the natural frequencies and mode shapes
- 24. Modal analysis - Modal maps
- 25. Modal analysis - Convergence
- 26. A harmonic analysis finds the steady state response of a structure under sinusoidal loading conditions. A
- 27. Harmonic analysis - Loading data Courtesy of M. McGee (Fermilab)
- 28. Harmonic analysis - Seismograph readings |F(ω)| is called the amplitude spectrum of f Fourier transform is
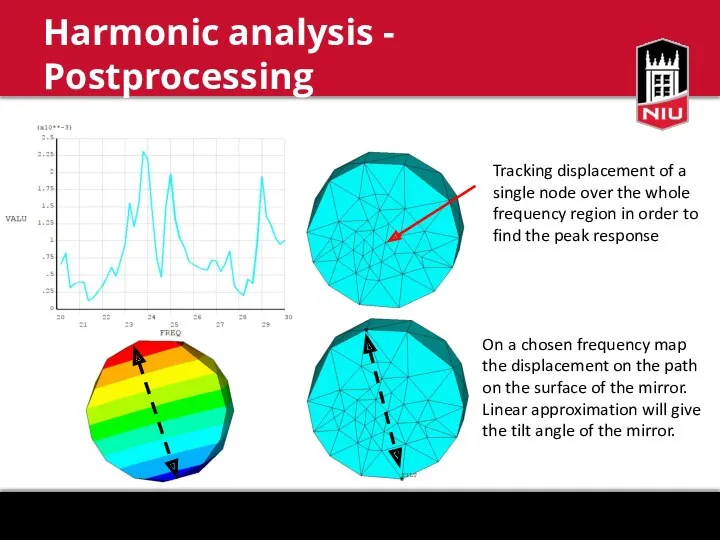
- 29. Harmonic analysis - Postprocessing Dangerous mode to be examined - concave mirror supports
- 30. Harmonic analysis - Postprocessing Tracking displacement of a single node over the whole frequency region in
- 31. Harmonic analysis - Critical displacement Design success criterions: Mirror displacement should not exceed wavelength of 1.054
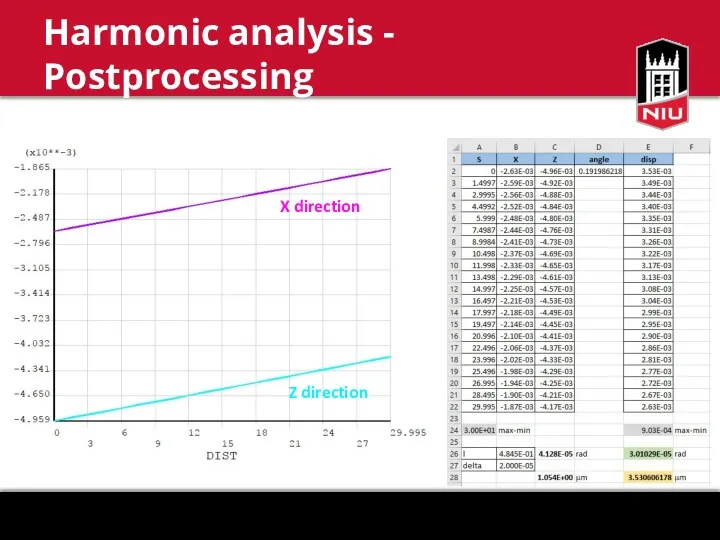
- 32. Harmonic analysis - Postprocessing X direction Z direction
- 33. Harmonic analysis - Solutions Geometry modifications Extra supports Make shorter mounts Height support modification has mitigated
- 34. ICS is an exceptional method of generating γ radiation of high brilliance, its development is important
- 36. Скачать презентацию
Introduction
Design
Static analysis
Modal analysis
Harmonic analysis
Conclusion
Contents
Introduction
Design
Static analysis
Modal analysis
Harmonic analysis
Conclusion
Contents
Introduction - ICS
Inverse Compton Scattering – process of upshifting low frequency
Introduction - ICS
Inverse Compton Scattering – process of upshifting low frequency
Introduction - ICS
The Inverse Compton spectrum of electrons with energy γ
Introduction - ICS
The Inverse Compton spectrum of electrons with energy γ
Introduction - Applications
Standoff inspection
Nuclear element detection
Oncology
Nuclear astrophysics
Nuclear medicine
Introduction - Applications
Standoff inspection
Nuclear element detection
Oncology
Nuclear astrophysics
Nuclear medicine
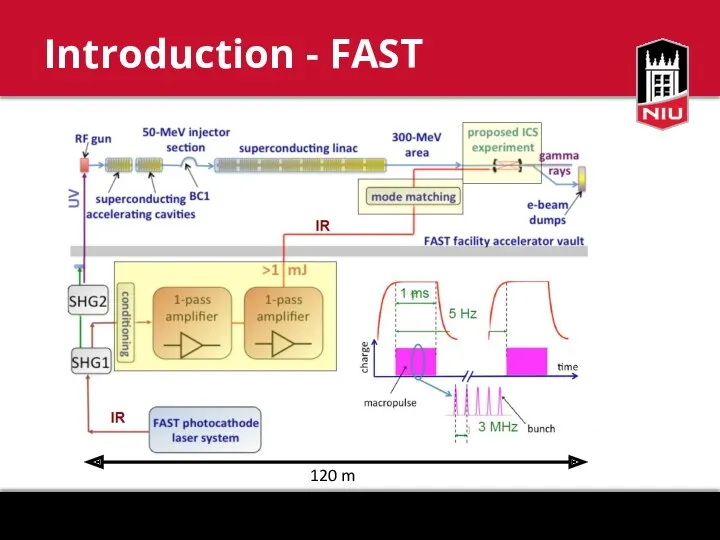
Introduction - FAST
120 m
Introduction - FAST
120 m
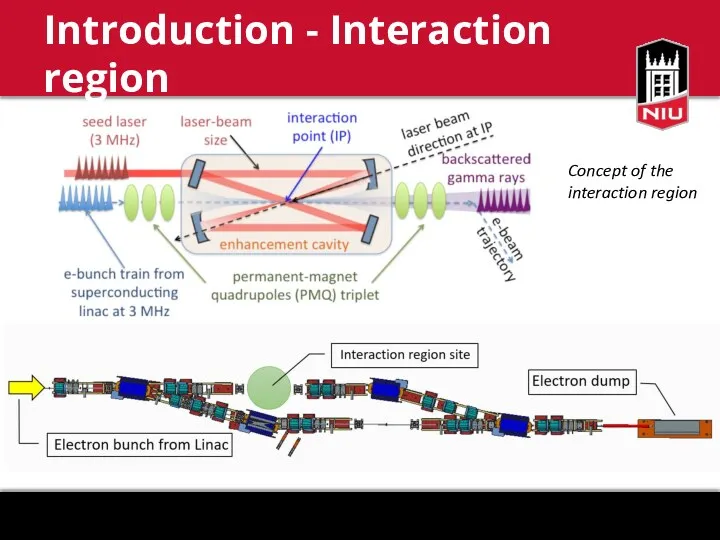
Introduction - Interaction region
Concept of the interaction region
Introduction - Interaction region
Concept of the interaction region
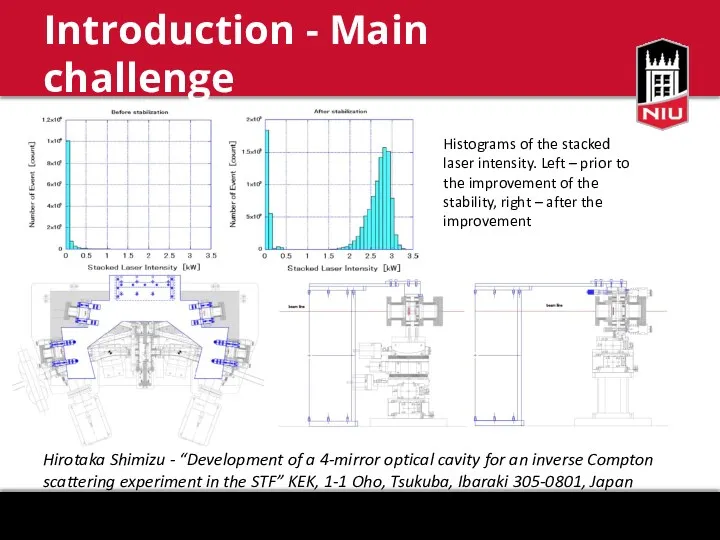
Introduction - Main challenge
Histograms of the stacked laser intensity. Left –
Introduction - Main challenge
Histograms of the stacked laser intensity. Left –
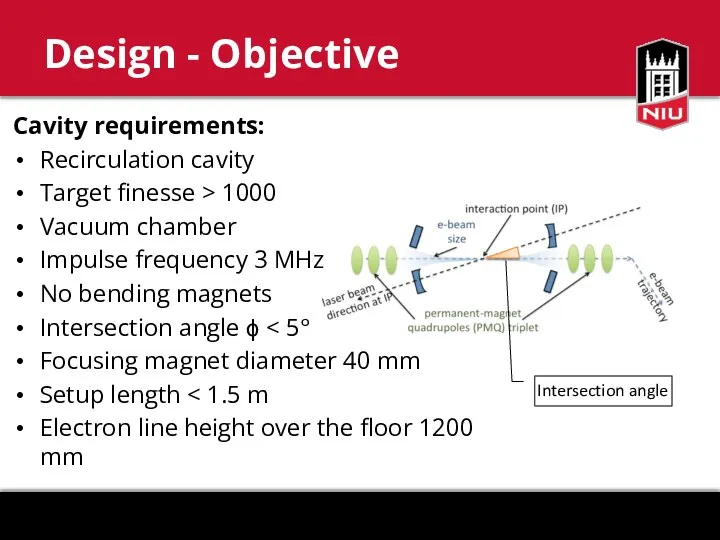
Cavity requirements:
Recirculation cavity
Target finesse > 1000
Vacuum chamber
Impulse frequency 3 MHz
No bending
Cavity requirements:
Recirculation cavity
Target finesse > 1000
Vacuum chamber
Impulse frequency 3 MHz
No bending
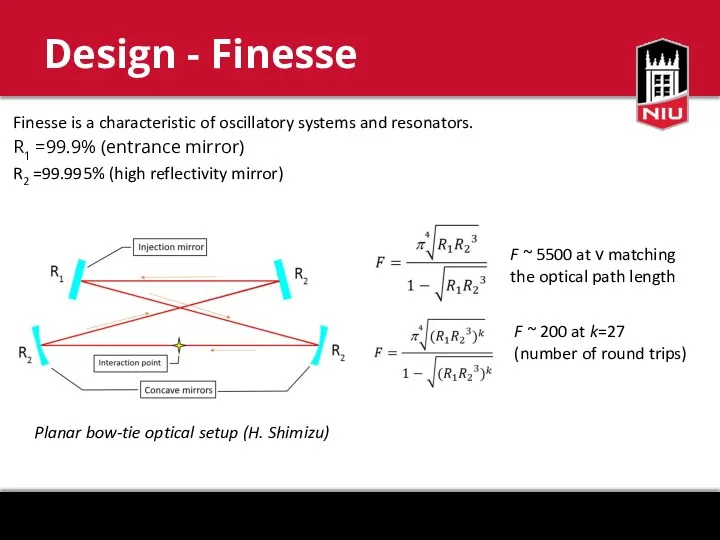
Finesse is a characteristic of oscillatory systems and resonators.
R1 =99.9% (entrance
Finesse is a characteristic of oscillatory systems and resonators.
R1 =99.9% (entrance
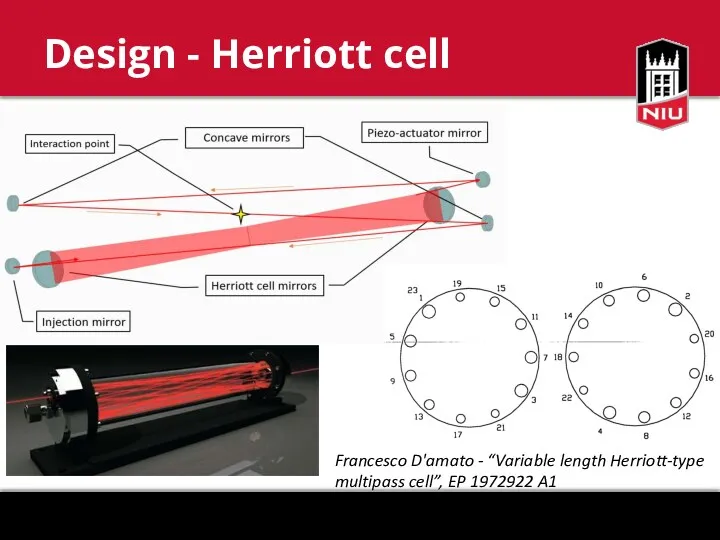
Design - Herriott cell
Francesco D'amato - “Variable length Herriott-type multipass cell”,
Design - Herriott cell
Francesco D'amato - “Variable length Herriott-type multipass cell”,
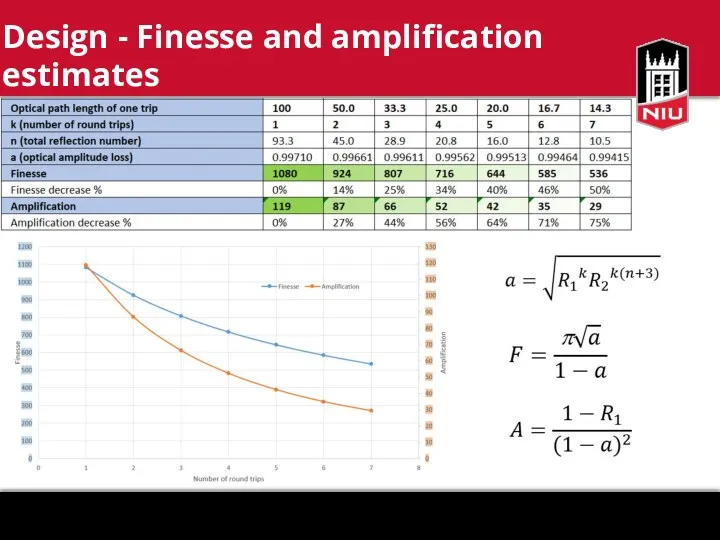
Design - Finesse and amplification estimates
Design - Finesse and amplification estimates
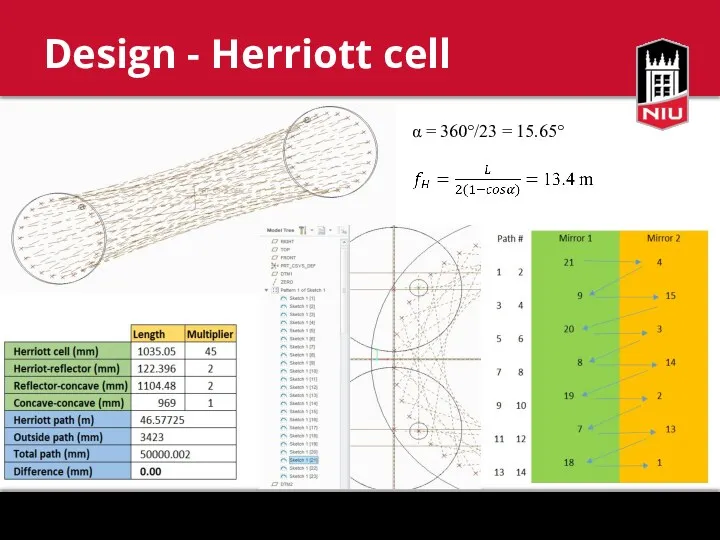
Design - Herriott cell
α = 360°/23 = 15.65°
Design - Herriott cell
α = 360°/23 = 15.65°
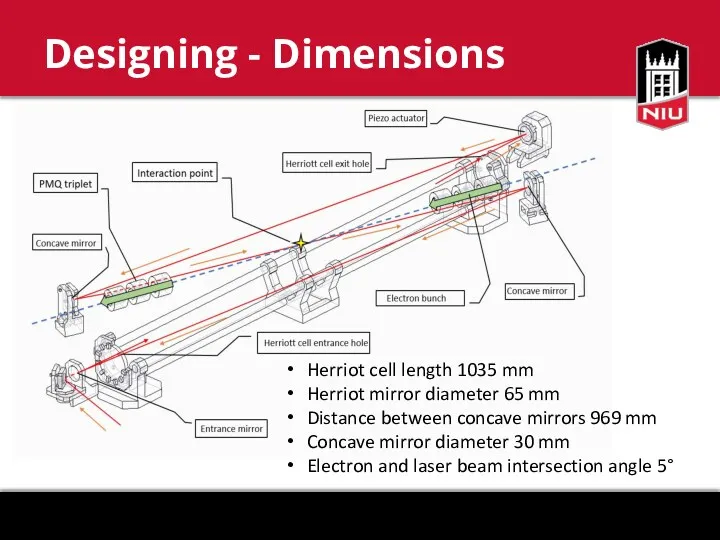
Designing - Dimensions
Herriot cell length 1035 mm
Herriot mirror diameter 65 mm
Distance
Designing - Dimensions
Herriot cell length 1035 mm
Herriot mirror diameter 65 mm
Distance
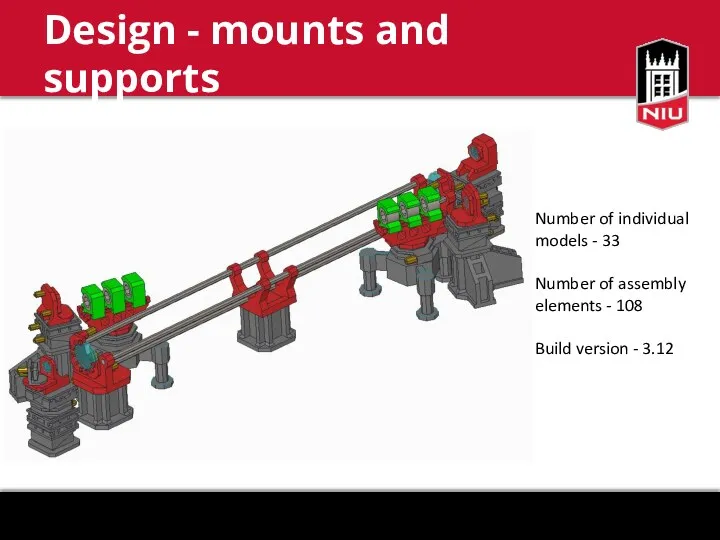
Design - mounts and supports
Number of individual models - 33
Number
Design - mounts and supports
Number of individual models - 33
Number
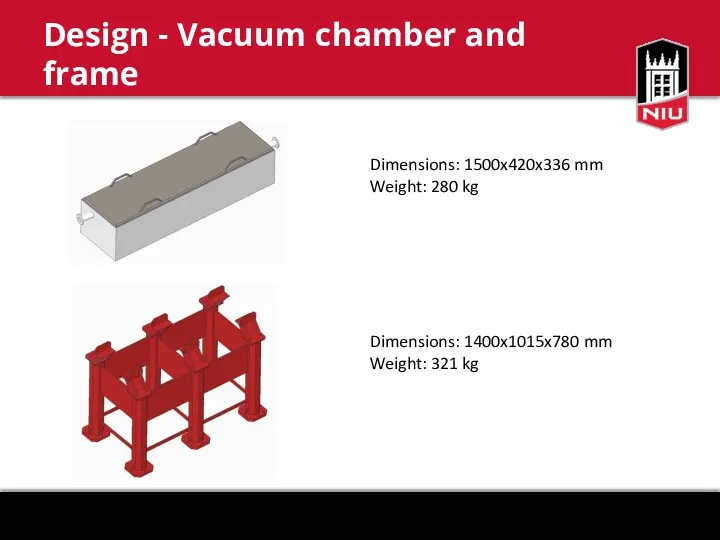
Design - Vacuum chamber and frame
Dimensions: 1500x420x336 mm
Weight: 280 kg
Dimensions: 1400x1015x780
Design - Vacuum chamber and frame
Dimensions: 1500x420x336 mm
Weight: 280 kg
Dimensions: 1400x1015x780
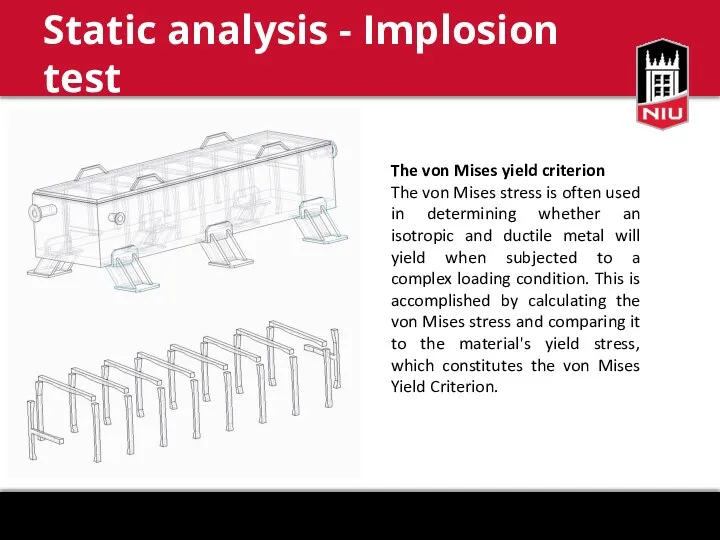
Static analysis - Implosion test
The von Mises yield criterion
The von
Static analysis - Implosion test
The von Mises yield criterion
The von
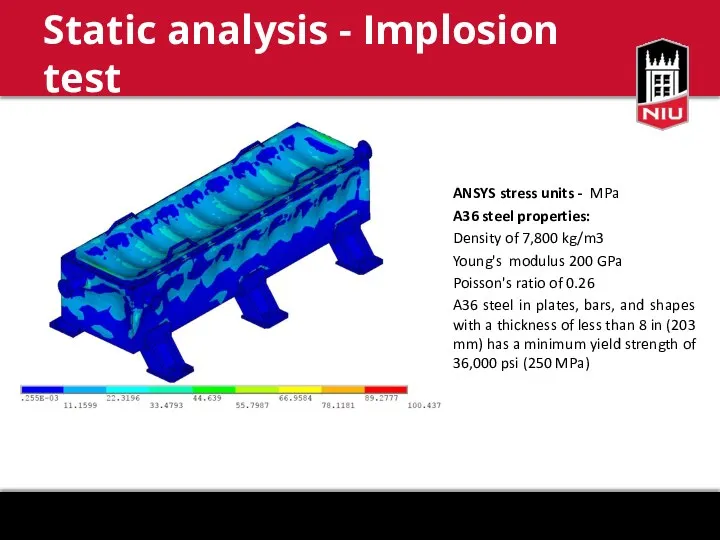
ANSYS stress units - MPa
A36 steel properties:
Density of 7,800 kg/m3
Young's
ANSYS stress units - MPa
A36 steel properties:
Density of 7,800 kg/m3
Young's
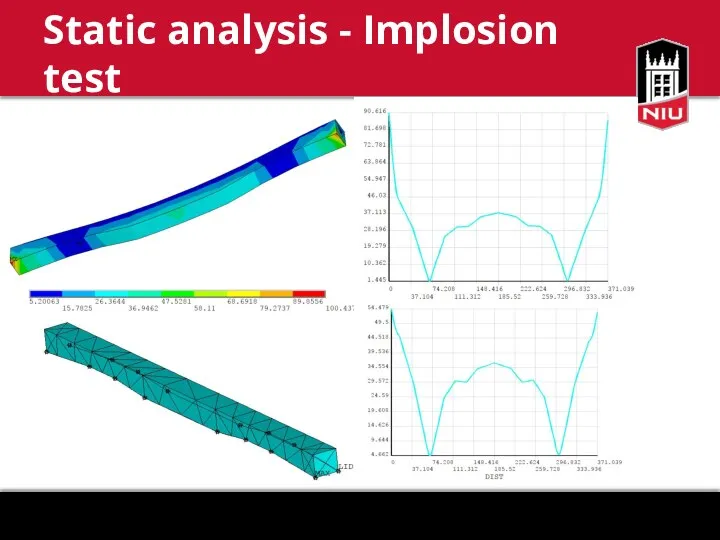
Static analysis - Implosion test
Static analysis - Implosion test
Static analysis - Convergence
Von Mises stress at singularity points does not
Static analysis - Convergence
Von Mises stress at singularity points does not
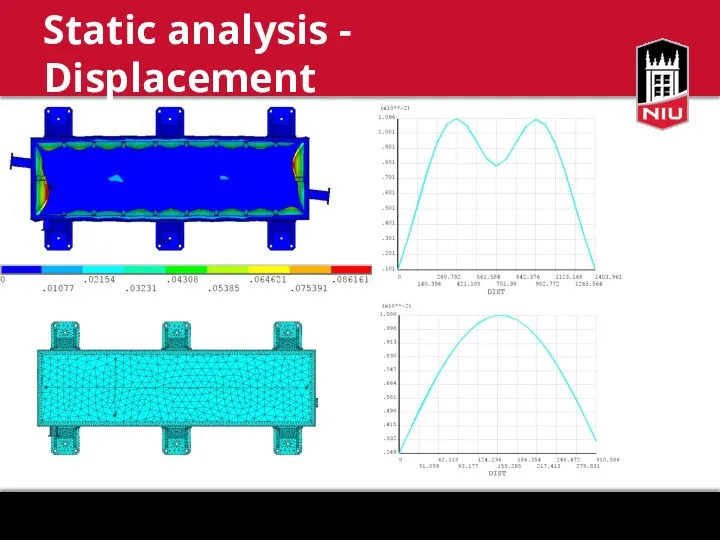
Static analysis - Displacement
Static analysis - Displacement
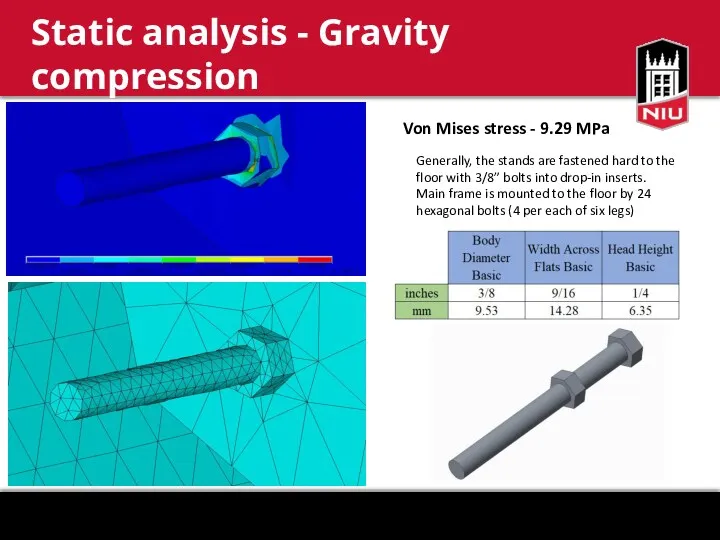
Static analysis - Gravity compression
Von Mises stress - 9.29 MPa
Generally, the
Static analysis - Gravity compression
Von Mises stress - 9.29 MPa
Generally, the
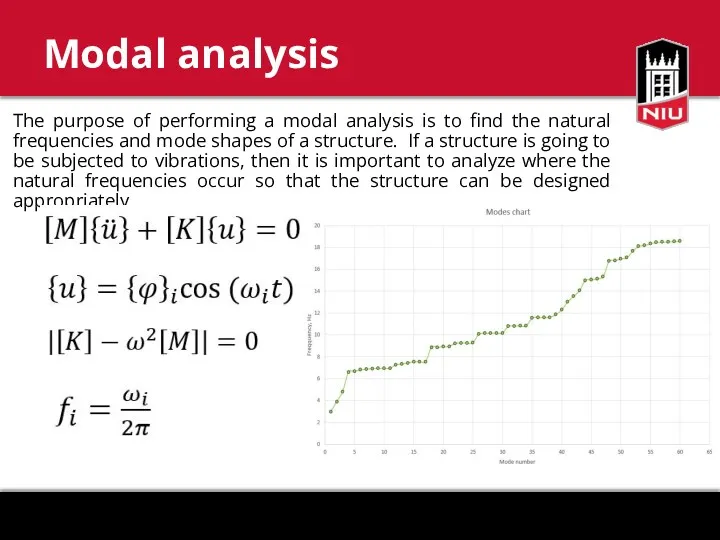
The purpose of performing a modal analysis is to find the
The purpose of performing a modal analysis is to find the
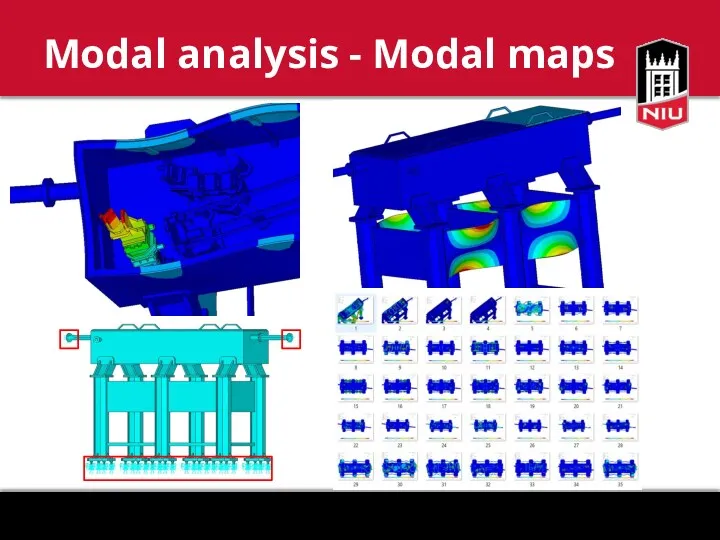
Modal analysis - Modal maps
Modal analysis - Modal maps
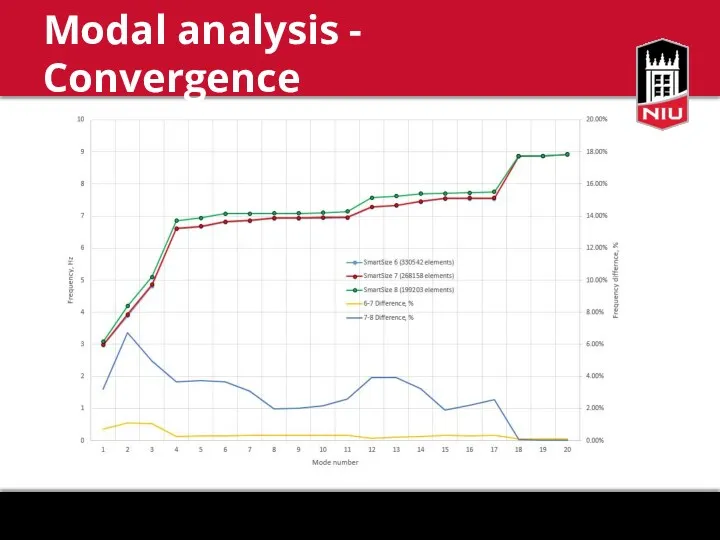
Modal analysis - Convergence
Modal analysis - Convergence
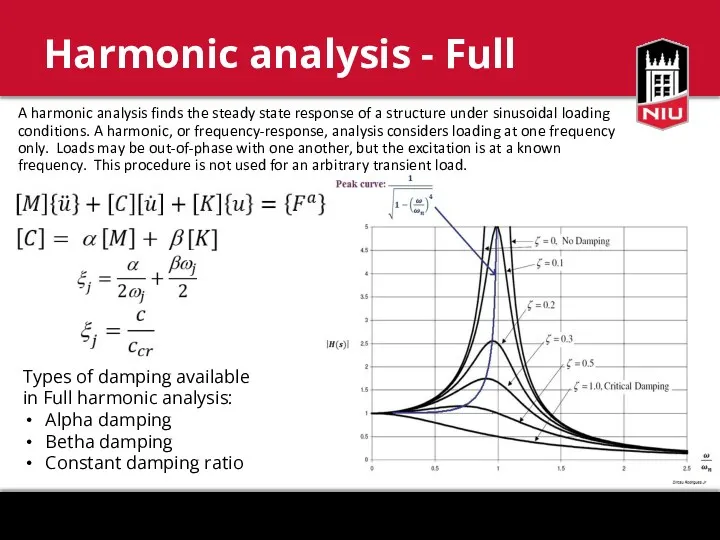
A harmonic analysis finds the steady state response of a structure
A harmonic analysis finds the steady state response of a structure
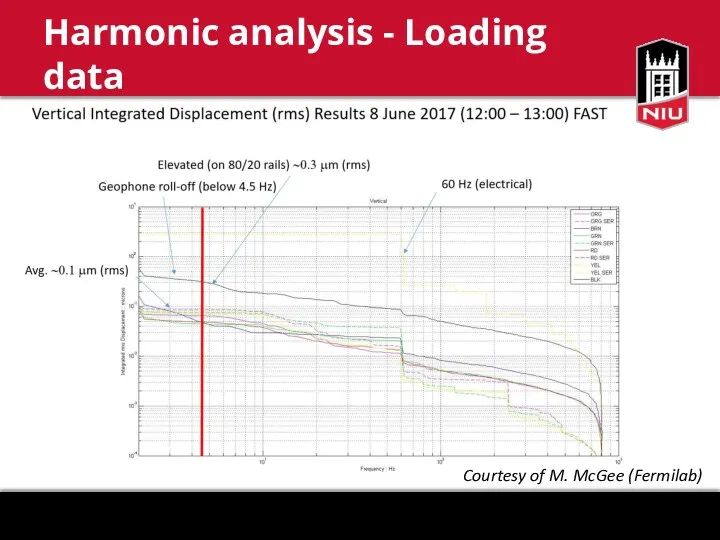
Harmonic analysis - Loading data
Courtesy of M. McGee (Fermilab)
Harmonic analysis - Loading data
Courtesy of M. McGee (Fermilab)
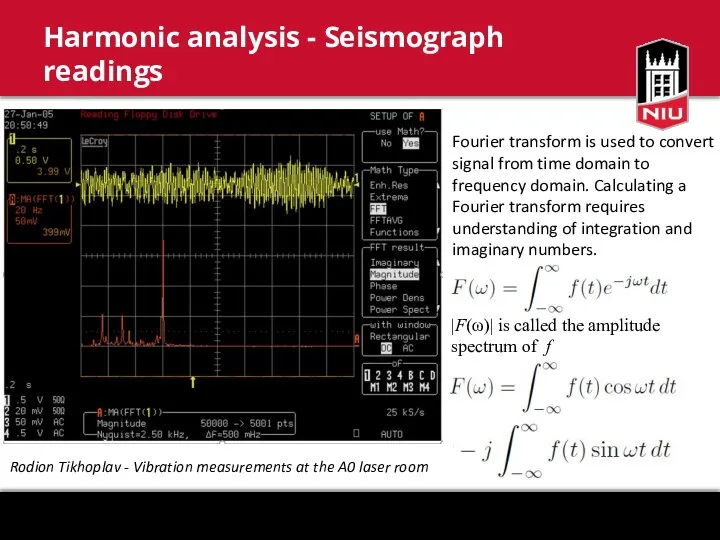
Harmonic analysis - Seismograph readings
|F(ω)| is called the amplitude spectrum
Harmonic analysis - Seismograph readings
|F(ω)| is called the amplitude spectrum
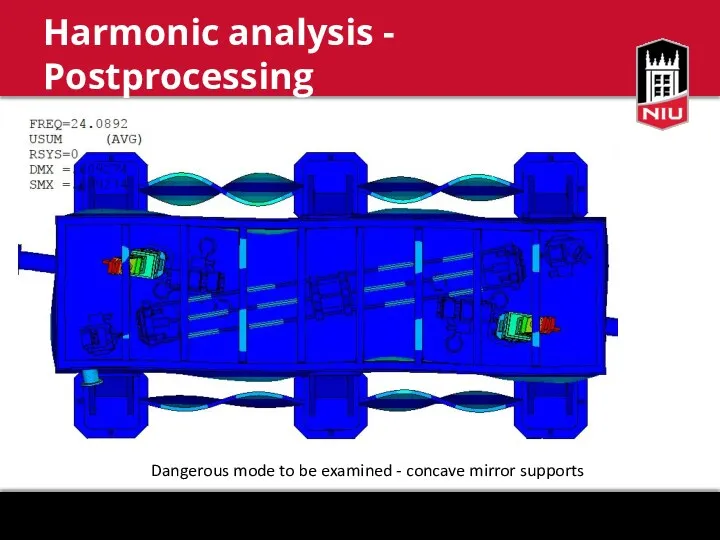
Harmonic analysis - Postprocessing
Dangerous mode to be examined - concave mirror
Harmonic analysis - Postprocessing
Dangerous mode to be examined - concave mirror
Harmonic analysis - Postprocessing
Tracking displacement of a single node over the
Harmonic analysis - Postprocessing
Tracking displacement of a single node over the
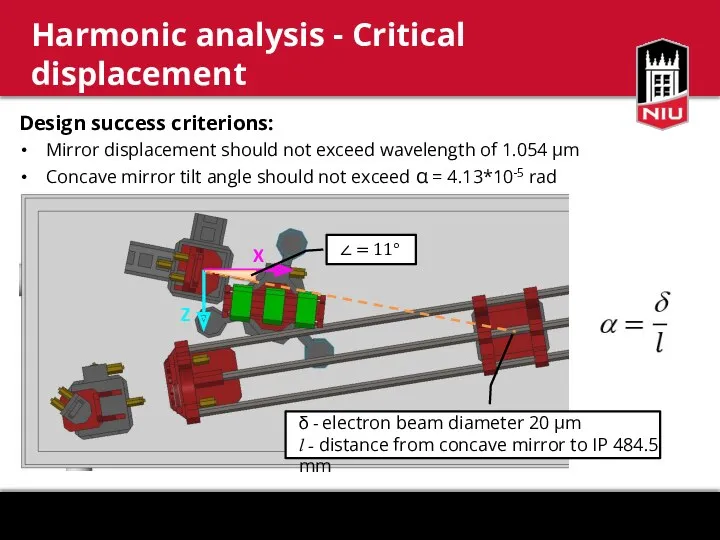
Harmonic analysis - Critical displacement
Design success criterions:
Mirror displacement should not
Harmonic analysis - Critical displacement
Design success criterions:
Mirror displacement should not
Harmonic analysis - Postprocessing
X direction
Z direction
Harmonic analysis - Postprocessing
X direction
Z direction
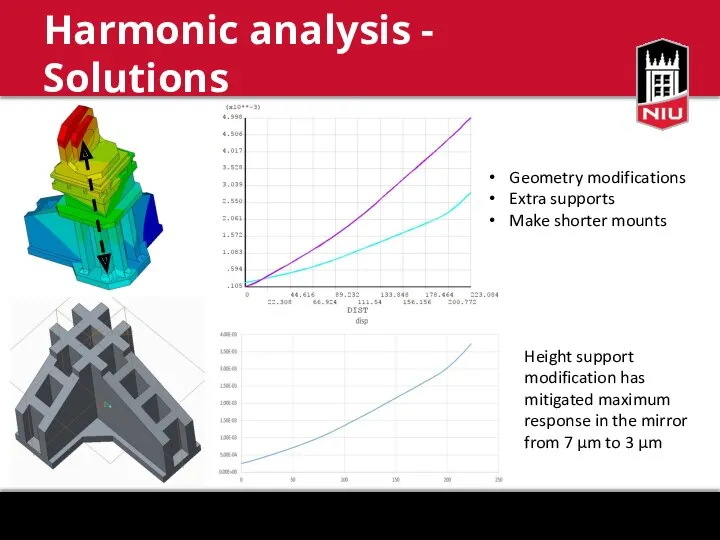
Harmonic analysis - Solutions
Geometry modifications
Extra supports
Make shorter mounts
Height support modification has
Harmonic analysis - Solutions
Geometry modifications
Extra supports
Make shorter mounts
Height support modification has
ICS is an exceptional method of generating γ radiation of high
ICS is an exceptional method of generating γ radiation of high
 Урок + презентация. Тема: Сила Ампера
 Изучение прецессии гироскопа
 Основы физики деления ядер
 Методи аналізу лінійних електронних кіл
 Газовые законы
 Интеллектуальная минутка по теме электродинамика
 Стандартная модель. Космогония современного мира
 Діелектрики та провідники в електростатичному полі
 Презентация 7 кл. Измерение атмосферного давления
 Тепловые и холодильные машины. Второе начало термодинамики
 Развитие наглядно – образного мышления у обучающихся с нарушениями зрения на уроках физики
 Шарль Огюстен де Кулон
 Закони динаміки. Перший закон Ньютона. Інерціальні системи відліку
 Теоретические основы электротехники
 Квантовая оптика. Тепловое излучение
 Физика – наука о природе
 Равномерное и неравномерное прямолинейное движение
 Влажность воздуха
 Шкала электромагнитных излучений
 Портфолио учителя физики Бушмакиной Е. С.
 Центр тяжести. Равновесие тел
 Сила тяжести. Движение в поле силы тяжести
 Разрушение материалов
 Магнитные свойства вещества
 Оптимальная оценка неэнергетического параметра сигнала. Тема 4: часть 2
 Electrical potentials of the cell
 Дифракция света. Лекция 3
 Теория атома водорода по Бору. Элементы квантовой механики