- Enso: recent evolution, current status and predictions

Содержание
- 2. Outline Summary Recent Evolution and Current Conditions Oceanic Niño Index (ONI) Pacific SST Outlook U.S. Seasonal
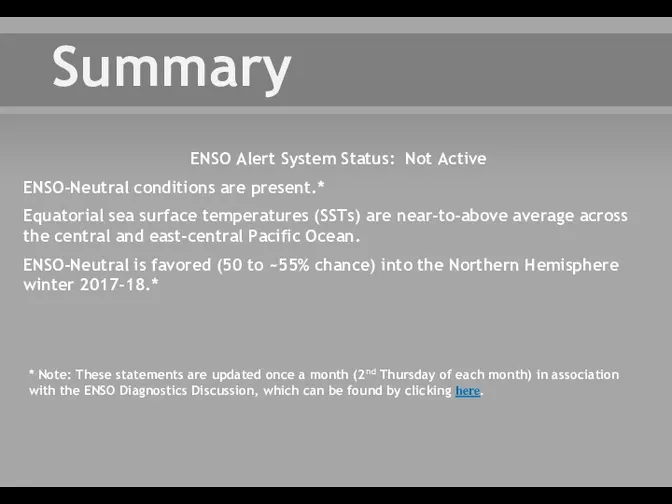
- 3. Summary * Note: These statements are updated once a month (2nd Thursday of each month) in
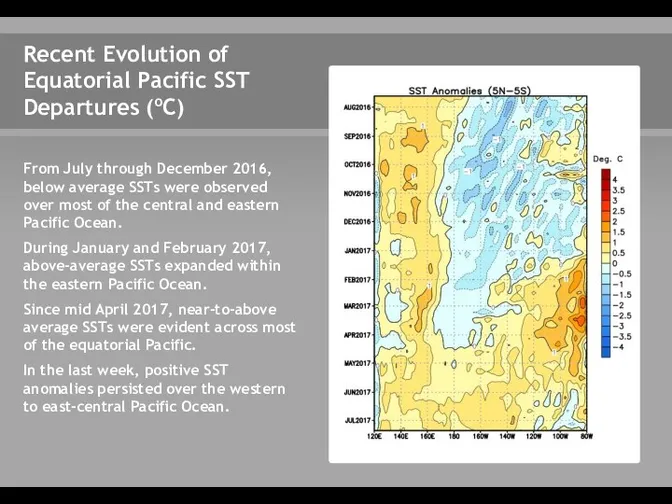
- 4. From July through December 2016, below average SSTs were observed over most of the central and
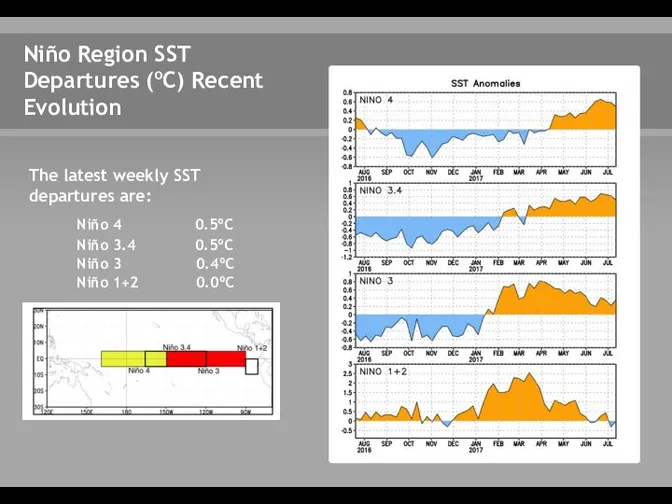
- 5. Niño Region SST Departures (oC) Recent Evolution The latest weekly SST departures are:
- 6. SST Departures (oC) in the Tropical Pacific During the Last Four Weeks During the last four
- 7. Global SST Departures (oC) During the Last Four Weeks During the last four weeks, equatorial SSTs
- 8. Weekly SST Departures during the Last Four Weeks During the last four weeks, above-average SSTs have
- 9. Change in Weekly SST Departures over the Last Four Weeks During the last four weeks, small
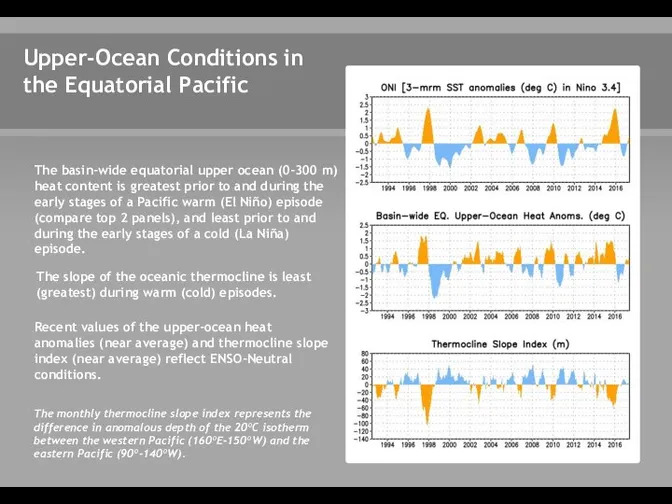
- 10. Upper-Ocean Conditions in the Equatorial Pacific The basin-wide equatorial upper ocean (0-300 m) heat content is
- 11. Central and Eastern Pacific Upper-Ocean (0-300 m) Weekly Average Temperature Anomalies Negative subsurface temperature anomalies were
- 12. Sub-Surface Temperature Departures in the Equatorial Pacific Most recent pentad analysis Positive anomalies continue to persist
- 13. Tropical OLR and Wind Anomalies During the Last 30 Days Negative OLR anomalies (enhanced convection and
- 14. Intraseasonal Variability Intraseasonal variability in the atmosphere (wind and pressure), which is often related to the
- 15. Weekly Heat Content Evolution in the Equatorial Pacific Equatorial oceanic Kelvin waves have alternating warm and
- 16. Low-level (850-hPa) Zonal (east-west) Wind Anomalies (m s-1) From mid September 2016 to mid April 2017,
- 17. Upper-level (200-hPa) Velocity Potential Anomalies Unfavorable for precipitation (brown shading) Favorable for precipitation (green shading) Note:
- 18. Outgoing Longwave Radiation (OLR) Anomalies Drier-than-average Conditions (orange/red shading) Wetter-than-average Conditions (blue shading) From early September
- 19. Oceanic Niño Index (ONI) The ONI is based on SST departures from average in the Niño
- 20. NOAA Operational Definitions for El Niño and La Niña El Niño: characterized by a positive ONI
- 21. ONI (ºC): Evolution since 1950 The most recent ONI value (April – June 2017) is 0.5ºC.
- 22. Historical El Niño and La Niña Episodes Based on the ONI computed using ERSST.v4 Recent Pacific
- 23. CPC/IRI Probabilistic ENSO Outlook Updated: 13 July 2017 ENSO-Neutral is favored (50 to ~55% chance) into
- 24. IRI/CPC Pacific Niño 3.4 SST Model Outlook Figure provided by the International Research Institute (IRI) for
- 25. SST Outlook: NCEP CFS.v2 Forecast (PDF corrected) Issued: 17 July 2017 The CFS.v2 ensemble mean (black
- 26. Atmospheric anomalies over the North Pacific and North America During the Last 60 Days 1 of
- 27. 2 of 3 Atmospheric anomalies over the North Pacific and North America During the Last 60
- 28. 3 of 3 Atmospheric anomalies over the North Pacific and North America During the Last 60
- 29. U.S. Temperature and Precipitation Departures During the Last 30 Days End Date: 15 July 2017 Percent
- 30. U.S. Temperature and Precipitation Departures During the Last 90 Days Percent of Average Precipitation Temperature Departures
- 31. U. S. Seasonal Outlooks Precipitation Temperature July – September 2017 The seasonal outlooks combine the effects
- 33. Скачать презентацию
Outline
Summary
Recent Evolution and Current Conditions
Oceanic Niño Index (ONI)
Pacific SST Outlook
U.S.
Outline
Summary
Recent Evolution and Current Conditions
Oceanic Niño Index (ONI)
Pacific SST Outlook
U.S.
Summary
* Note: These statements are updated once a month (2nd Thursday
Summary
* Note: These statements are updated once a month (2nd Thursday
From July through December 2016, below average SSTs were observed over
From July through December 2016, below average SSTs were observed over
Niño Region SST Departures (oC) Recent Evolution
The latest weekly SST departures
Niño Region SST Departures (oC) Recent Evolution
The latest weekly SST departures
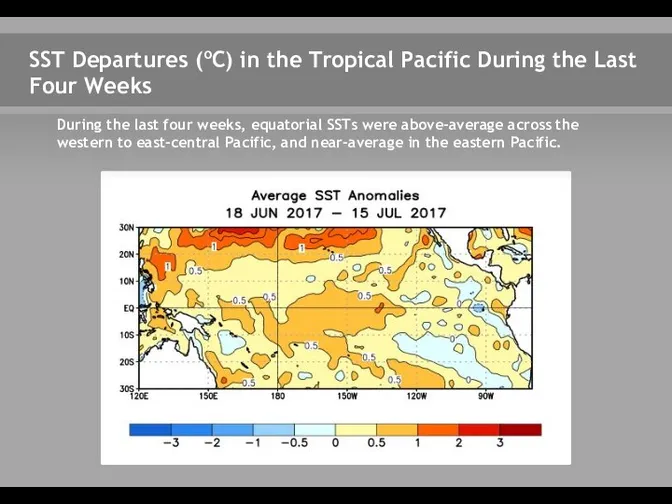
SST Departures (oC) in the Tropical Pacific During the Last Four
SST Departures (oC) in the Tropical Pacific During the Last Four
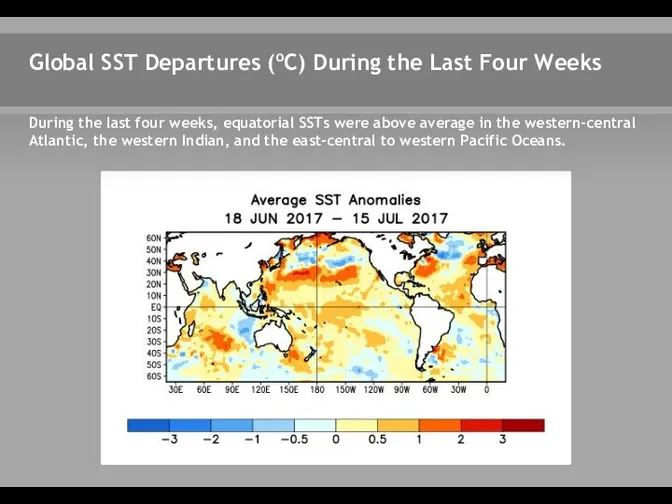
Global SST Departures (oC) During the Last Four Weeks
During the last
Global SST Departures (oC) During the Last Four Weeks
During the last
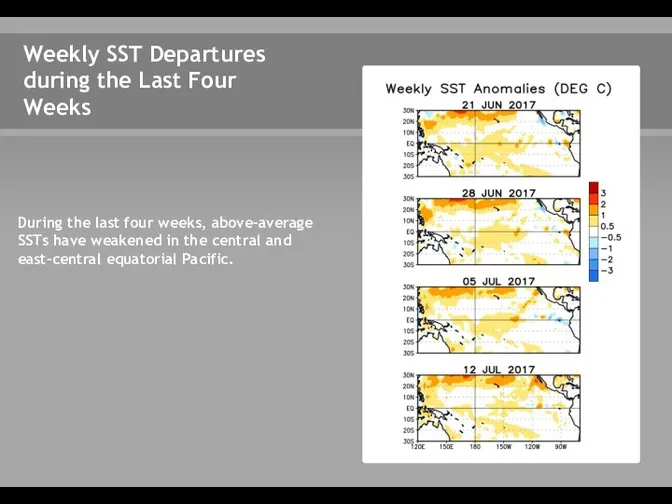
Weekly SST Departures during the Last Four Weeks
During the last four
Weekly SST Departures during the Last Four Weeks
During the last four
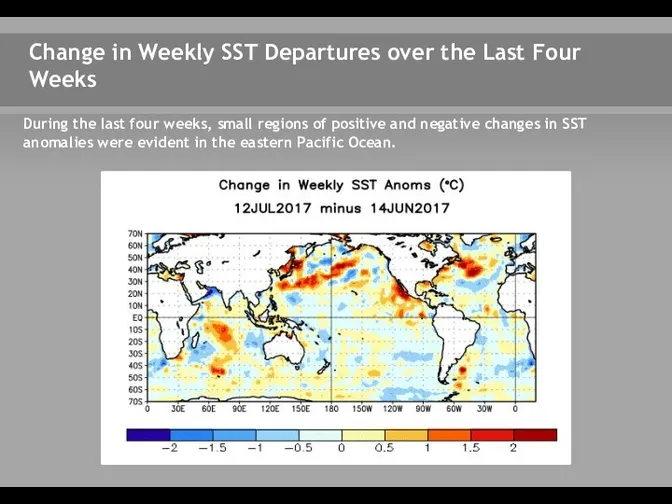
Change in Weekly SST Departures over the Last Four Weeks
During the
Change in Weekly SST Departures over the Last Four Weeks
During the
Upper-Ocean Conditions in the Equatorial Pacific
The basin-wide equatorial upper ocean (0-300
Upper-Ocean Conditions in the Equatorial Pacific
The basin-wide equatorial upper ocean (0-300
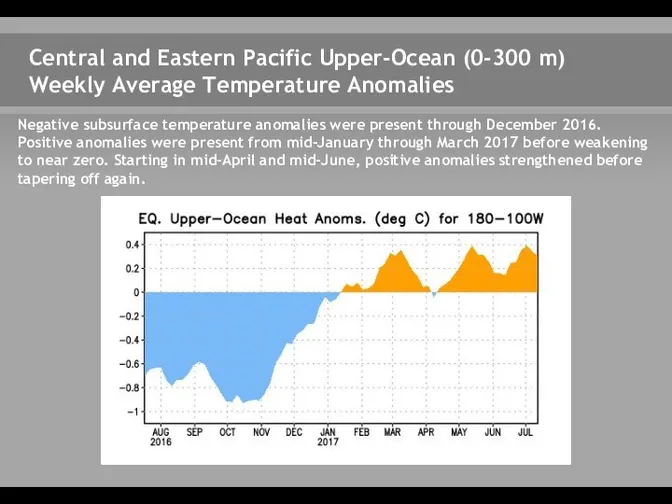
Central and Eastern Pacific Upper-Ocean (0-300 m)
Weekly Average Temperature Anomalies
Negative subsurface
Central and Eastern Pacific Upper-Ocean (0-300 m)
Weekly Average Temperature Anomalies
Negative subsurface
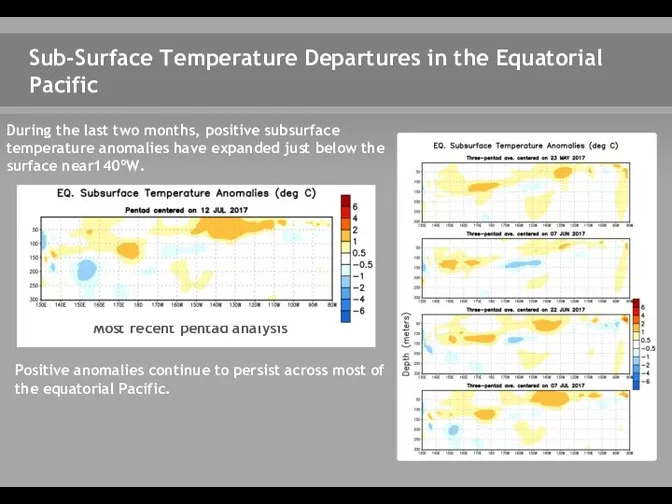
Sub-Surface Temperature Departures in the Equatorial Pacific
Most recent pentad analysis
Positive anomalies
Sub-Surface Temperature Departures in the Equatorial Pacific
Most recent pentad analysis
Positive anomalies
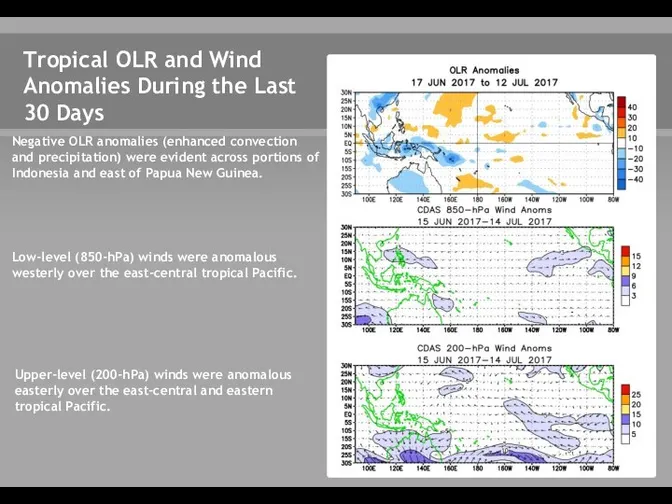
Tropical OLR and Wind Anomalies During the Last 30 Days
Negative OLR
Tropical OLR and Wind Anomalies During the Last 30 Days
Negative OLR
Intraseasonal Variability
Intraseasonal variability in the atmosphere (wind and pressure), which is
Intraseasonal Variability
Intraseasonal variability in the atmosphere (wind and pressure), which is
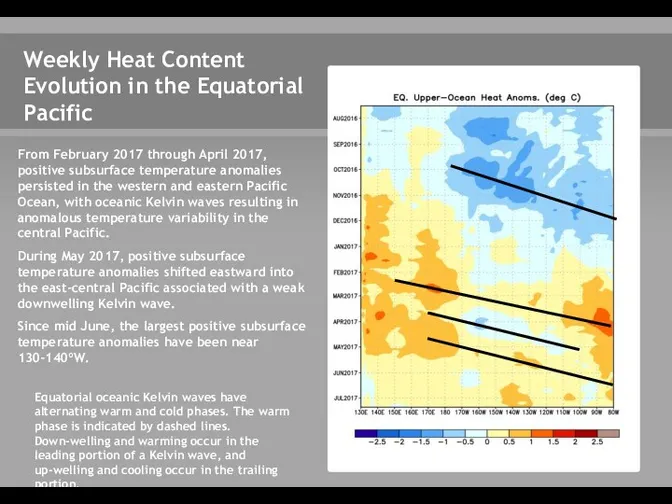
Weekly Heat Content Evolution in the Equatorial Pacific
Equatorial oceanic Kelvin waves
Weekly Heat Content Evolution in the Equatorial Pacific
Equatorial oceanic Kelvin waves
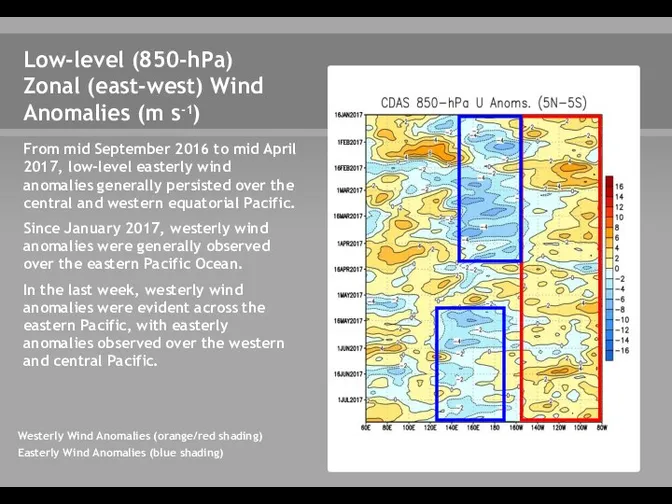
Low-level (850-hPa)
Zonal (east-west) Wind Anomalies (m s-1)
From mid September 2016
Low-level (850-hPa)
Zonal (east-west) Wind Anomalies (m s-1)
From mid September 2016
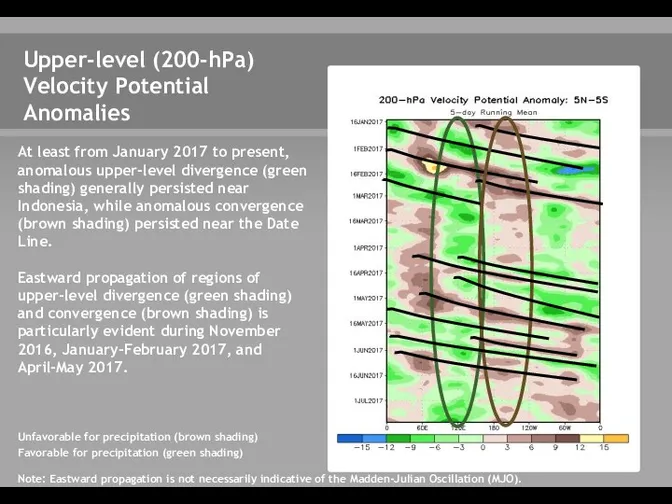
Upper-level (200-hPa) Velocity Potential Anomalies
Unfavorable for precipitation (brown shading)
Favorable for precipitation
Upper-level (200-hPa) Velocity Potential Anomalies
Unfavorable for precipitation (brown shading)
Favorable for precipitation
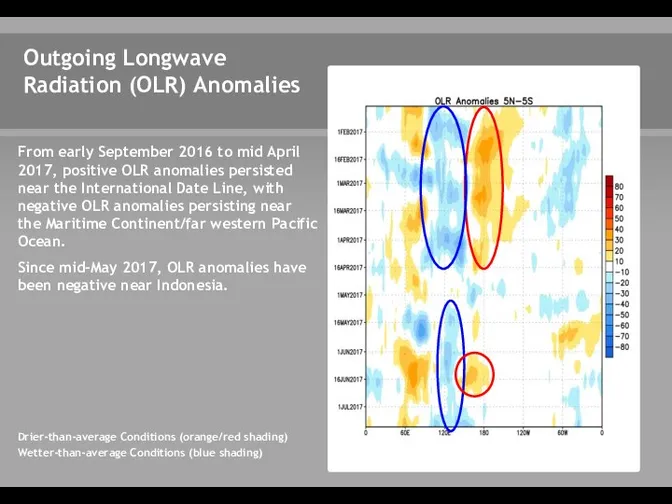
Outgoing Longwave Radiation (OLR) Anomalies
Drier-than-average Conditions (orange/red shading)
Wetter-than-average Conditions (blue shading)
From
Outgoing Longwave Radiation (OLR) Anomalies
Drier-than-average Conditions (orange/red shading)
Wetter-than-average Conditions (blue shading)
From
Oceanic Niño Index (ONI)
The ONI is based on SST departures from
Oceanic Niño Index (ONI)
The ONI is based on SST departures from
NOAA Operational Definitions for El Niño and La Niña
El Niño: characterized
NOAA Operational Definitions for El Niño and La Niña
El Niño: characterized
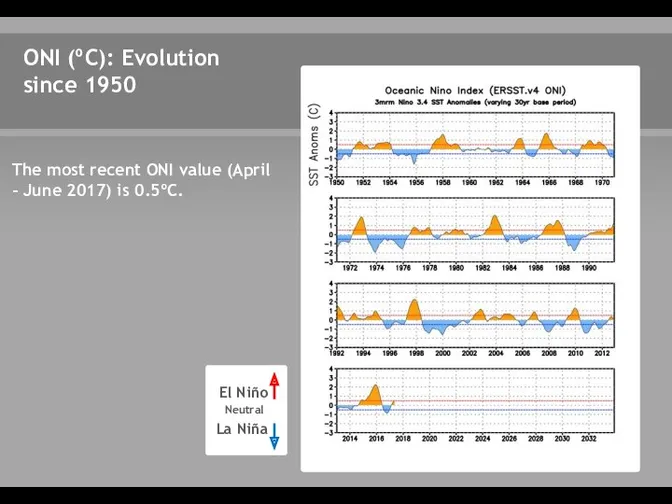
ONI (ºC): Evolution
since 1950
The most recent ONI value (April –
ONI (ºC): Evolution
since 1950
The most recent ONI value (April –
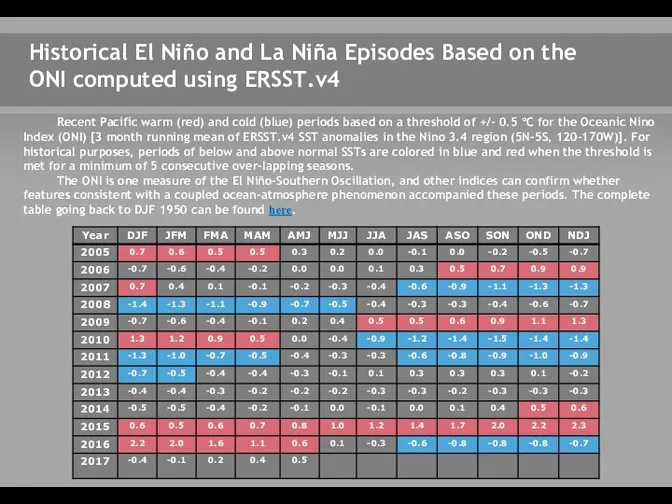
Historical El Niño and La Niña Episodes Based on the ONI
Historical El Niño and La Niña Episodes Based on the ONI
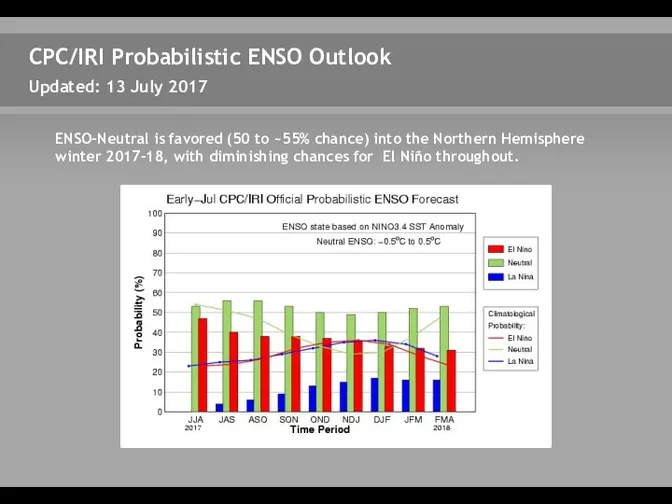
CPC/IRI Probabilistic ENSO Outlook
Updated: 13 July 2017
ENSO-Neutral is favored (50 to
CPC/IRI Probabilistic ENSO Outlook
Updated: 13 July 2017
ENSO-Neutral is favored (50 to
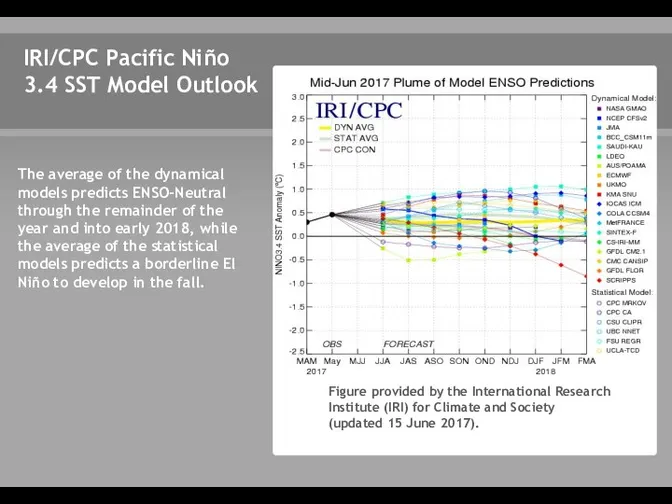
IRI/CPC Pacific Niño 3.4 SST Model Outlook
Figure provided by the International
IRI/CPC Pacific Niño 3.4 SST Model Outlook
Figure provided by the International
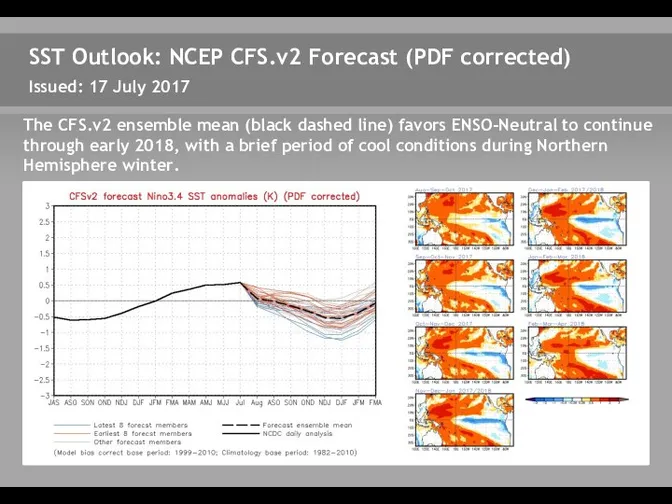
SST Outlook: NCEP CFS.v2 Forecast (PDF corrected)
Issued: 17 July 2017
The
SST Outlook: NCEP CFS.v2 Forecast (PDF corrected)
Issued: 17 July 2017
The
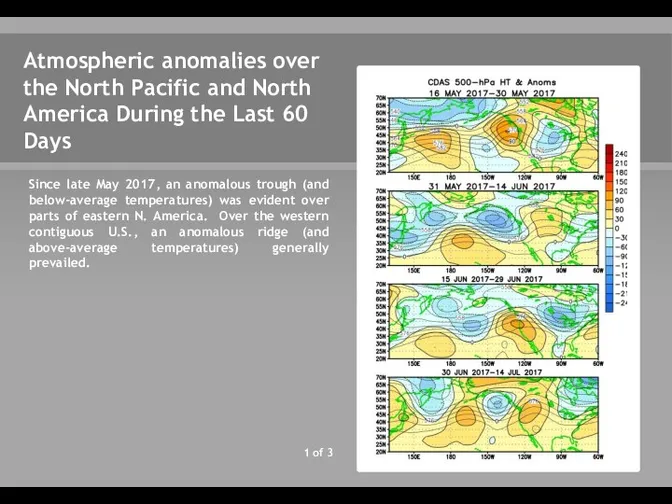
Atmospheric anomalies over the North Pacific and North America During the
Atmospheric anomalies over the North Pacific and North America During the
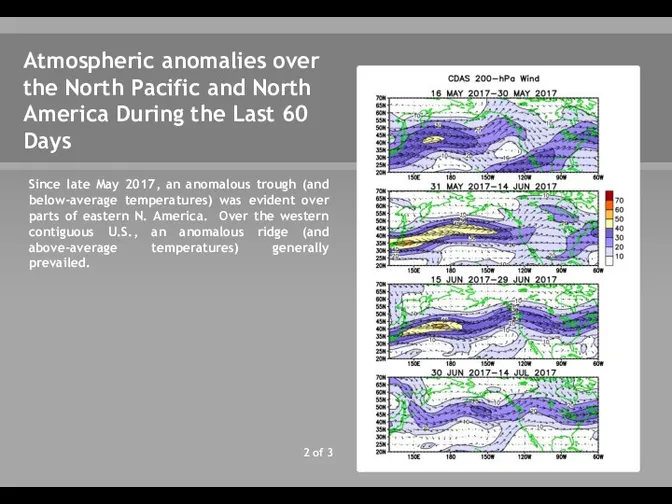
2 of 3
Atmospheric anomalies over the North Pacific and North America
2 of 3
Atmospheric anomalies over the North Pacific and North America
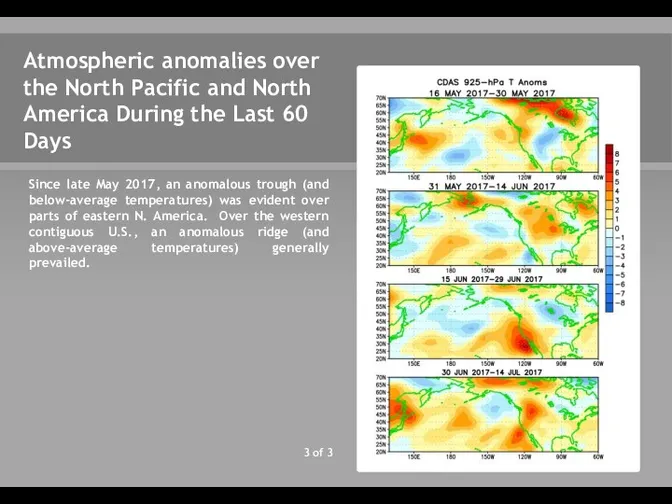
3 of 3
Atmospheric anomalies over the North Pacific and North America
3 of 3
Atmospheric anomalies over the North Pacific and North America
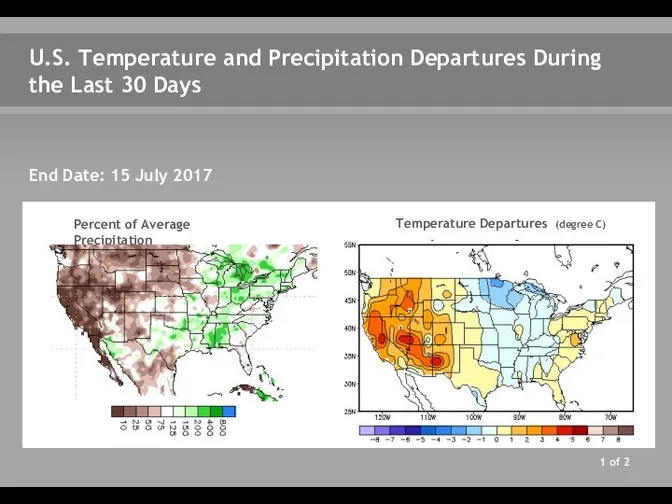
U.S. Temperature and Precipitation Departures During the Last 30 Days
End Date:
U.S. Temperature and Precipitation Departures During the Last 30 Days
End Date:
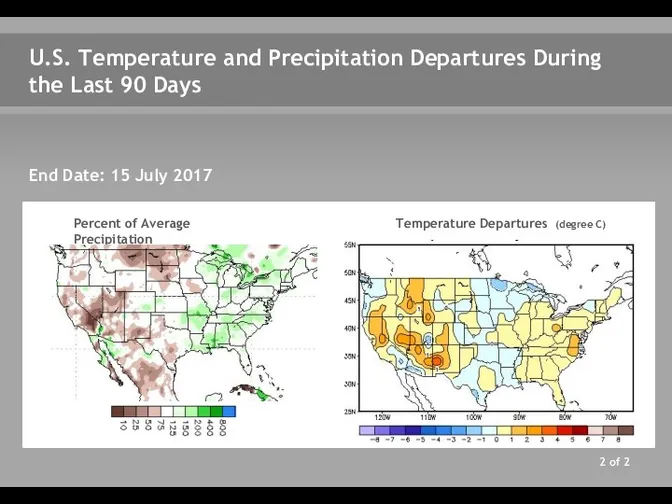
U.S. Temperature and Precipitation Departures During the Last 90 Days
Percent of
U.S. Temperature and Precipitation Departures During the Last 90 Days
Percent of
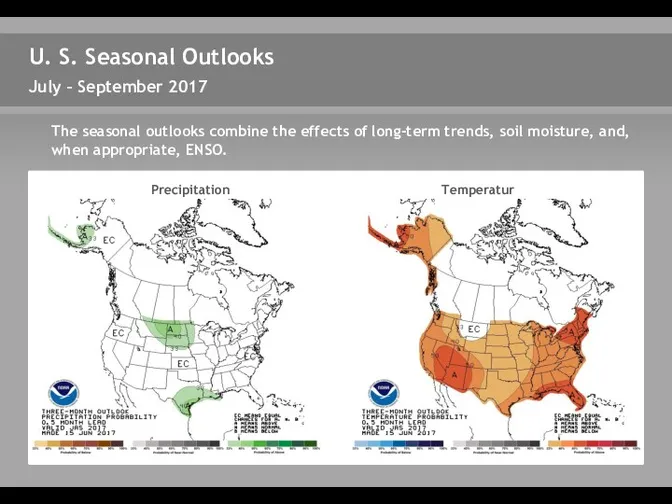
U. S. Seasonal Outlooks
Precipitation
Temperature
July – September 2017
The seasonal outlooks combine the
U. S. Seasonal Outlooks
Precipitation
Temperature
July – September 2017
The seasonal outlooks combine the
 Ориентирование на местности
 Топонимика Курской области
 6 дней в Карелии. Тур для студентов
 Интерактивная мозаика Великобритании
 Мальдив аралдары
 Штат Огайо, розташований у північно-східній частині США
 Периоды развития знаний о почве
 Галифакс. Прошлое и настоящее
 Як вітер впливає на природу Землі
 Элементы гидрогеологии
 Озеро Балхаш
 Классификация вин Франции. Эльзас
 Хемогенные и органогенные породы
 Этнический туризм
 Йеллоустонский национальный парк
 Путешествие по городу Изобильный Ставропольский край
 Прогноз погоды по народным приметам
 Қош келдіңіздер Шымкент
 Водные ресурсы Франции
 GeoEye-1, WorldView-4. Космическая и аэрофотосъемка
 Компас
 Візитна картка Канади
 Навигационные знаки на внутренних водных путях
 Водные балансы речных бассейнов
 Реки бассейна Енисея
 Н.Н. Миклухо-Маклай, русский путешественник
 Озера, болота, подземные воды, ледники, многолетняя мерзлота
 Земная кора – верхняя часть литосферы