- Geographical investigations – student guide: extreme weather

Содержание
- 2. Overview Requirements of the specification What is extreme weather? Investigating extreme weather Ideas for fieldwork Research
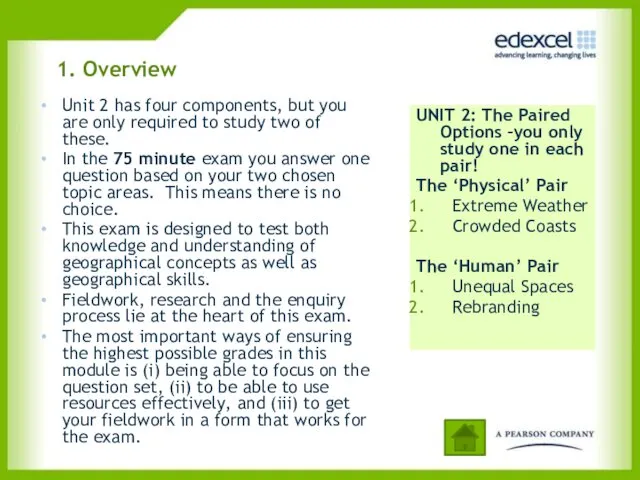
- 3. 1. Overview Unit 2 has four components, but you are only required to study two of
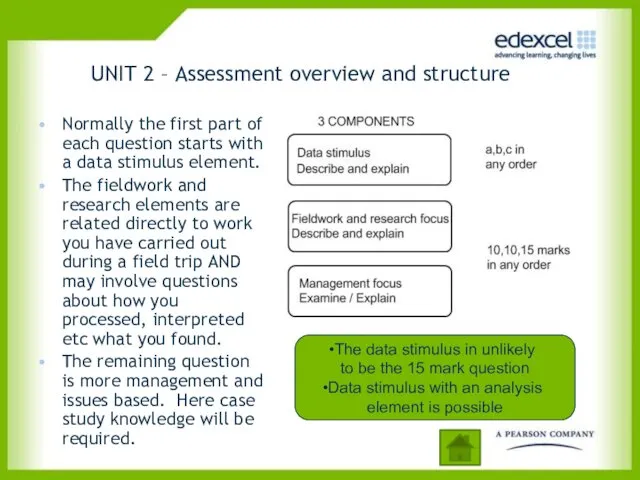
- 4. UNIT 2 – Assessment overview and structure Normally the first part of each question starts with
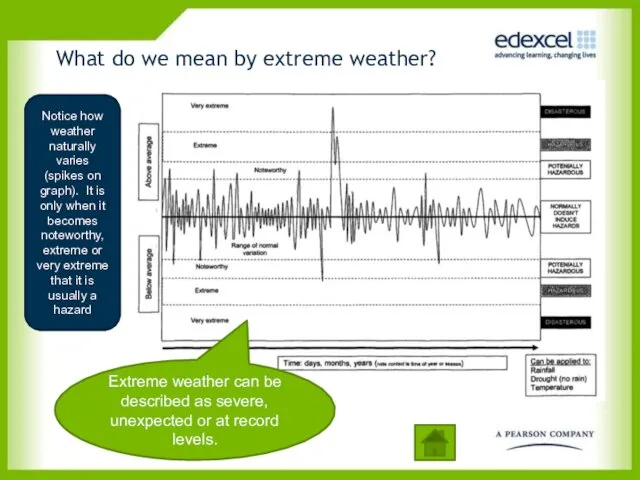
- 5. What do we mean by extreme weather? Extreme weather can be described as severe, unexpected or
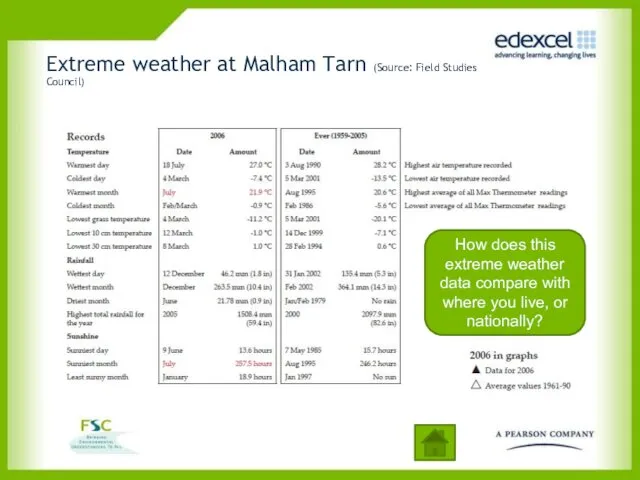
- 6. Extreme weather at Malham Tarn (Source: Field Studies Council) How does this extreme weather data compare
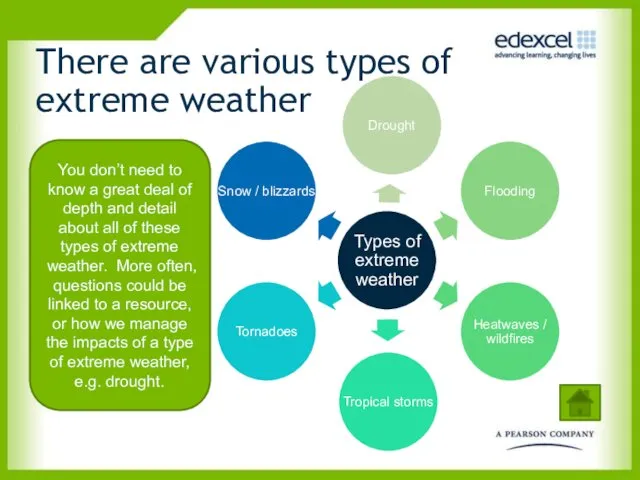
- 7. There are various types of extreme weather You don’t need to know a great deal of
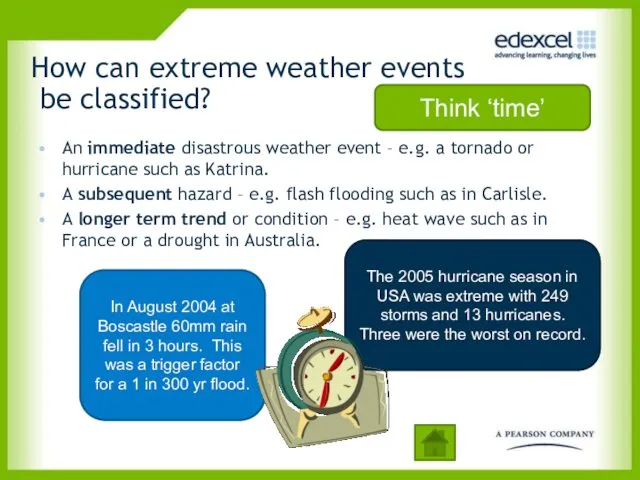
- 8. How can extreme weather events be classified? An immediate disastrous weather event – e.g. a tornado
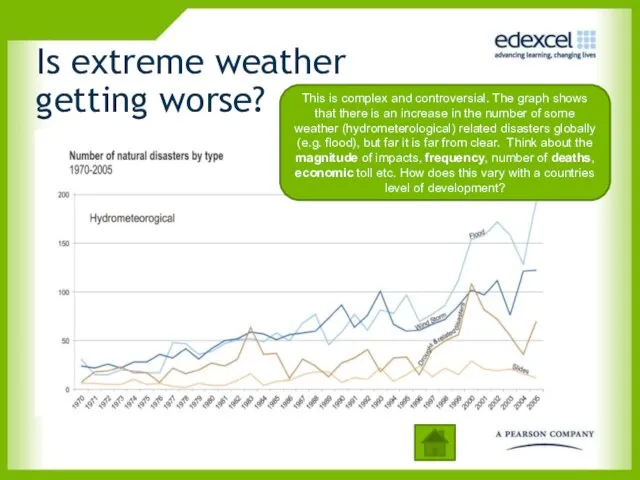
- 9. Is extreme weather getting worse? This is complex and controversial. The graph shows that there is
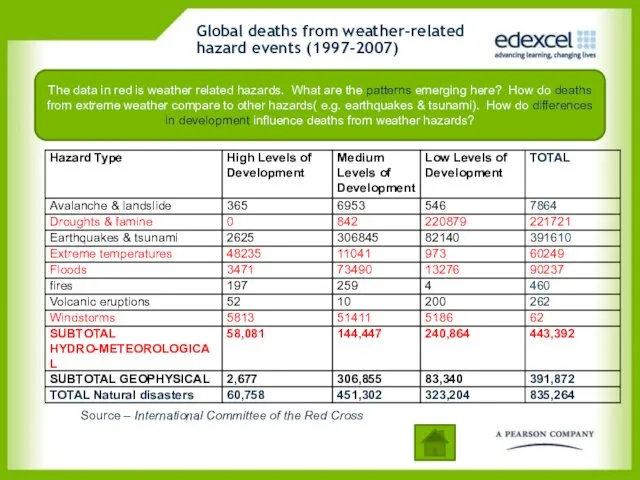
- 10. Global deaths from weather-related hazard events (1997-2007) The data in red is weather related hazards. What
- 11. Warm front - when a warm moist air mass rises above a cold air mass, a
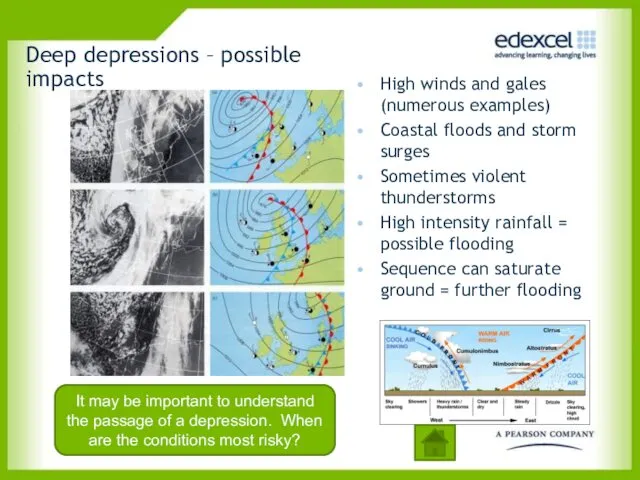
- 12. Deep depressions – possible impacts High winds and gales (numerous examples) Coastal floods and storm surges
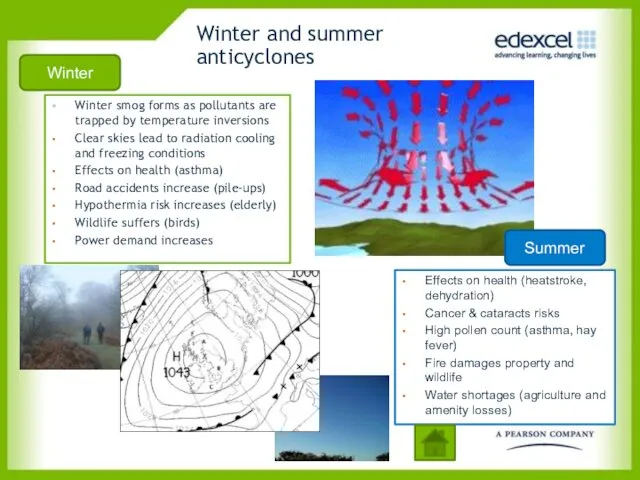
- 13. Winter and summer anticyclones Winter smog forms as pollutants are trapped by temperature inversions Clear skies
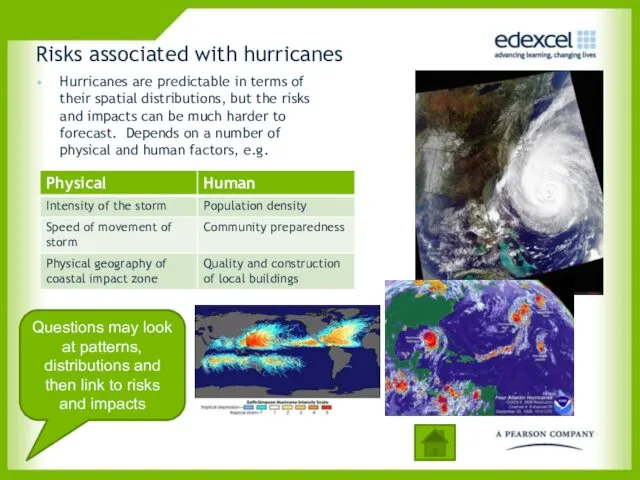
- 14. Risks associated with hurricanes Hurricanes are predictable in terms of their spatial distributions, but the risks
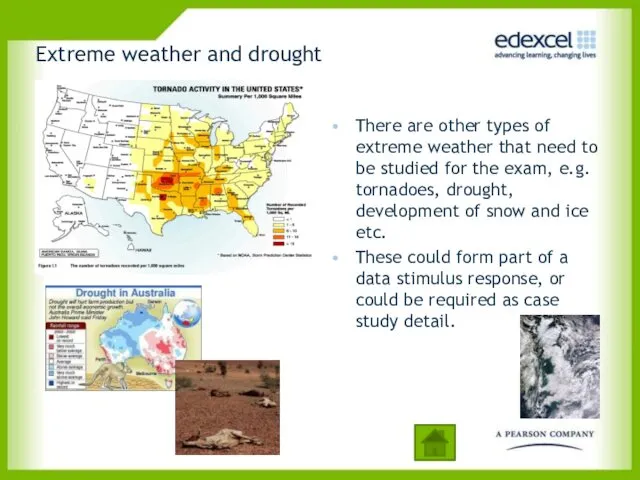
- 15. There are other types of extreme weather that need to be studied for the exam, e.g.
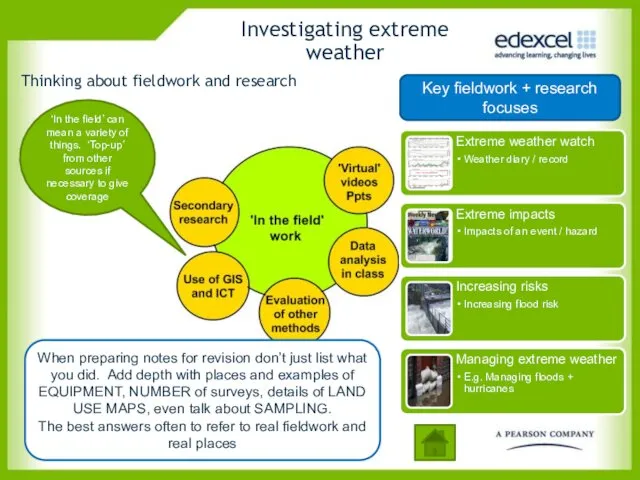
- 16. Thinking about fieldwork and research When preparing notes for revision don’t just list what you did.
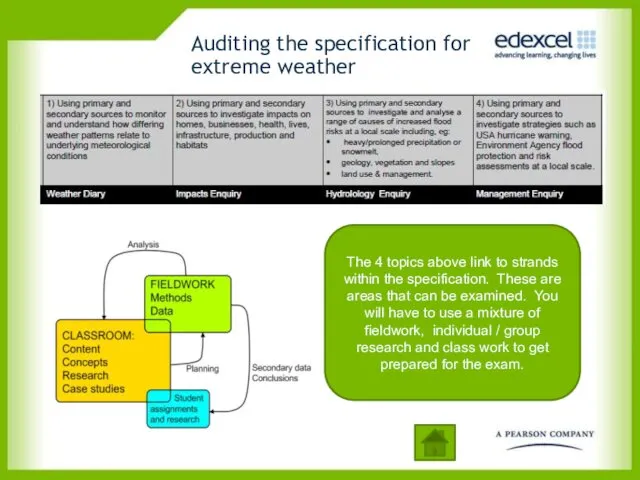
- 17. Auditing the specification for extreme weather The 4 topics above link to strands within the specification.
- 18. How show I go about a weather diary? Try and complete the weather diary over at
- 19. Recording the weather twice per day for a continuous period using some the following instruments (or
- 20. Investigating Flood impacts? Example questionnaire to look at flood impacts. A range of closed questions have
- 21. Flood impacts spreadsheet, interviews and research You may have to find out about flood ‘players’ also.
- 22. Dog biscuit– surface velocity Infiltration rates Flow Meter – Velocity at different depths Stop Watch –
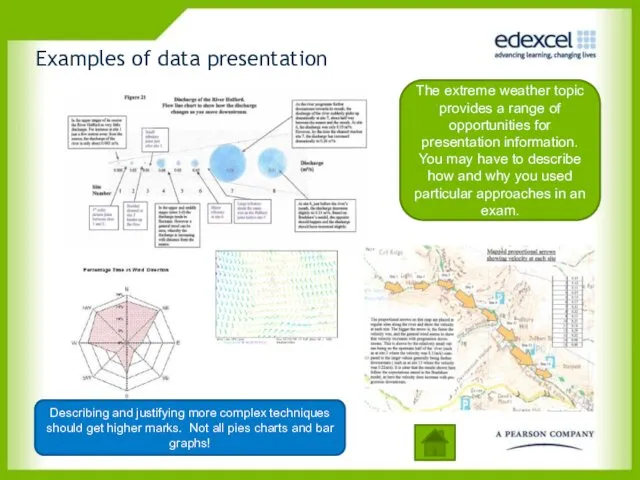
- 23. Examples of data presentation The extreme weather topic provides a range of opportunities for presentation information.
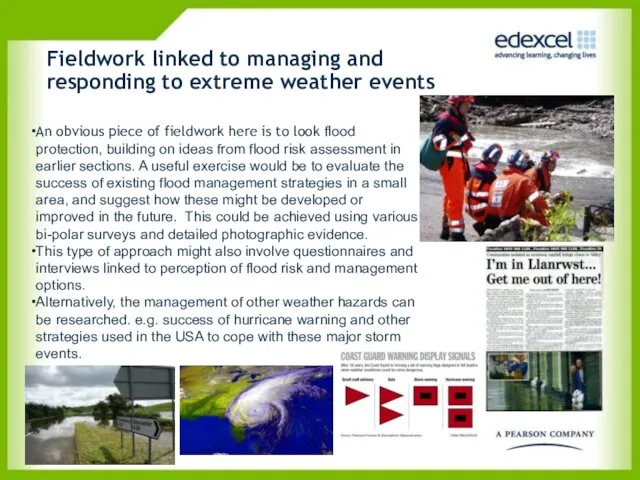
- 24. Fieldwork linked to managing and responding to extreme weather events An obvious piece of fieldwork here
- 25. Old photos and other documentary evidence (e.g. flood reports, specialist books) can help reveal the scale
- 26. Witness accounts and blogs The impacts of extreme weather flooding are often best document through online
- 27. Following-up the weather fieldwork?
- 29. Скачать презентацию
Overview
Requirements of the specification
What is extreme weather?
Investigating extreme weather
Ideas for fieldwork
Research
Overview
Requirements of the specification
What is extreme weather?
Investigating extreme weather
Ideas for fieldwork
Research
1. Overview
Unit 2 has four components, but you are only required
1. Overview
Unit 2 has four components, but you are only required
UNIT 2 – Assessment overview and structure
Normally the first part of
UNIT 2 – Assessment overview and structure
Normally the first part of
What do we mean by extreme weather?
Extreme weather can be described
What do we mean by extreme weather?
Extreme weather can be described
Extreme weather at Malham Tarn (Source: Field Studies Council)
How does this
Extreme weather at Malham Tarn (Source: Field Studies Council)
How does this
There are various types of extreme weather
You don’t need to know
There are various types of extreme weather
You don’t need to know
How can extreme weather events
be classified?
An immediate disastrous weather event
How can extreme weather events
be classified?
An immediate disastrous weather event
Is extreme weather getting worse?
This is complex and controversial. The graph
Is extreme weather getting worse?
This is complex and controversial. The graph
Global deaths from weather-related hazard events (1997-2007)
The data in red is
Global deaths from weather-related hazard events (1997-2007)
The data in red is
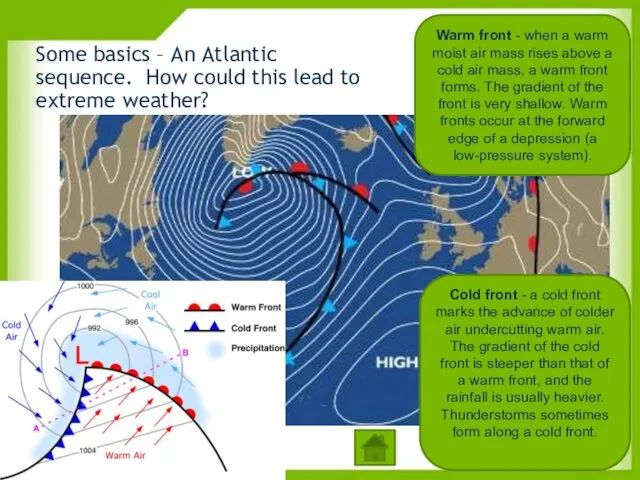
Warm front - when a warm moist air mass rises above
Warm front - when a warm moist air mass rises above
Deep depressions – possible impacts
High winds and gales (numerous examples)
Coastal floods
Deep depressions – possible impacts
High winds and gales (numerous examples)
Coastal floods
Winter and summer anticyclones
Winter smog forms as pollutants are trapped by
Winter and summer anticyclones
Winter smog forms as pollutants are trapped by
Risks associated with hurricanes
Hurricanes are predictable in terms of their spatial
Risks associated with hurricanes
Hurricanes are predictable in terms of their spatial
There are other types of extreme weather that need to be
There are other types of extreme weather that need to be
Thinking about fieldwork and research
When preparing notes for revision don’t just
Thinking about fieldwork and research
When preparing notes for revision don’t just
Auditing the specification for extreme weather
The 4 topics above link to
Auditing the specification for extreme weather
The 4 topics above link to
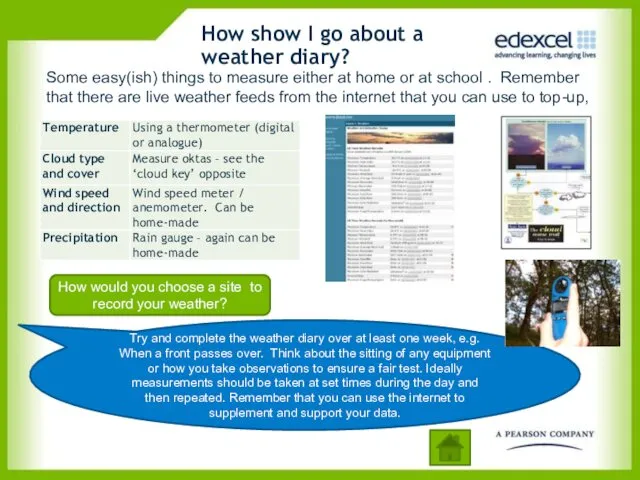
How show I go about a weather diary?
Try and complete the
How show I go about a weather diary?
Try and complete the
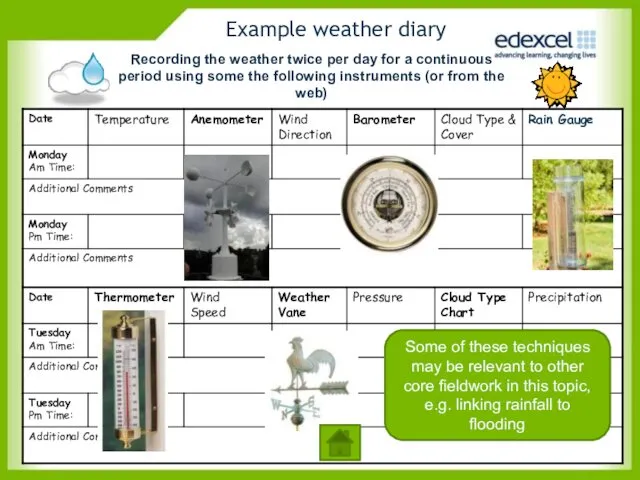
Recording the weather twice per day for a continuous period using
Recording the weather twice per day for a continuous period using
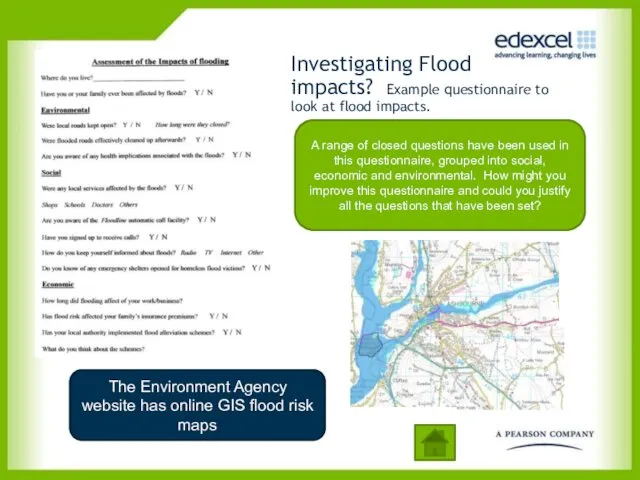
Investigating Flood impacts? Example questionnaire to look at flood impacts.
A range
Investigating Flood impacts? Example questionnaire to look at flood impacts.
A range
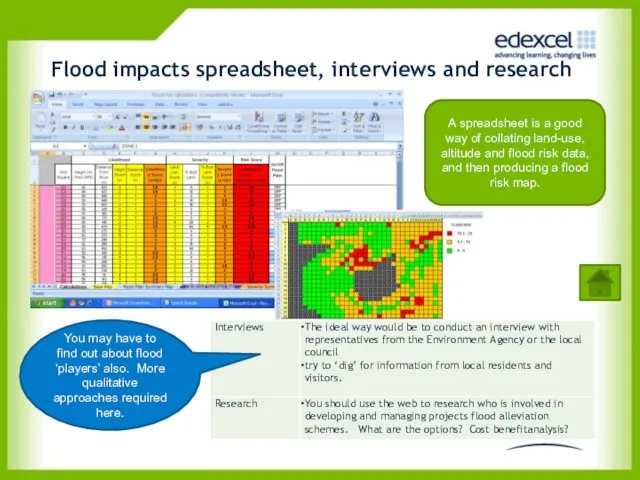
Flood impacts spreadsheet, interviews and research
You may have to find
Flood impacts spreadsheet, interviews and research
You may have to find
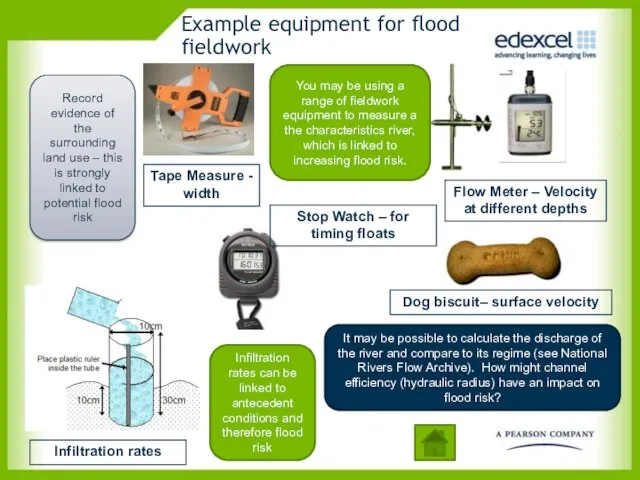
Dog biscuit– surface velocity
Infiltration rates
Flow Meter – Velocity at different depths
Stop
Dog biscuit– surface velocity
Infiltration rates
Flow Meter – Velocity at different depths
Stop
Examples of data presentation
The extreme weather topic provides a range of
Examples of data presentation
The extreme weather topic provides a range of
Fieldwork linked to managing and responding to extreme weather events
An obvious
Fieldwork linked to managing and responding to extreme weather events
An obvious
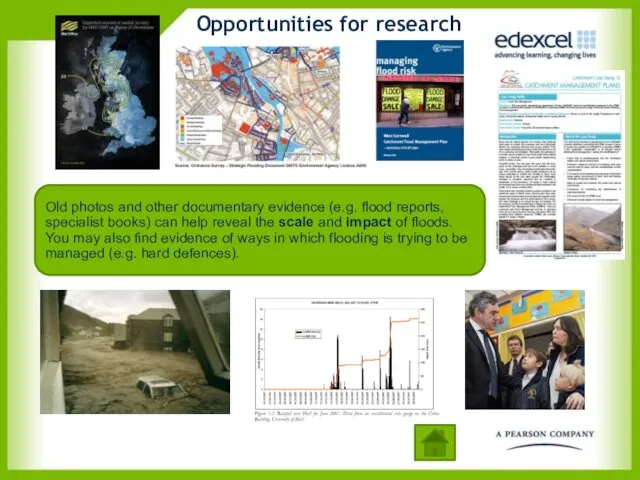
Old photos and other documentary evidence (e.g. flood reports, specialist books)
Old photos and other documentary evidence (e.g. flood reports, specialist books)
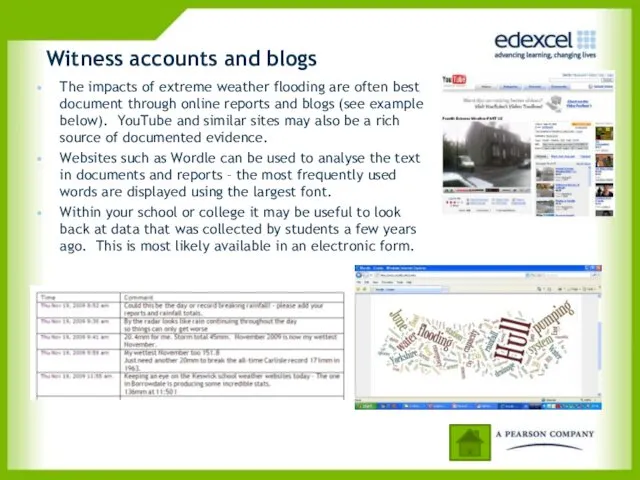
Witness accounts and blogs
The impacts of extreme weather flooding are often
Witness accounts and blogs
The impacts of extreme weather flooding are often
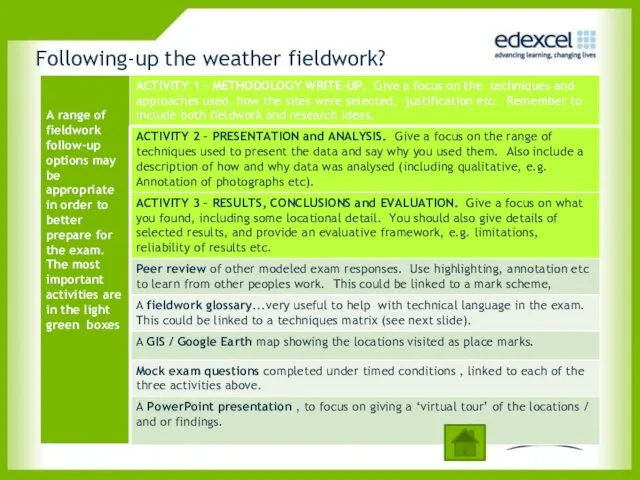
Following-up the weather fieldwork?
Following-up the weather fieldwork?
 Топырақтық-аудандық аудандастыру
 Континент Африка
 Великие географические открытия
 Африканские страны
 Молдова. Страна в Европе
 Восточная Сибирь
 Агропромышленный комплекс (АПК)
 Окружающая и географическая среда, природопользование
 Исследования глубин морей и океанов
 Самые удивительные места планеты
 Достопримечательности Барселоны. Дворец Гуэль
 Геофизические методы поисков и разведки нефтегазовых месторождений
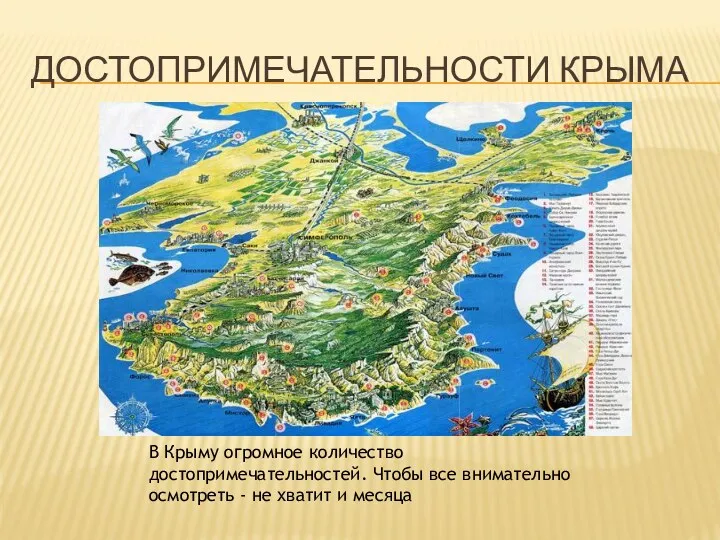 Достопримечательности Крыма
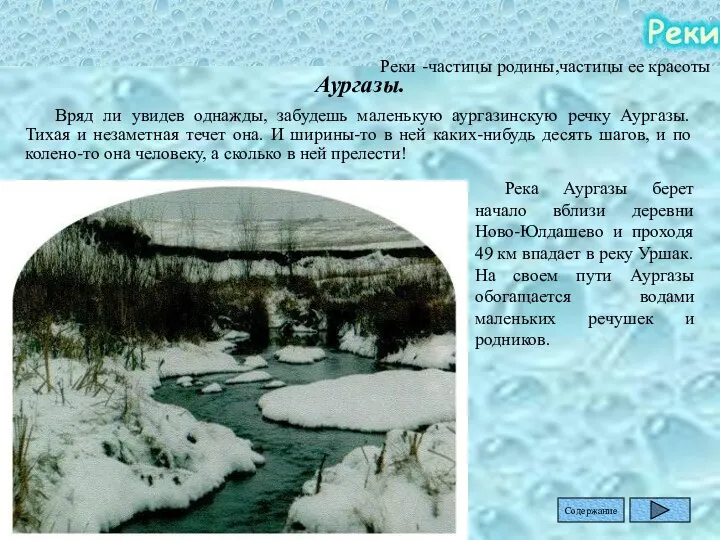 Реки и озера Башкирии
 Закономерности распределения тепла и влаги по территории России
 Рекреационные ресурсы мира
 Країна Німеччина
 Африка. Обобщающее повторение
 Поперечный масштаб
 Магматические породы. Тест
 Использование глобуса, карты, плана
 Логикалық есептер сайысы
 Геометризация залежей нефти и газа. Месторождения нефти и газа. Классификация месторождений. (Лекция 4)
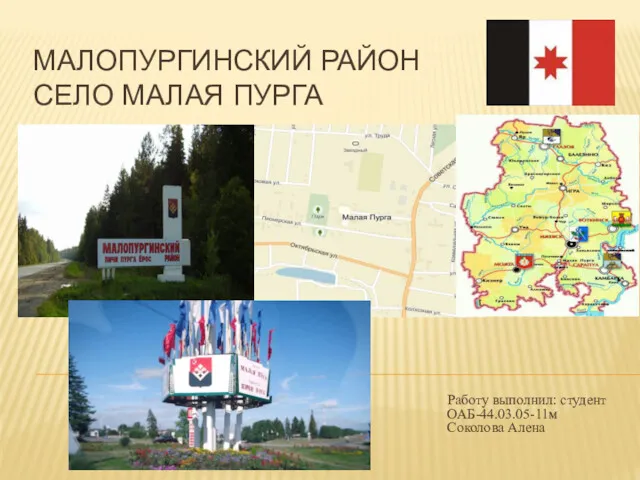 Малопургинский район. Село Малая Пурга
 Гидрологические расчеты. Расчет расходов воды ( Лекция 3)
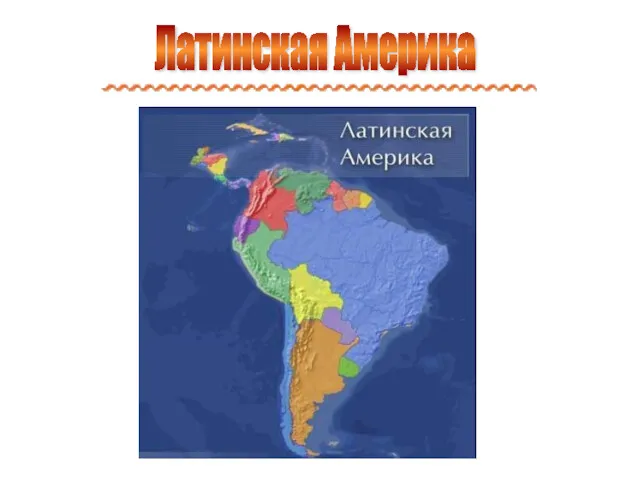 Латинская Америка. Страны Южной Америки
 Административное деление Московской области
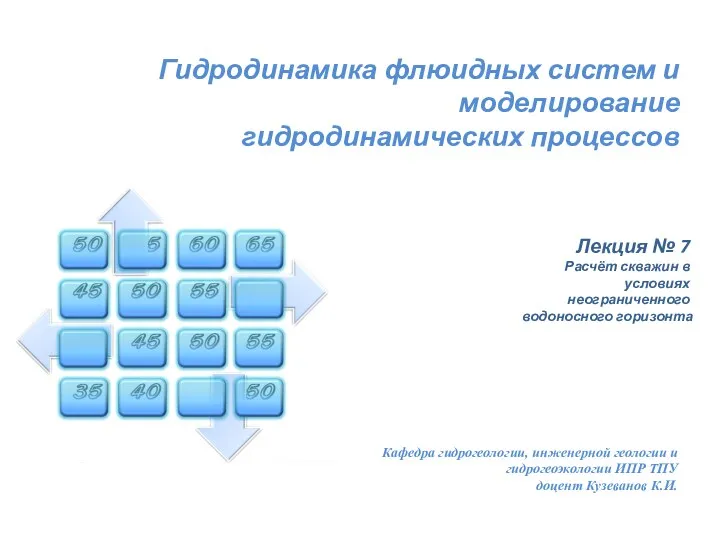 Расчёт скважин в условиях неограниченного водоносного горизонта. Лекция № 7