- History of Earth’s Climate

Содержание
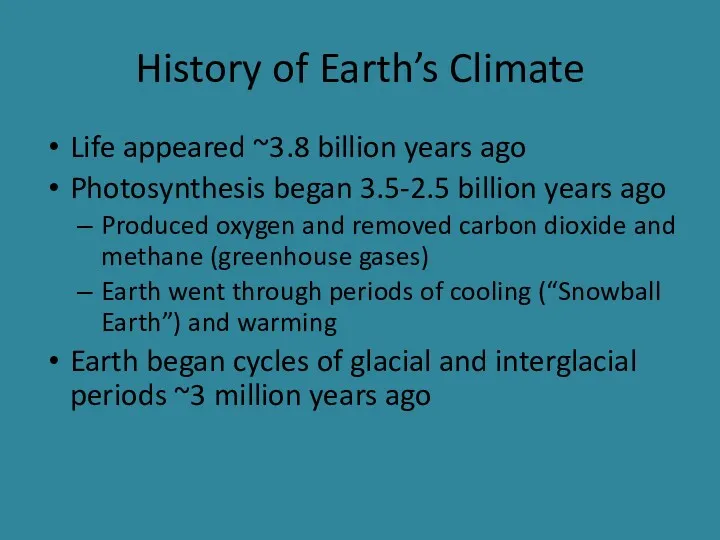
- 2. History of Earth’s Climate Life appeared ~3.8 billion years ago Photosynthesis began 3.5-2.5 billion years ago
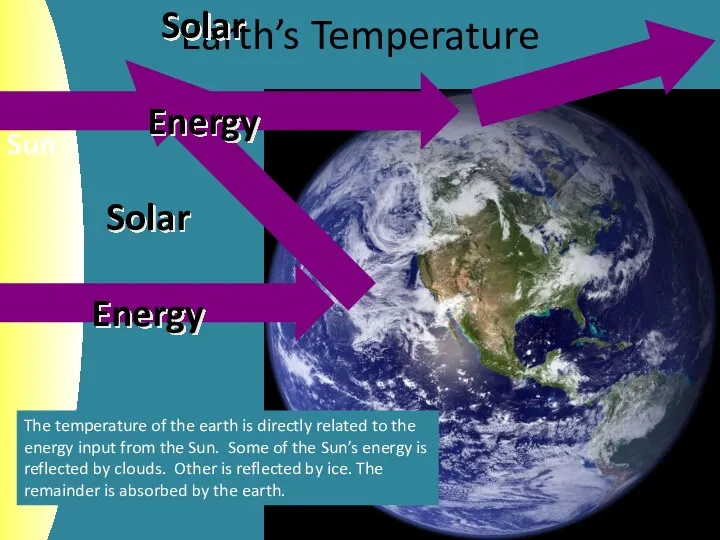
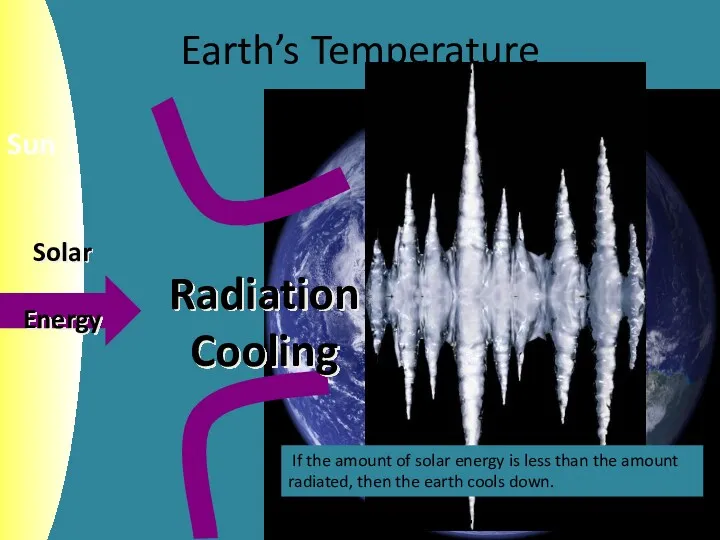
- 3. Earth’s Temperature The temperature of the earth is directly related to the energy input from the
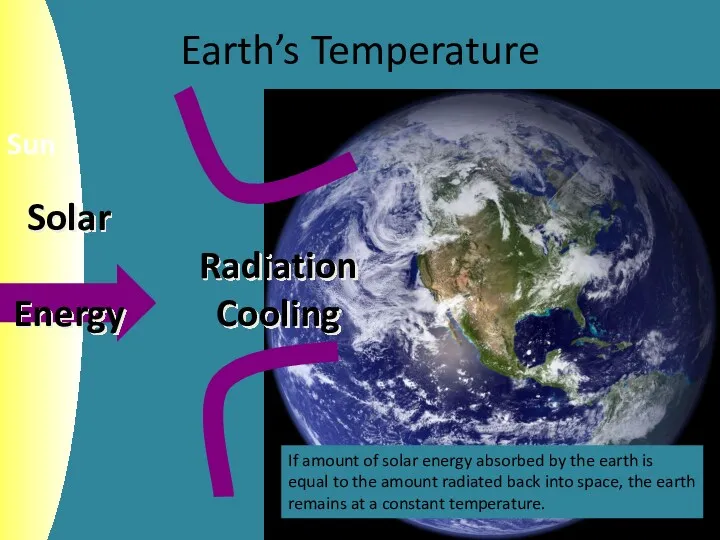
- 4. Earth’s Temperature If amount of solar energy absorbed by the earth is equal to the amount
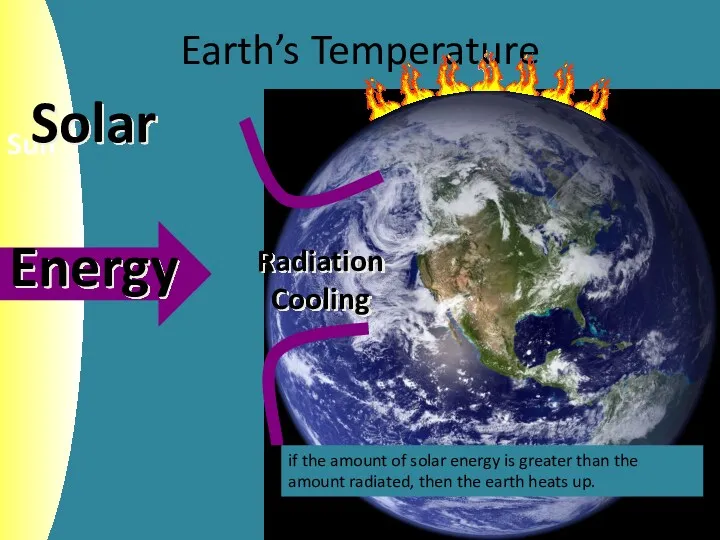
- 5. Earth’s Temperature if the amount of solar energy is greater than the amount radiated, then the
- 6. Earth’s Temperature If the amount of solar energy is less than the amount radiated, then the
- 7. Greenhouse Effect Sun To a certain degree, the earth acts like a greenhouse. Energy from the
- 8. Earth’s Atmospheric Gases Non- Greenhouse Gases 99% Greenhouse Gases 1%
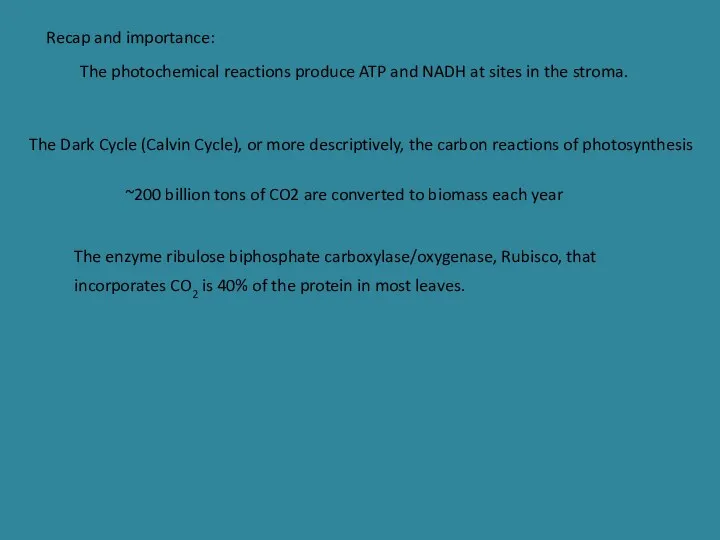
- 11. Recap and importance: The photochemical reactions produce ATP and NADH at sites in the stroma. The
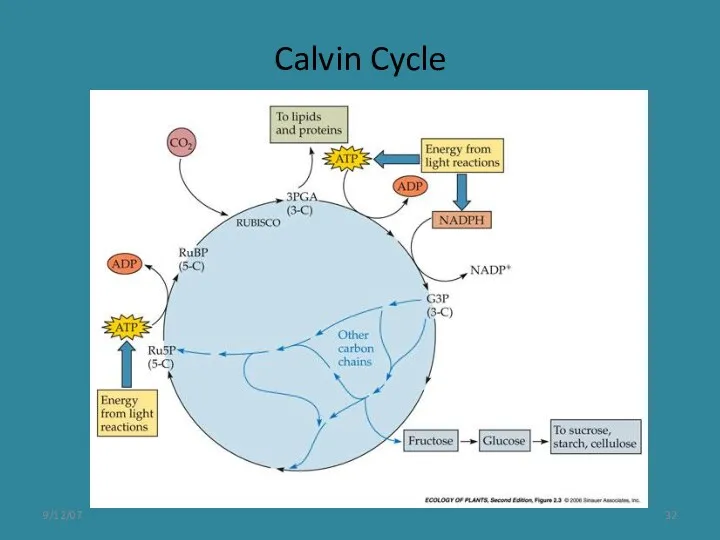
- 12. The Calvin cycle proceeds in three stages: carboxylation, reduction, and regeneration Carboxylation of the CO2 acceptor,
- 13. The affinity of Rubisco for CO2 is sufficiently high to ensure rapid carboxylation at the low
- 14. Basics of foliage photosynthesis Any questions? Increasing CO2 concentration in the atmosphere can increase the maximum
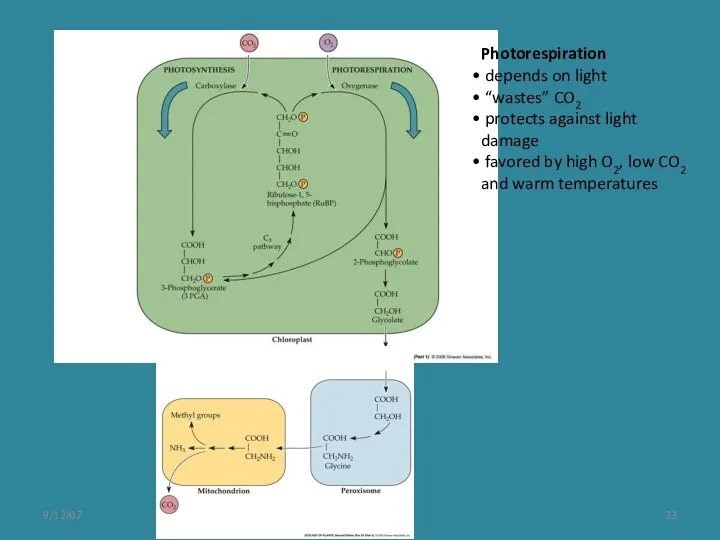
- 15. It is believed that photorespiration in plants has increased over geologic time due to increasing atmospheric
- 16. Decarboxylation of malate (CO2 release) creates a higher concentration of CO2 in bundle sheath cells than
- 17. Crassulacean Acid Metabolism (CAM) Uses C4 pathways, but segregates CO2 assimilation and Calvin cycle between day
- 18. Efficiency in light
- 19. ISOTOPES AND LAND PLANT ECOLOGY C3 vs. C4 vs. CAM
- 20. Cool season grass most trees and shrubs Warm season grass Arid adapted dicots Cerling et al.
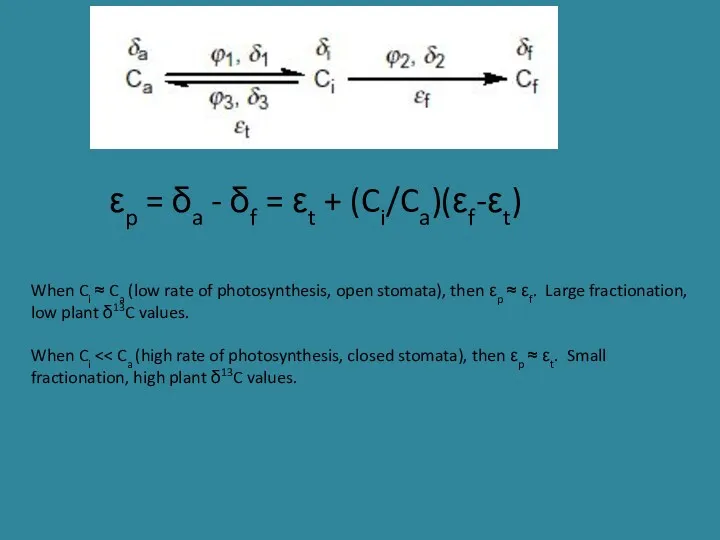
- 21. εp = δa - δf = εt + (Ci/Ca)(εf-εt) When Ci ≈ Ca (low rate of
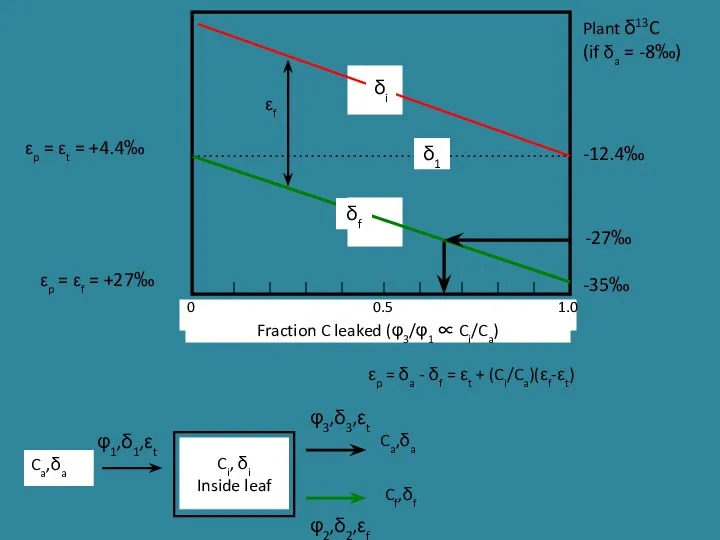
- 22. Ci, δi Inside leaf Ca,δa Ca,δa Cf,δf φ1,δ1,εt φ3,δ3,εt φ2,δ2,εf -12.4‰ -35‰ -27‰ Plant δ13C (if
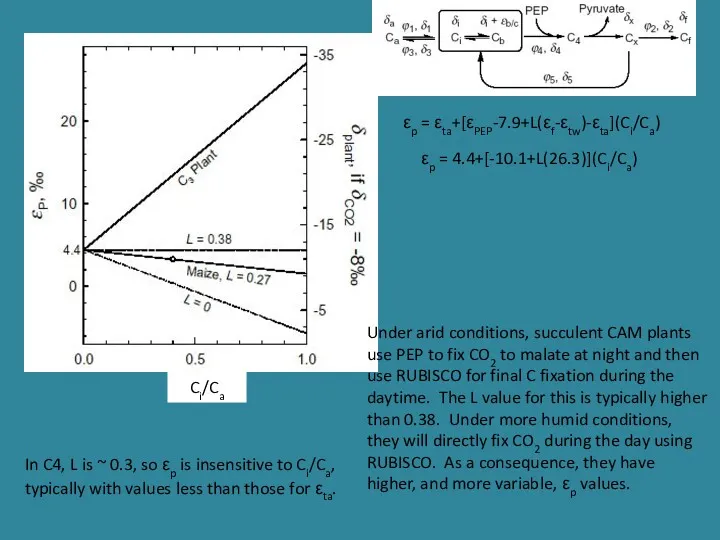
- 23. Ci/Ca In C4, L is ~ 0.3, so εp is insensitive to Ci/Ca, typically with values
- 24. Δ13C fraction-whole plant
- 25. δ13C varies with environment within C3 plants C3 plants
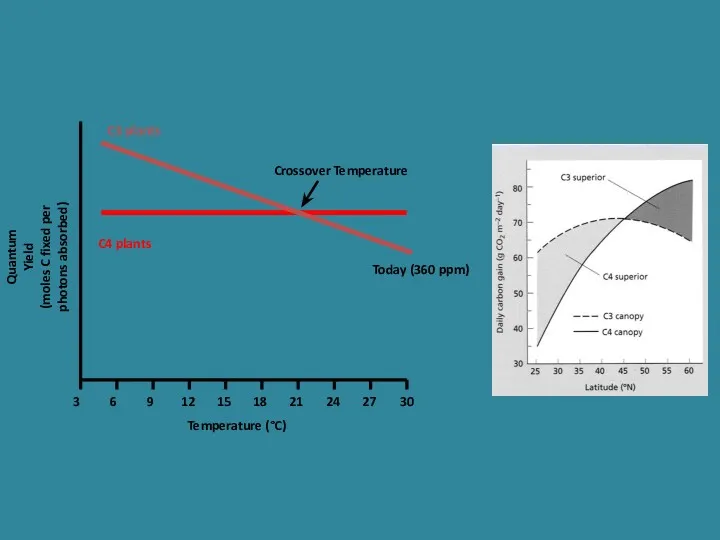
- 26. Quantum Yield (moles C fixed per photons absorbed) Temperature (°C) 3 6 9 12 15 18
- 27. What happens when pCO2 changes? Ehleringer et al. 1997 Oecologia C3 decreases in efficiency because of
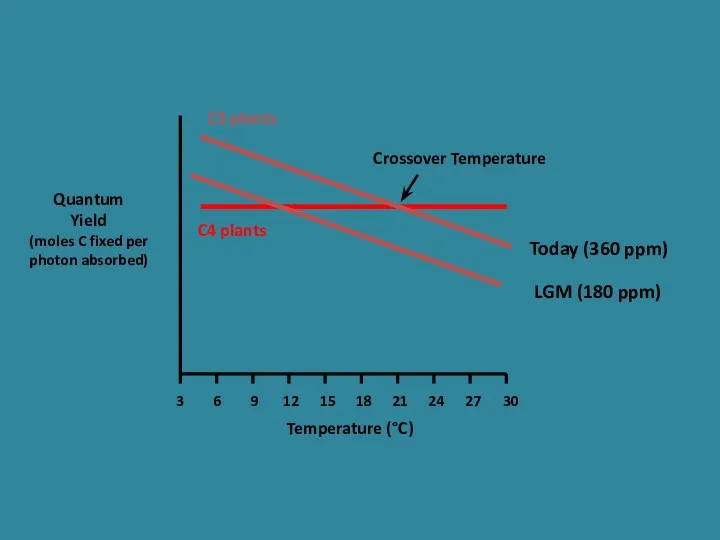
- 28. Quantum Yield (moles C fixed per photon absorbed) Temperature (°C) 3 6 9 12 15 18
- 29. C3 versus C4 plants C3 plants are favoured in environments where water is plentiful, temperature and
- 30. 9/12/07
- 31. 9/12/07 Three modes of photosynthesis C3 pathway, aka Calvin cycle, most common. Ribulose bisphosphate (RuBP, Rubisco)
- 32. 9/12/07 Calvin Cycle
- 33. 9/12/07 Photorespiration depends on light “wastes” CO2 protects against light damage favored by high O2, low
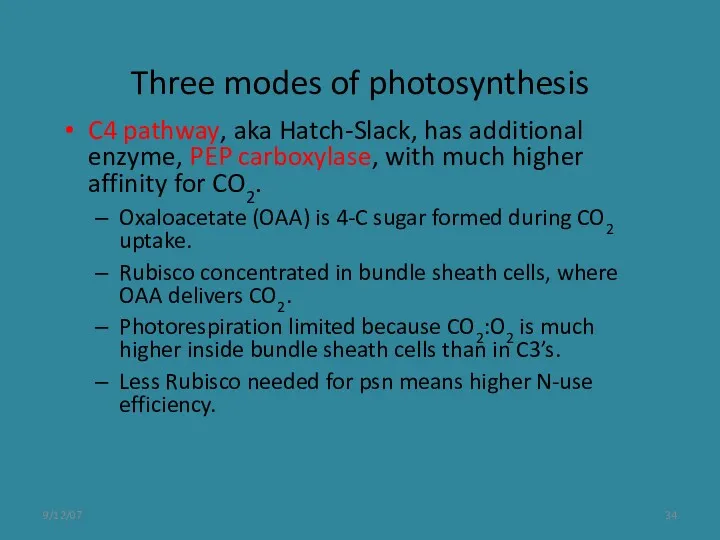
- 34. 9/12/07 Three modes of photosynthesis C4 pathway, aka Hatch-Slack, has additional enzyme, PEP carboxylase, with much
- 35. 9/12/07
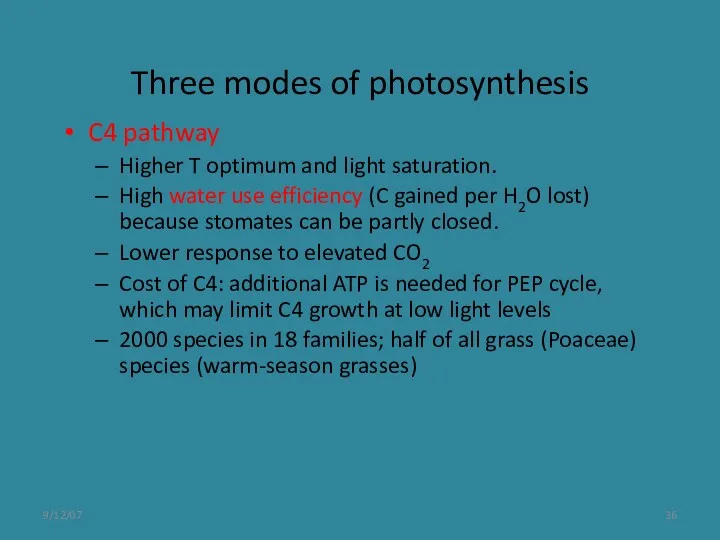
- 36. 9/12/07 Three modes of photosynthesis C4 pathway Higher T optimum and light saturation. High water use
- 39. • There is a clear correlation between the amount of anthropogenic CO2 released to the atmosphere
- 45. Скачать презентацию
History of Earth’s Climate
Life appeared ~3.8 billion years ago
Photosynthesis began 3.5-2.5
History of Earth’s Climate
Life appeared ~3.8 billion years ago
Photosynthesis began 3.5-2.5
Earth’s Temperature
The temperature of the earth is directly related to the
Earth’s Temperature
The temperature of the earth is directly related to the
Earth’s Temperature
If amount of solar energy absorbed by the earth is
Earth’s Temperature
If amount of solar energy absorbed by the earth is
Earth’s Temperature
if the amount of solar energy is greater than the
Earth’s Temperature
if the amount of solar energy is greater than the
Earth’s Temperature
If the amount of solar energy is less than
Earth’s Temperature
If the amount of solar energy is less than

Greenhouse Effect
Sun
To a certain degree, the earth acts like a
Greenhouse Effect
Sun
To a certain degree, the earth acts like a

Earth’s Atmospheric Gases
Non-
Greenhouse
Gases
99%
Greenhouse
Gases
1%
Earth’s Atmospheric Gases
Non-
Greenhouse
Gases
99%
Greenhouse
Gases
1%
Recap and importance:
The photochemical reactions produce ATP and NADH at sites
Recap and importance:
The photochemical reactions produce ATP and NADH at sites
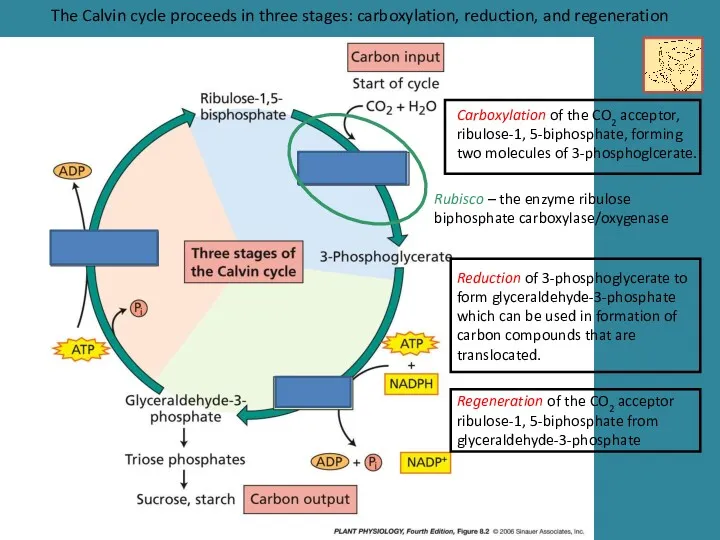
The Calvin cycle proceeds in three stages: carboxylation, reduction, and regeneration
Carboxylation
The Calvin cycle proceeds in three stages: carboxylation, reduction, and regeneration
Carboxylation
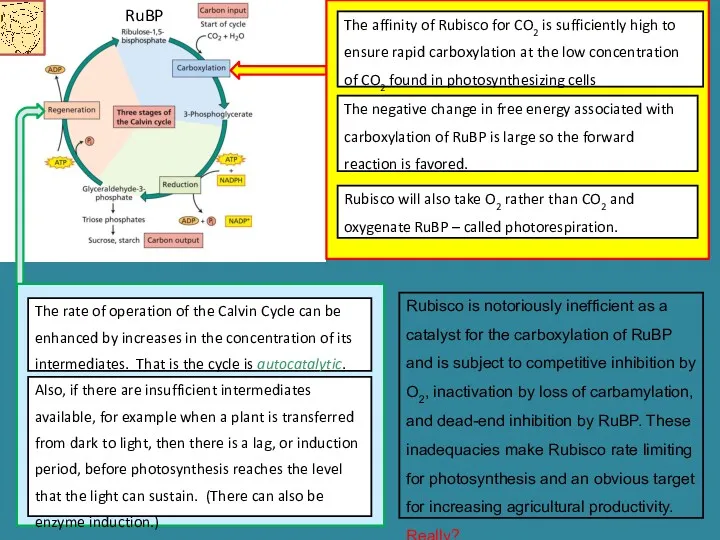
The affinity of Rubisco for CO2 is sufficiently high to ensure
The affinity of Rubisco for CO2 is sufficiently high to ensure
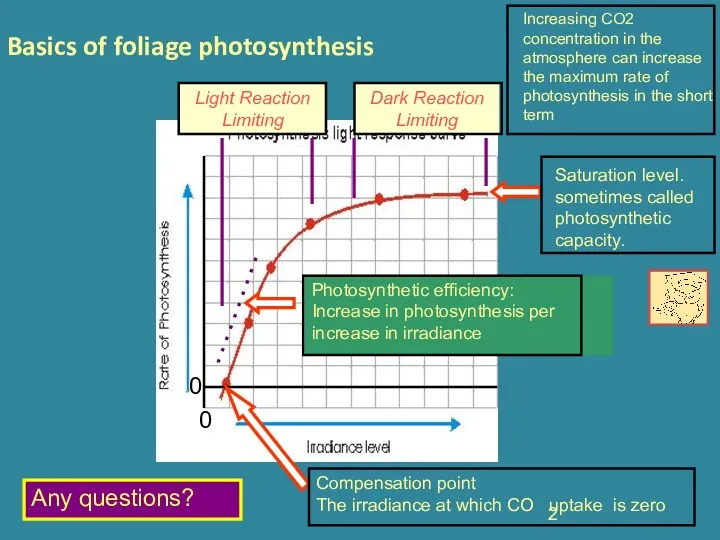
Basics of foliage photosynthesis
Any questions?
Increasing CO2 concentration in the atmosphere can
Basics of foliage photosynthesis
Any questions?
Increasing CO2 concentration in the atmosphere can

It is believed that photorespiration in plants has increased over geologic
It is believed that photorespiration in plants has increased over geologic
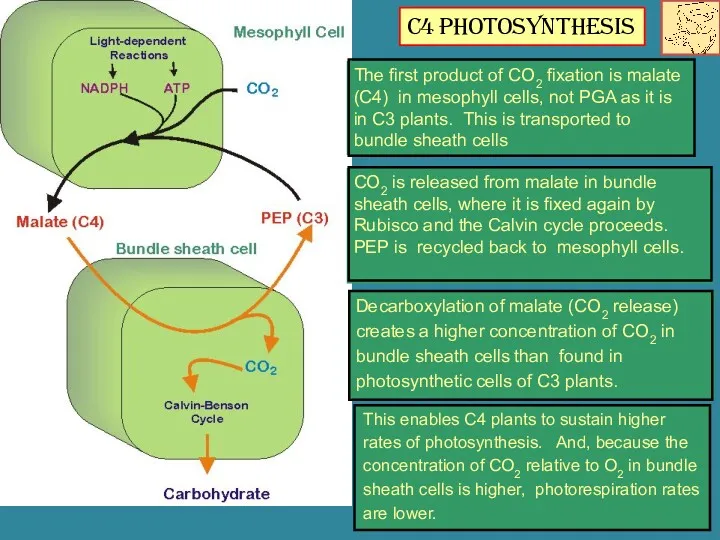
Decarboxylation of malate (CO2 release) creates a higher concentration of CO2
Decarboxylation of malate (CO2 release) creates a higher concentration of CO2
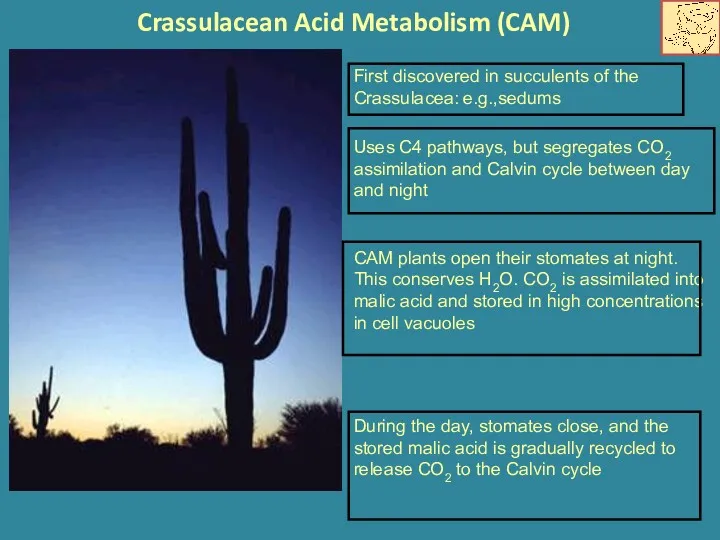
Crassulacean Acid Metabolism (CAM)
Uses C4 pathways, but segregates CO2 assimilation and
Crassulacean Acid Metabolism (CAM)
Uses C4 pathways, but segregates CO2 assimilation and
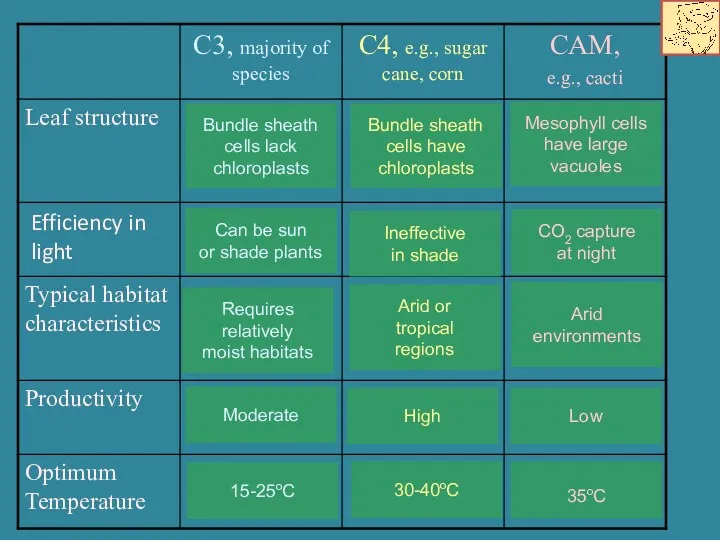
Efficiency in
light
Efficiency in
light
ISOTOPES AND LAND PLANT ECOLOGY
C3 vs. C4 vs. CAM
ISOTOPES AND LAND PLANT ECOLOGY
C3 vs. C4 vs. CAM
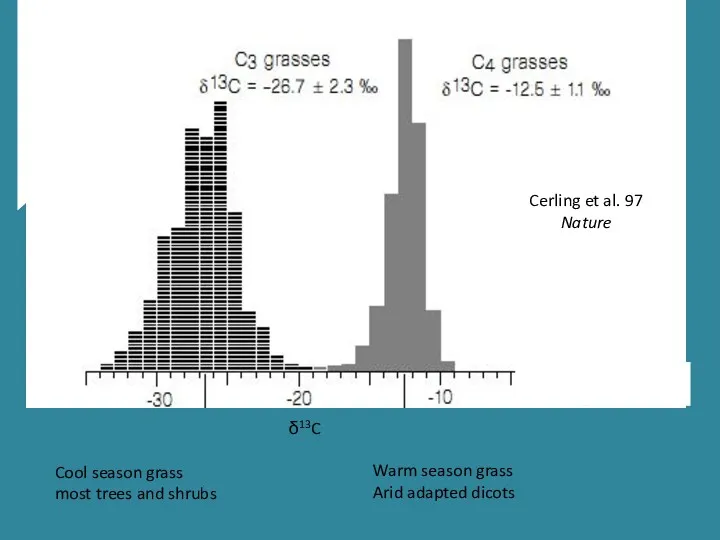
Cool season grass
most trees and shrubs
Warm season grass
Arid adapted dicots
Cerling et
Cool season grass
most trees and shrubs
Warm season grass
Arid adapted dicots
Cerling et
εp = δa - δf = εt + (Ci/Ca)(εf-εt)
When Ci ≈
εp = δa - δf = εt + (Ci/Ca)(εf-εt)
When Ci ≈
Ci, δi
Inside leaf
Ca,δa
Ca,δa
Cf,δf
φ1,δ1,εt
φ3,δ3,εt
φ2,δ2,εf
-12.4‰
-35‰
-27‰
Plant δ13C
(if δa = -8‰)
εp = εt =
Ci, δi
Inside leaf
Ca,δa
Ca,δa
Cf,δf
φ1,δ1,εt
φ3,δ3,εt
φ2,δ2,εf
-12.4‰
-35‰
-27‰
Plant δ13C
(if δa = -8‰)
εp = εt =
Ci/Ca
In C4, L is ~ 0.3, so εp is insensitive to
Ci/Ca
In C4, L is ~ 0.3, so εp is insensitive to
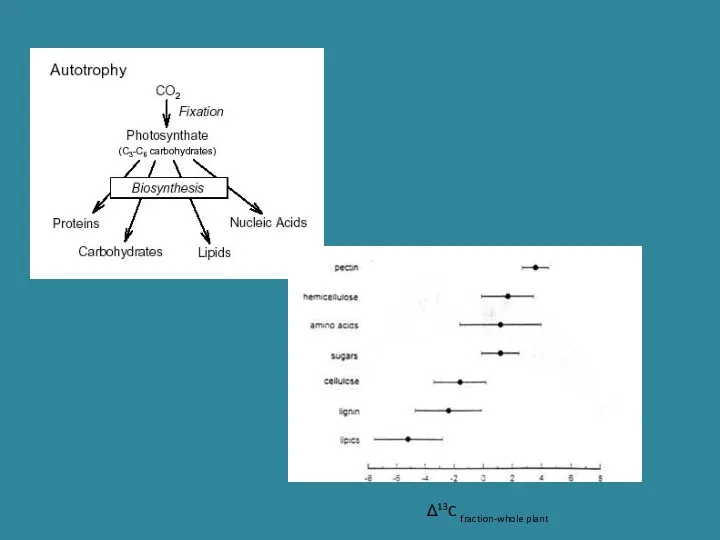
Δ13C fraction-whole plant
Δ13C fraction-whole plant
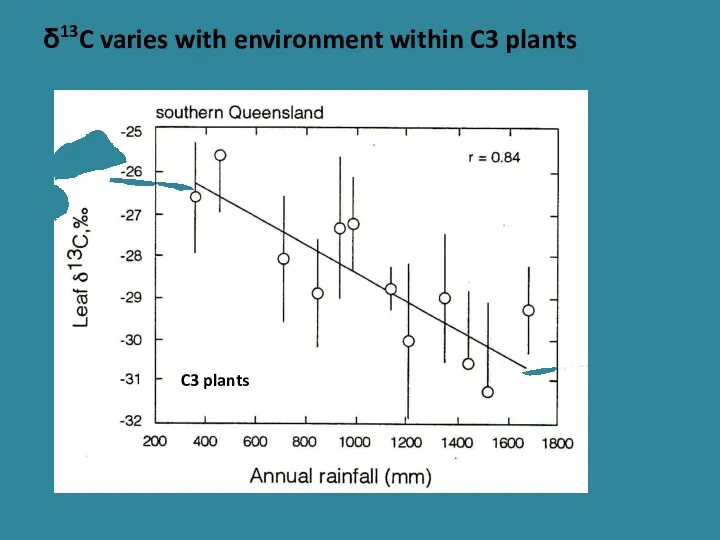
δ13C varies with environment within C3 plants
C3 plants
δ13C varies with environment within C3 plants
C3 plants
Quantum
Yield
(moles C fixed per
photons absorbed)
Temperature (°C)
3
6
9
12
15
18
21
24
27
30
C4 plants
C3 plants
Crossover Temperature
Today (360 ppm)
Quantum
Yield
(moles C fixed per
photons absorbed)
Temperature (°C)
3
6
9
12
15
18
21
24
27
30
C4 plants
C3 plants
Crossover Temperature
Today (360 ppm)
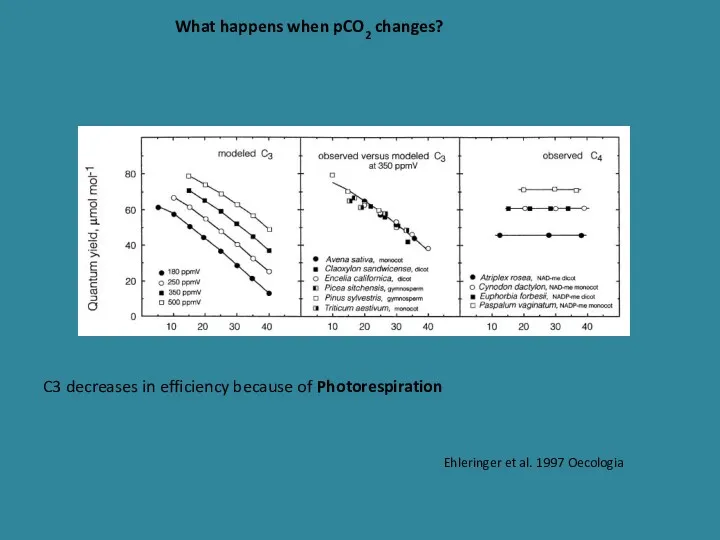
What happens when pCO2 changes?
Ehleringer et al. 1997 Oecologia
C3 decreases in
What happens when pCO2 changes?
Ehleringer et al. 1997 Oecologia
C3 decreases in
Quantum
Yield
(moles C fixed per
photon absorbed)
Temperature (°C)
3
6
9
12
15
18
21
24
27
30
C4 plants
C3 plants
Crossover Temperature
Today (360 ppm)
Quantum
Yield
(moles C fixed per
photon absorbed)
Temperature (°C)
3
6
9
12
15
18
21
24
27
30
C4 plants
C3 plants
Crossover Temperature
Today (360 ppm)
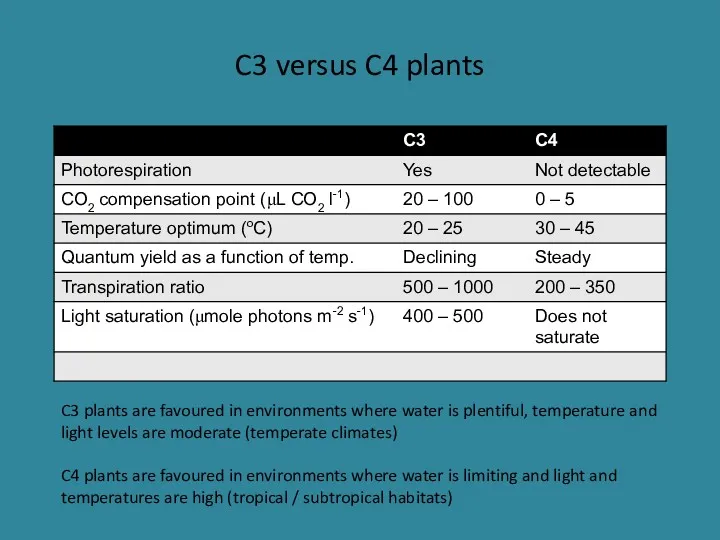
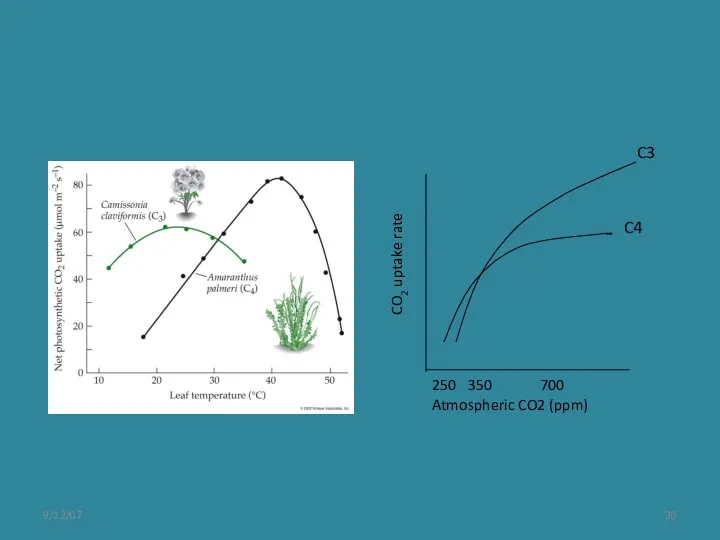
C3 versus C4 plants
C3 plants are favoured in environments where water
C3 versus C4 plants
C3 plants are favoured in environments where water
9/12/07
9/12/07

9/12/07
Three modes of photosynthesis
C3 pathway, aka Calvin cycle, most common.
Ribulose
9/12/07
Three modes of photosynthesis
C3 pathway, aka Calvin cycle, most common.
Ribulose
9/12/07
Calvin Cycle
9/12/07
Calvin Cycle
9/12/07
Photorespiration
depends on light
“wastes” CO2
protects against light damage
9/12/07
Photorespiration
depends on light
“wastes” CO2
protects against light damage
9/12/07
Three modes of photosynthesis
C4 pathway, aka Hatch-Slack, has additional enzyme, PEP
9/12/07
Three modes of photosynthesis
C4 pathway, aka Hatch-Slack, has additional enzyme, PEP

9/12/07
9/12/07
9/12/07
Three modes of photosynthesis
C4 pathway
Higher T optimum and light saturation.
9/12/07
Three modes of photosynthesis
C4 pathway
Higher T optimum and light saturation.
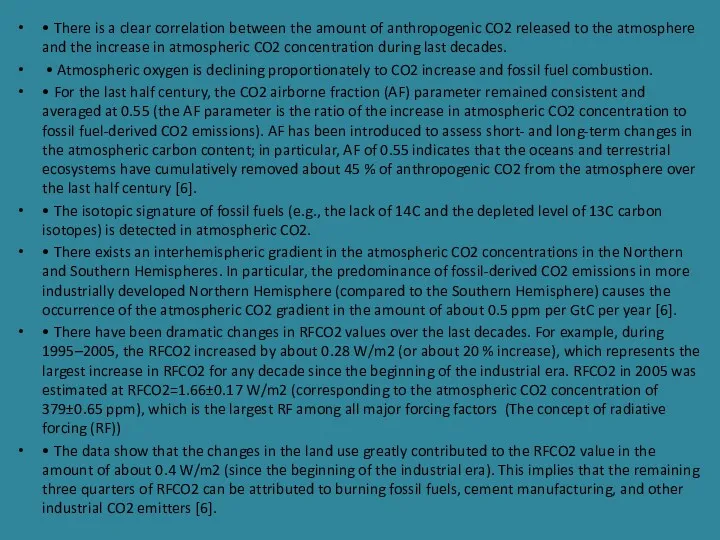
• There is a clear correlation between the amount of anthropogenic
• There is a clear correlation between the amount of anthropogenic


 Почвы России (8 класс)
 Кіріспе. Теңіз кен орындарын меңгерудің қазіргі жағдайы
 Расселение населения. Урбанизация
 Населення та політична карта Африки
 Государственный строй стран мира
 Поход на Алтай
 Анализ и обобщение данных о водном балансе речных бассейнов
 Круговорот воды в природе
 Материки и океаны на поверхности Земли. Части света
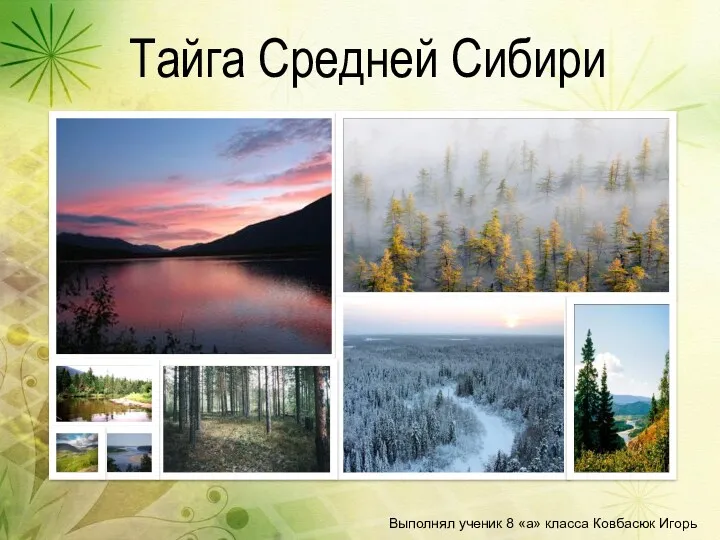 Тайга Средней Сибири
 Федерати́вна Респу́бліка Брази́лія
 Исследование туристского потенциала Ивановской области
 Гидрография, разнообразие природы и население Северной Америки
 Королевство Испания
 Водные богатства Земли
 Халық санағы. Ұдайы өсудің түрлері
 Schleswig-Holstein
 Осетинский народ
 Республика Украина
 Лекция 2. Внутреннее строение и химический состав Земли
 Карта России. Природные зоны. Зона арктических пустынь. Зона тундры
 Жер бетінің сумен шаюлуы – су эрозиясы деп аталады
 Ростов на Дону
 Наши ближайшие соседи
 Погода. Элементы погоды
 Страны Северной Европы
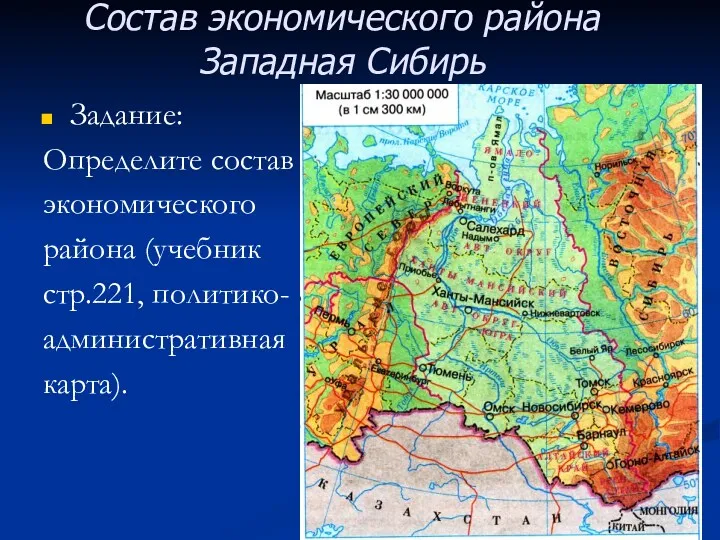 Состав экономического района Западная Сибирь
 Происхождение рас