- How are different types of maps distinguished?

Содержание
- 2. How are different types of maps distinguished?
- 3. Political Maps Usually colored by country or by state Political colors make it easy to compare
- 4. World Political Map
- 5. Physical Map Has colors that make natural patterns stand out The colors on the map can
- 6. World Physical Map
- 7. Climate Map The climate of a place is the weather it has season by season, year
- 8. World Climate Map
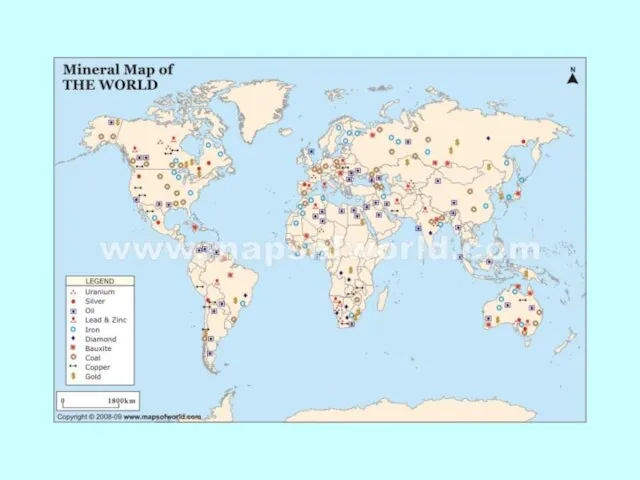
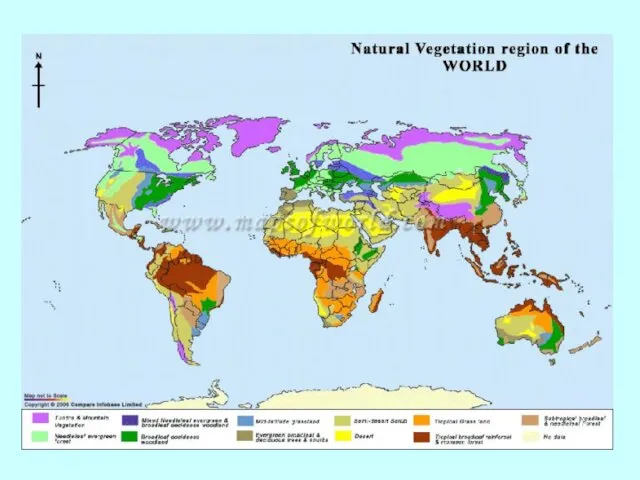
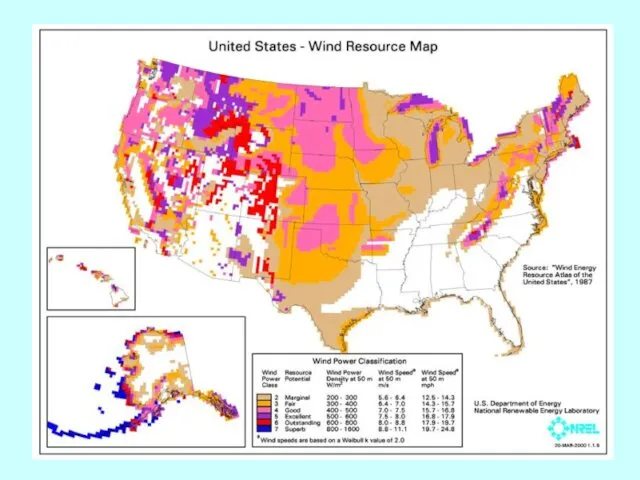
- 9. Land Use Resource Map These maps show how land is being used. This might refer to:
- 13. Contour maps Contour lines represent the elevation at that line. If you were to walk across
- 14. Contour map
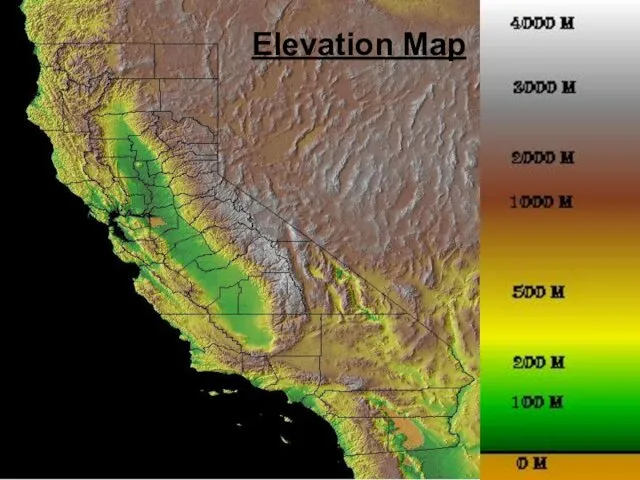
- 15. Elevation Maps Maps that show elevation change by using color or shading.
- 16. What is the average elevation of most of our state? Elevation Map
- 17. Elevation Map of Tennessee
- 18. Elevation Map
- 19. Elevation Map
- 20. Topographic Map These maps generally represent a small area with a lot of detail. They show
- 21. Topographic Map
- 22. http://www.tasagraphicarts.com/activities/profile.html
- 24. Скачать презентацию
How are different types of maps distinguished?
How are different types of maps distinguished?
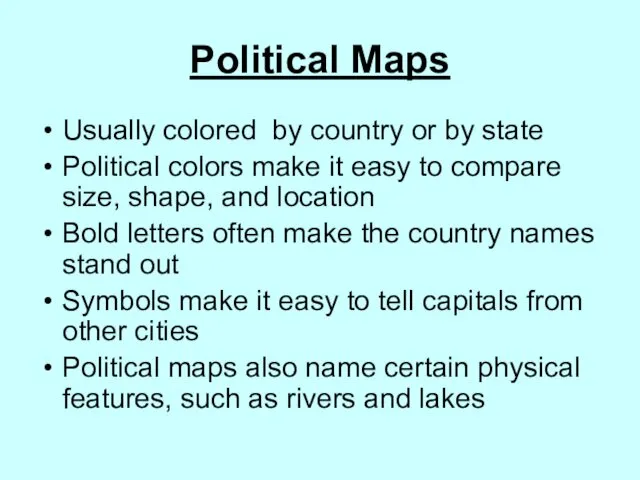
Political Maps
Usually colored by country or by state
Political colors make it
Political Maps
Usually colored by country or by state
Political colors make it
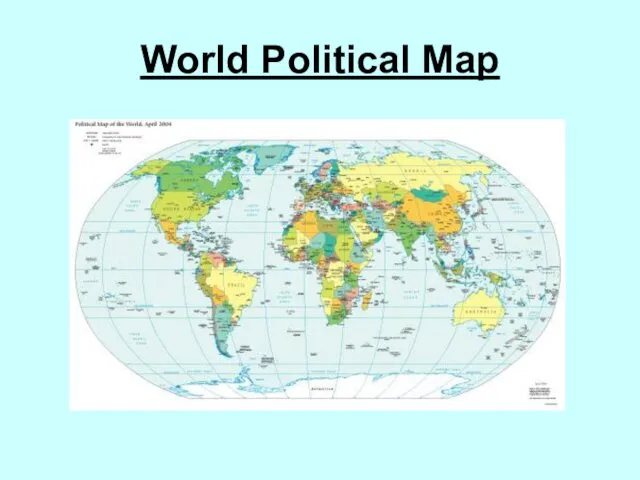
World Political Map
World Political Map
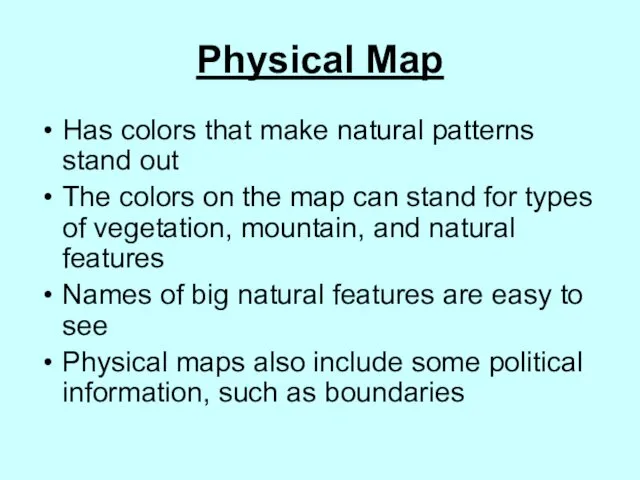
Physical Map
Has colors that make natural patterns stand out
The colors on
Physical Map
Has colors that make natural patterns stand out
The colors on
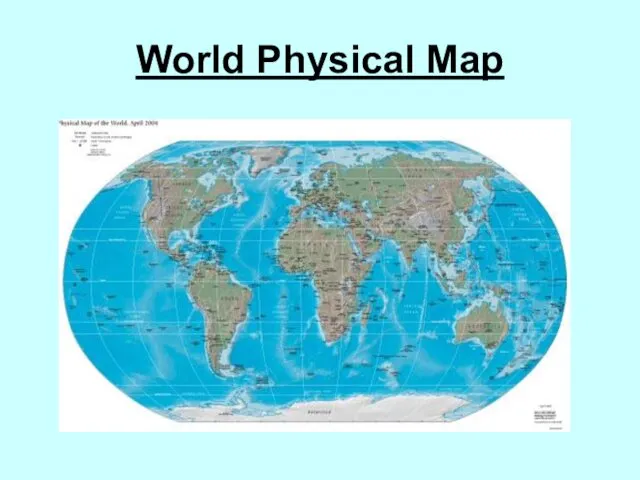
World Physical Map
World Physical Map
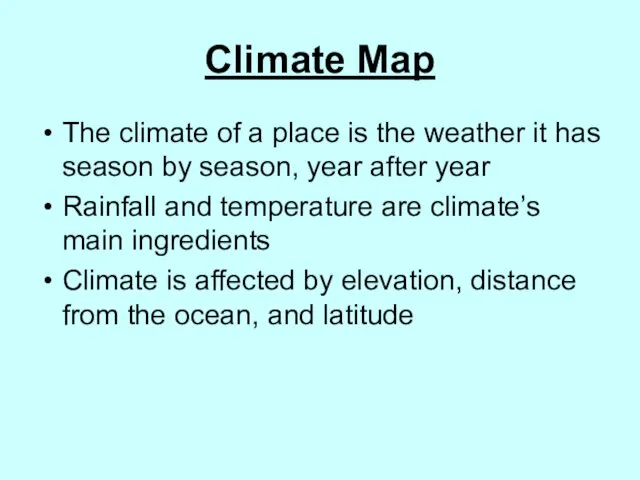
Climate Map
The climate of a place is the weather it has
Climate Map
The climate of a place is the weather it has
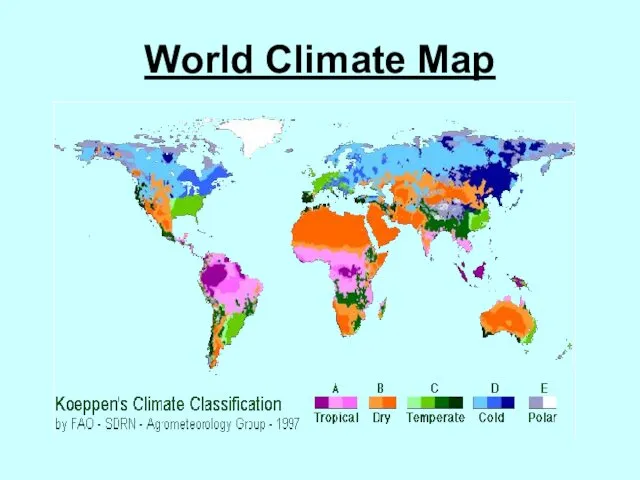
World Climate Map
World Climate Map
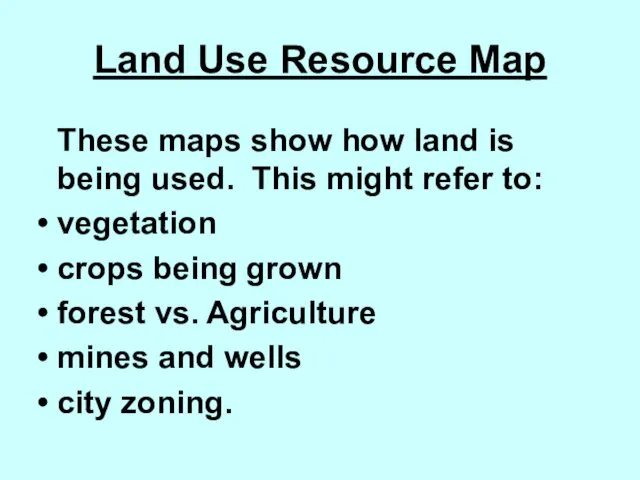
Land Use Resource Map
These maps show how land is being used.
Land Use Resource Map
These maps show how land is being used.
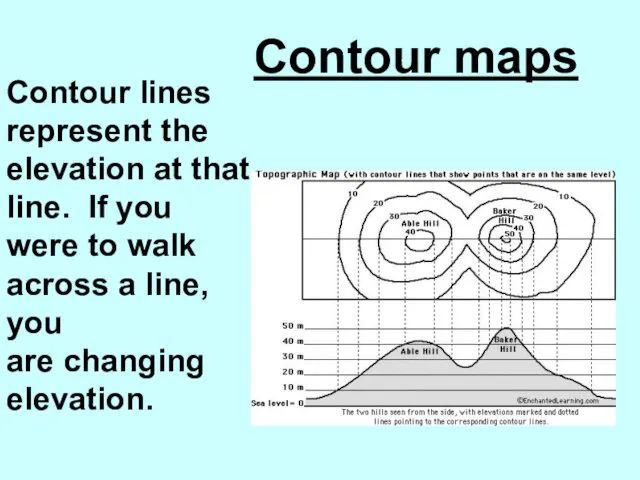
Contour maps
Contour lines represent the
elevation at that line. If you
Contour maps
Contour lines represent the
elevation at that line. If you
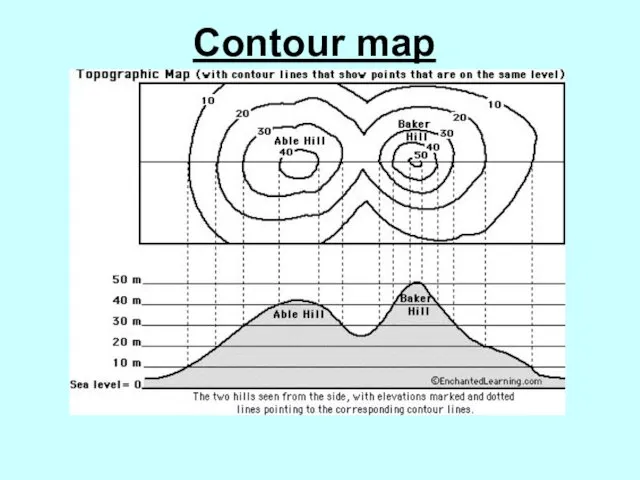
Contour map
Contour map
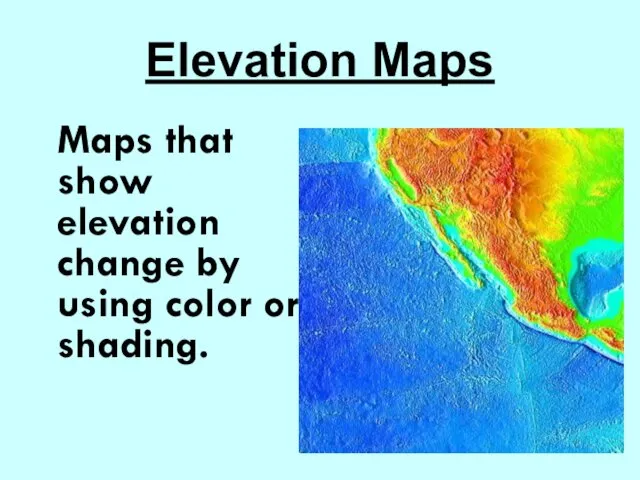
Elevation Maps
Maps that show elevation change by using color or shading.
Elevation Maps
Maps that show elevation change by using color or shading.
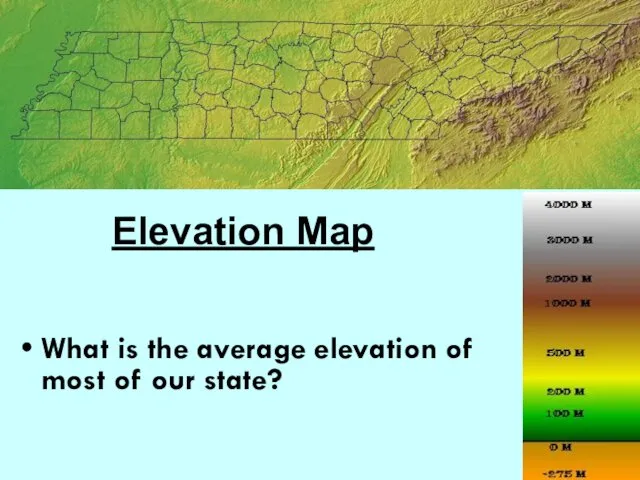
What is the average elevation of most of our state?
Elevation Map
Elevation Map
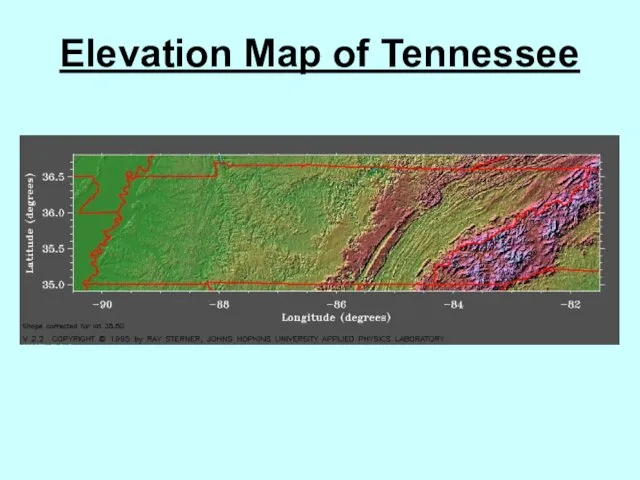
Elevation Map of Tennessee
Elevation Map of Tennessee
Elevation Map
Elevation Map
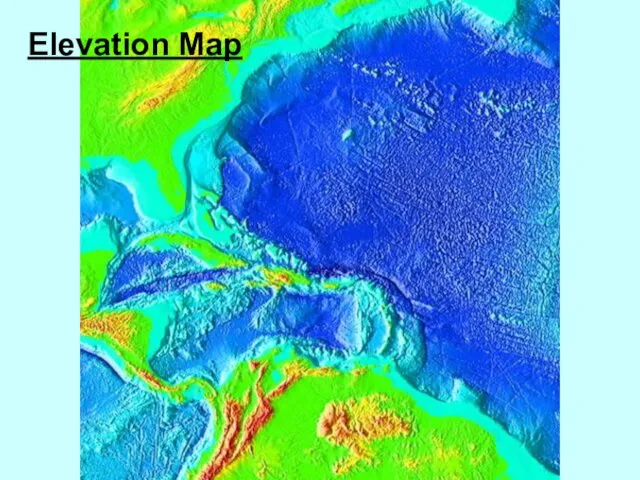
Elevation Map
Elevation Map
Topographic Map
These maps generally represent a small area with a lot
Topographic Map
These maps generally represent a small area with a lot
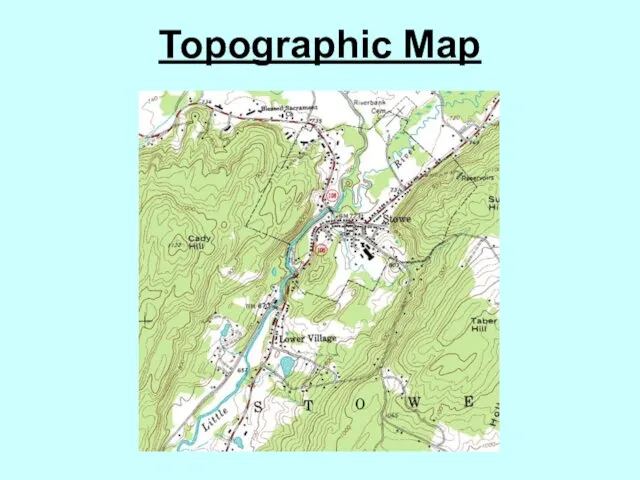
Topographic Map
Topographic Map

http://www.tasagraphicarts.com/activities/profile.html
http://www.tasagraphicarts.com/activities/profile.html
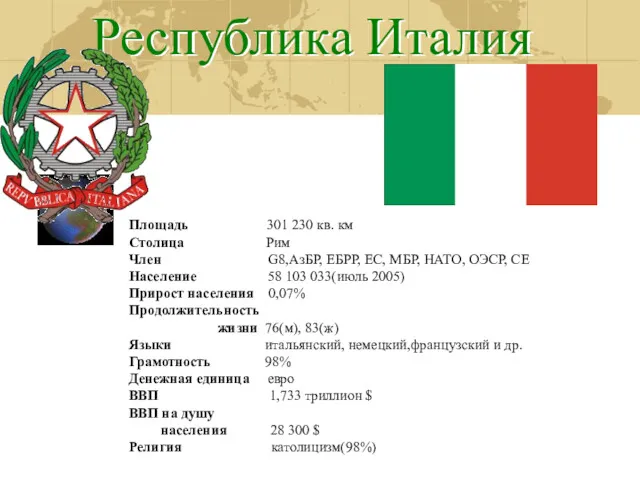 Республика Италия
 Механические свойства горных пород
 Демографический анализ. Демографические прогнозы
 Планета Земля. Розвиток уявлень про форму Землі. Геометричні характеристики Землі
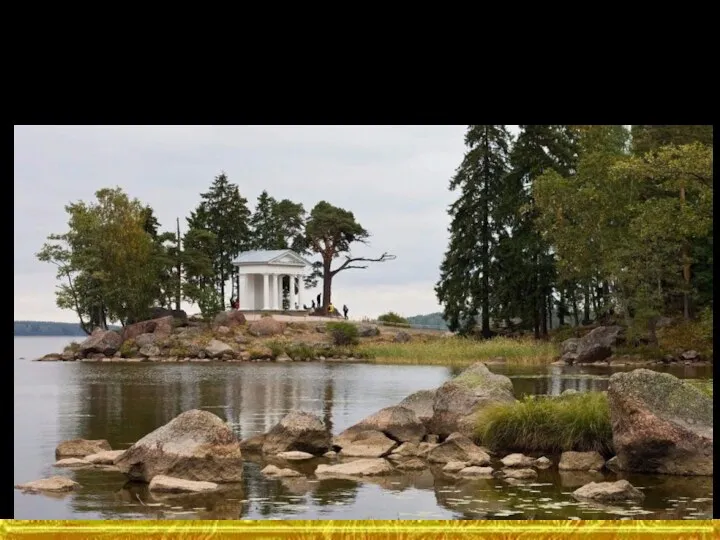 Памятник природы. Парк монрепо
 Стальная магистраль (поездка на первом пассажирском поезде по Алтайской железной дороге)
 Эпоха Великих географических открытий
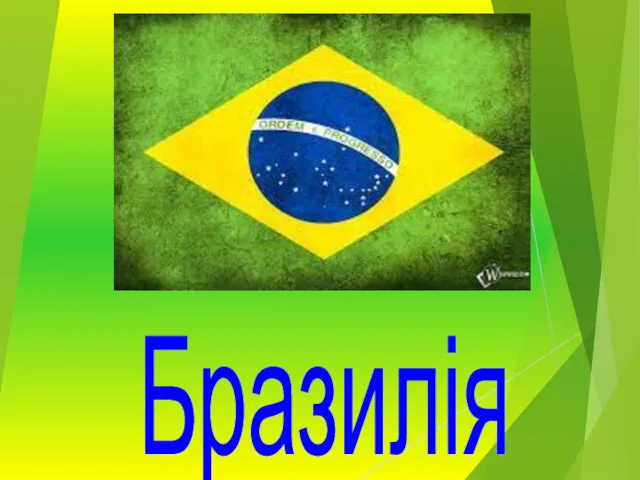 Бразилія - держава в Південній Америці
 Ориентирование направлений. Истинные и магнитные азимуты, склонение магнитной стрелки. Прямой обратный азимут. Румбы
 Prezentatsia_Kolesova_Kirilla_-_Gory_Урала
 Приспособленность людей к жизни в различных природных зонах. 6 класс
 Субъекты Российской Федерации. Административно-территориальное устройство России
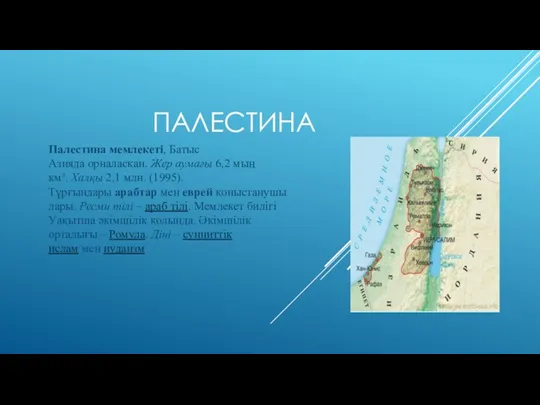 Палестина мемлекеті
 Ямало-Ненецкий автономный округ
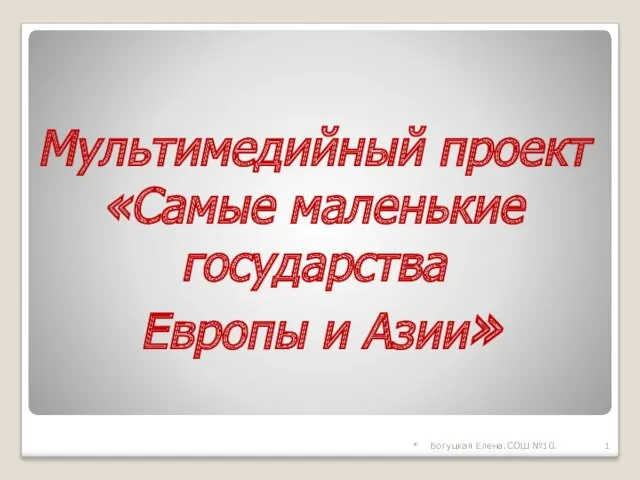 Самые маленькие государства Европы и Азии
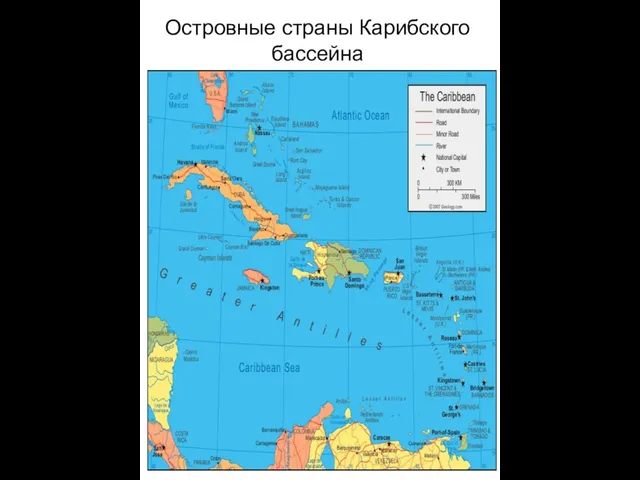 Островные страны Карибского бассейна
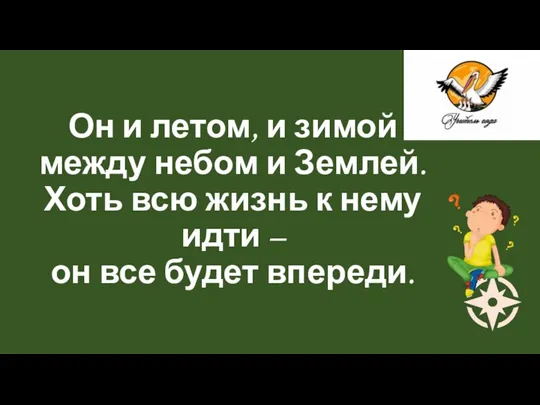 Стороны горизонта. Ориентирование
 Город Санкт-Петербург
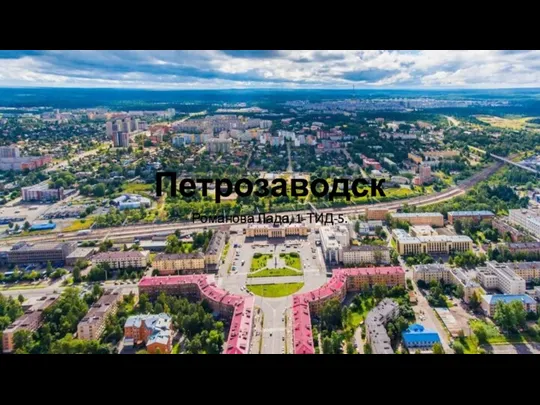 Петрозаводск. Старый город
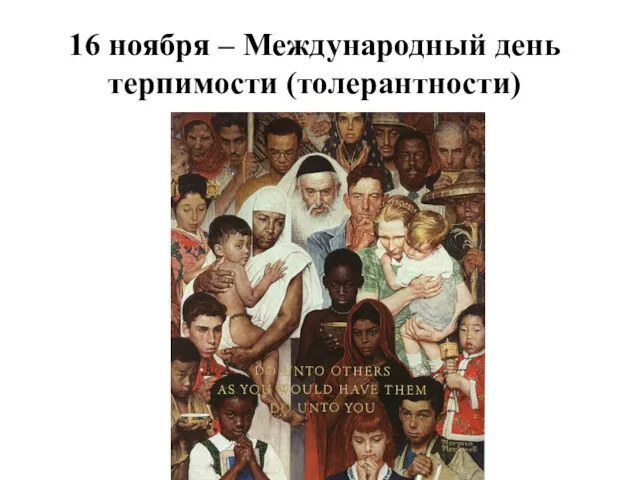 16 ноября – Международный день терпимости (толерантности)
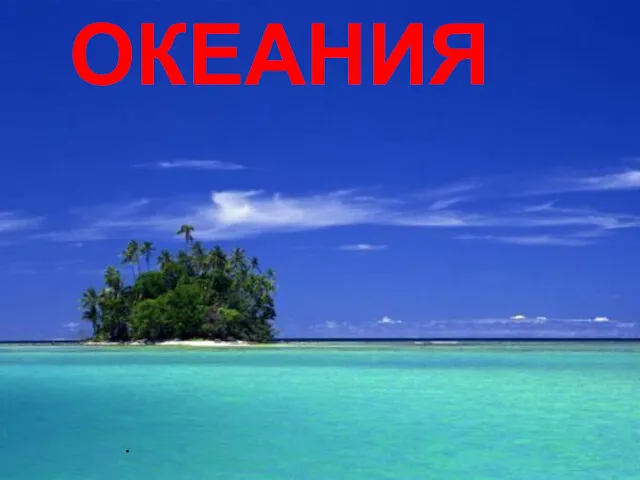 Океания
 Гідросфера. Частини Світового Океану
 Топографические знаки
 Небесна сфера. Основні точки та лінії. Орієнтування на місцевості
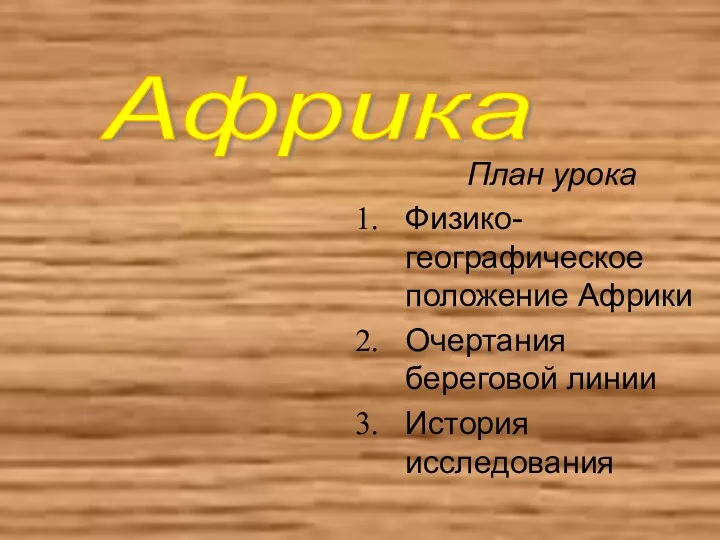 Физикогеографическое положение Африки. Очертания береговой линии. История исследования
 Постановка поисково-разведочного бурения в слабоизученном районе Рассошинской площади
 Володарский мост
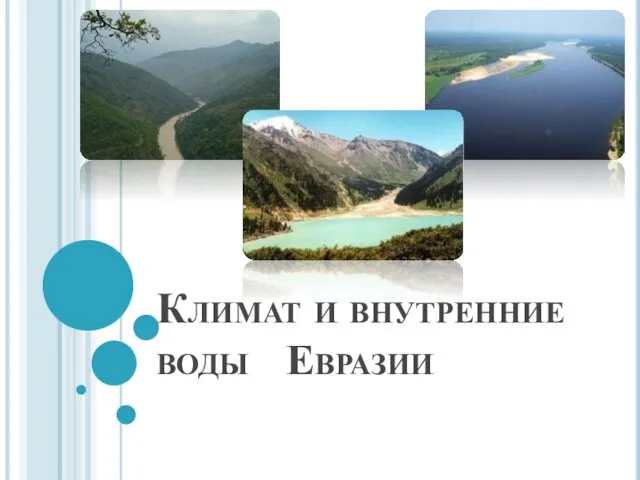 климат и внутрен воды евразии