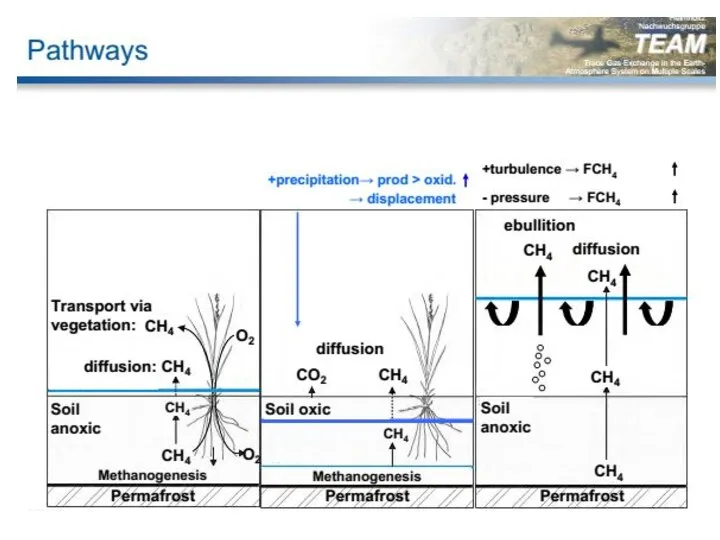
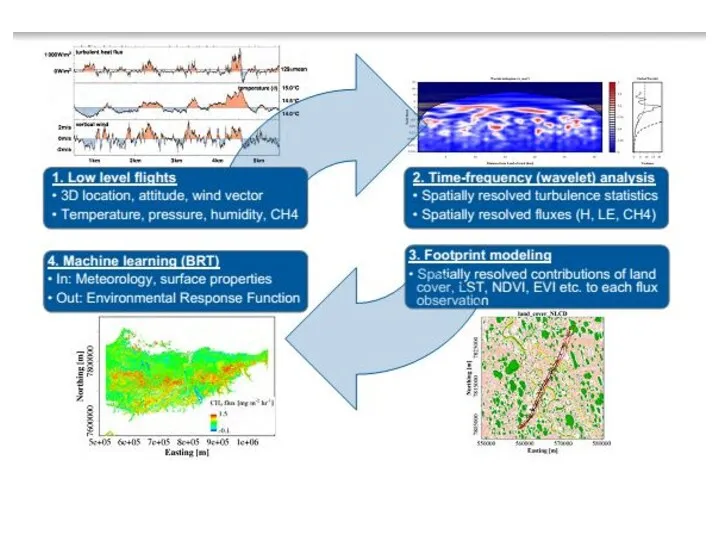
- Methods

Содержание
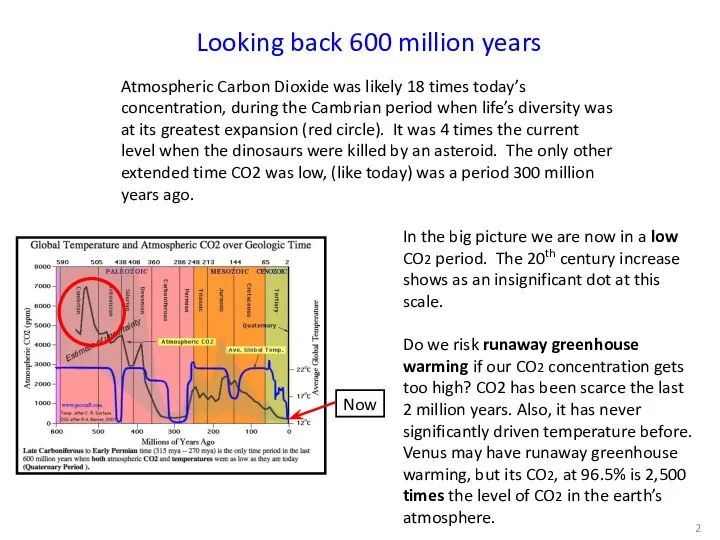
- 2. Looking back 600 million years Atmospheric Carbon Dioxide was likely 18 times today’s concentration, during the
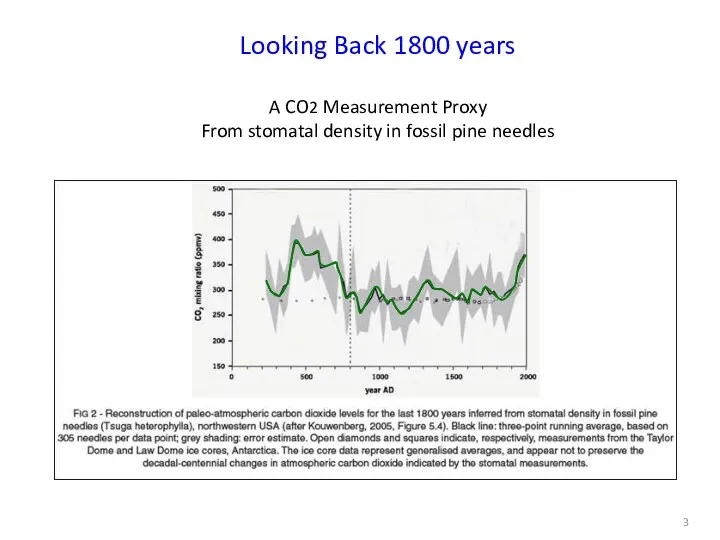
- 3. Looking Back 1800 years A CO2 Measurement Proxy From stomatal density in fossil pine needles
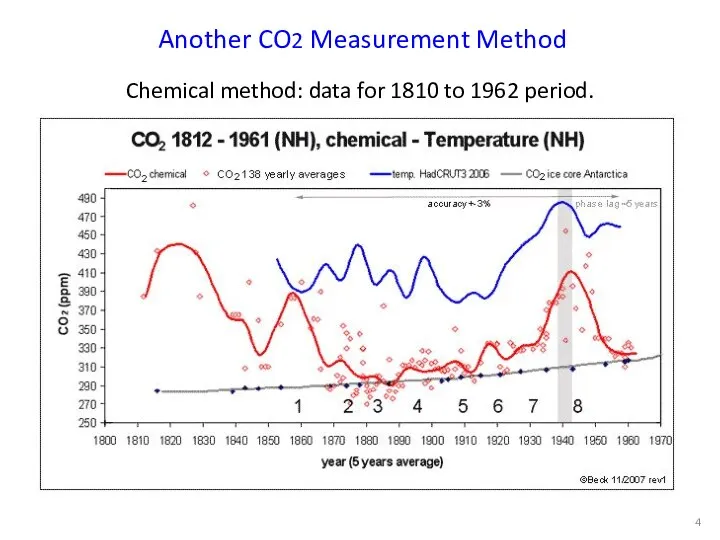
- 4. Another CO2 Measurement Method Chemical method: data for 1810 to 1962 period.
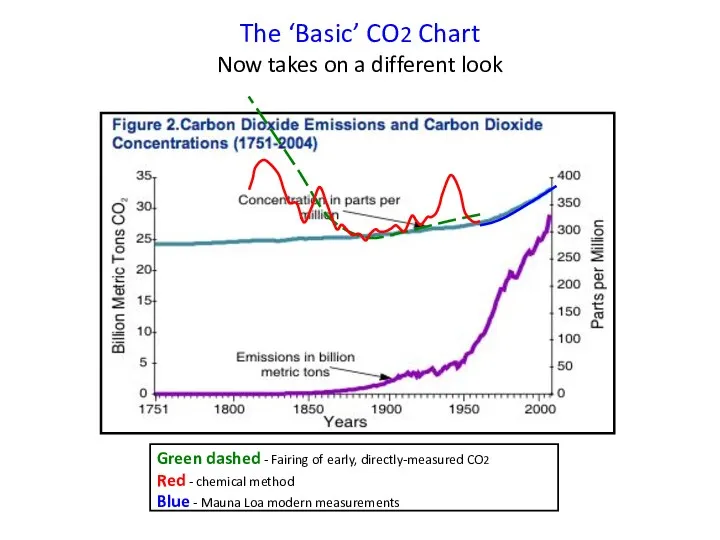
- 5. Green dashed - Fairing of early, directly-measured CO2 Red - chemical method Blue - Mauna Loa
- 6. Dashed green - early direct measurements Green - stomatal density in fossil pine needles Black -
- 7. Now, to put Atmospheric CO2 in Perspective This shows CO2 in its proper role as a
- 8. The Greenland ice core data show it has been consistently warmer for the last 11,000 years.
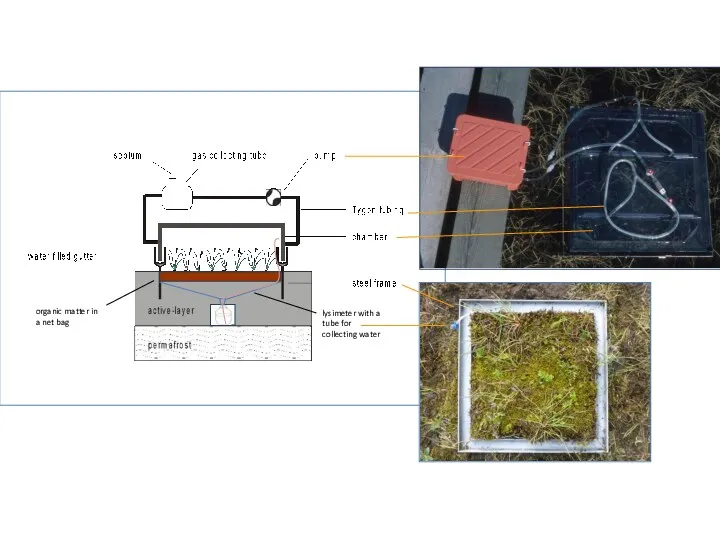
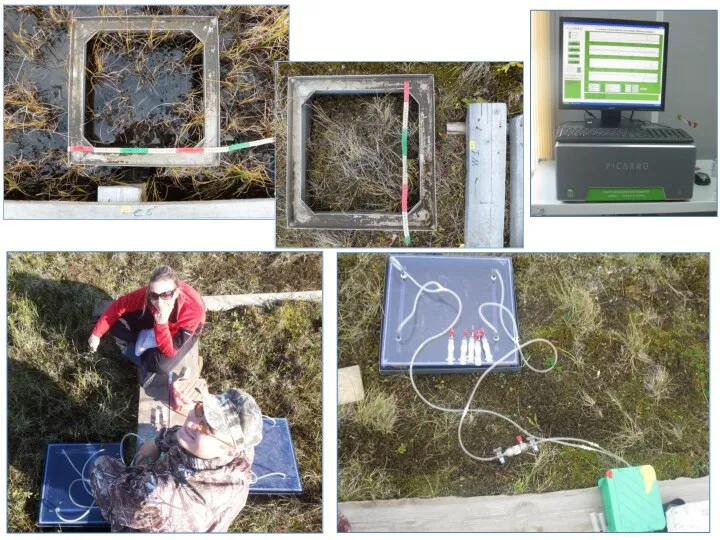
- 21. Ivakhov V. (photos and chamber)
- 24. Cross section through the floating emission chambers with the underwater chambers for trapping gas bubbles rising
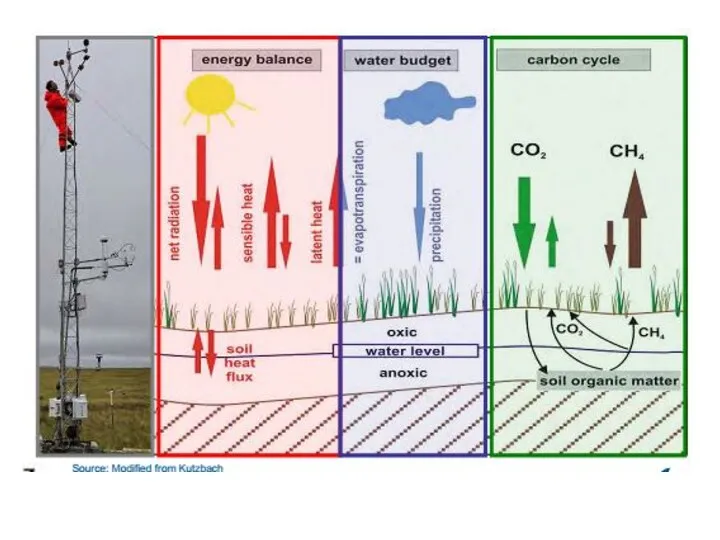
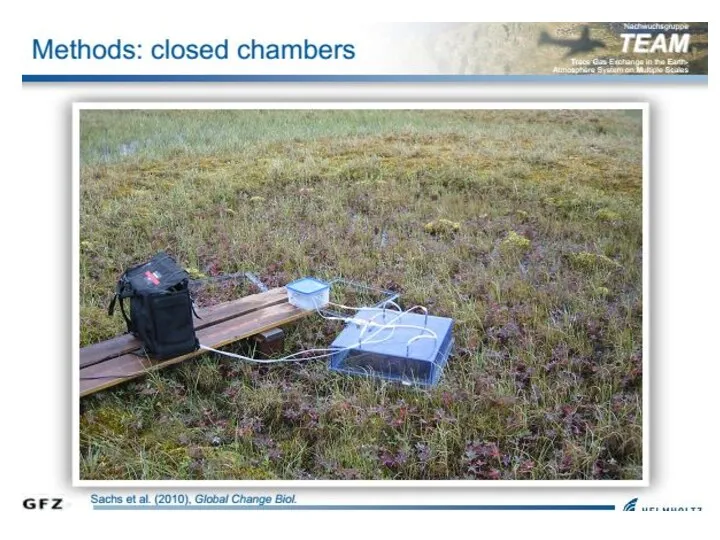
- 28. Methods: Chamber Eddy covariance Satelite Aircraft
- 35. Questions Why are CH4 and N2O more effective greenhouse gases than CO2? Which GHG are more
- 37. Скачать презентацию
Looking back 600 million years
Atmospheric Carbon Dioxide was likely 18 times
Looking back 600 million years
Atmospheric Carbon Dioxide was likely 18 times
Looking Back 1800 years
A CO2 Measurement Proxy
From stomatal density in fossil
Looking Back 1800 years
A CO2 Measurement Proxy
From stomatal density in fossil
Another CO2 Measurement Method
Chemical method: data for 1810 to 1962 period.
Another CO2 Measurement Method
Chemical method: data for 1810 to 1962 period.
Green dashed - Fairing of early, directly-measured CO2
Red - chemical method
Blue
Green dashed - Fairing of early, directly-measured CO2
Red - chemical method
Blue
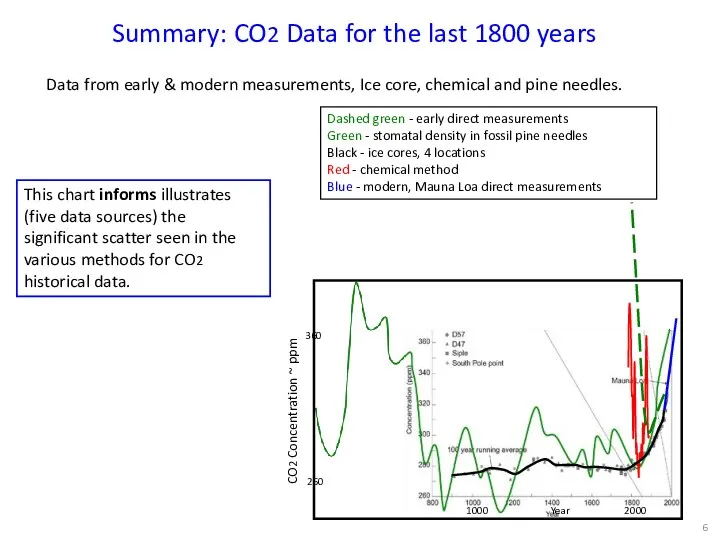
Dashed green - early direct measurements
Green - stomatal density in fossil
Dashed green - early direct measurements
Green - stomatal density in fossil
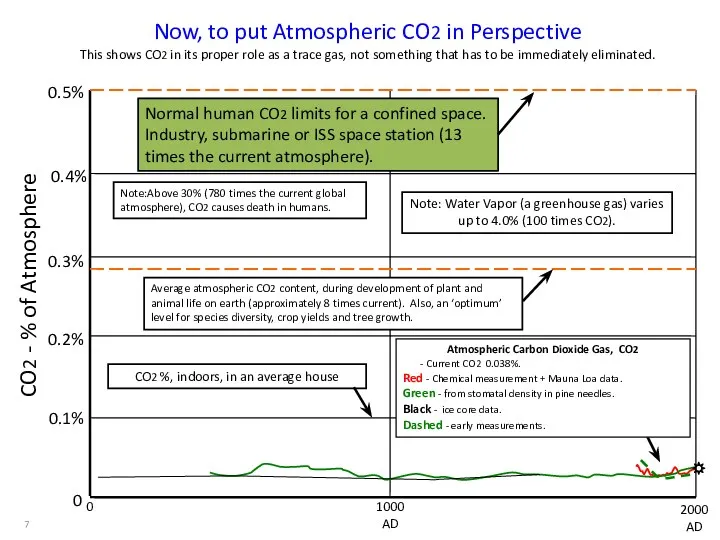
Now, to put Atmospheric CO2 in Perspective
This shows CO2 in its
Now, to put Atmospheric CO2 in Perspective
This shows CO2 in its
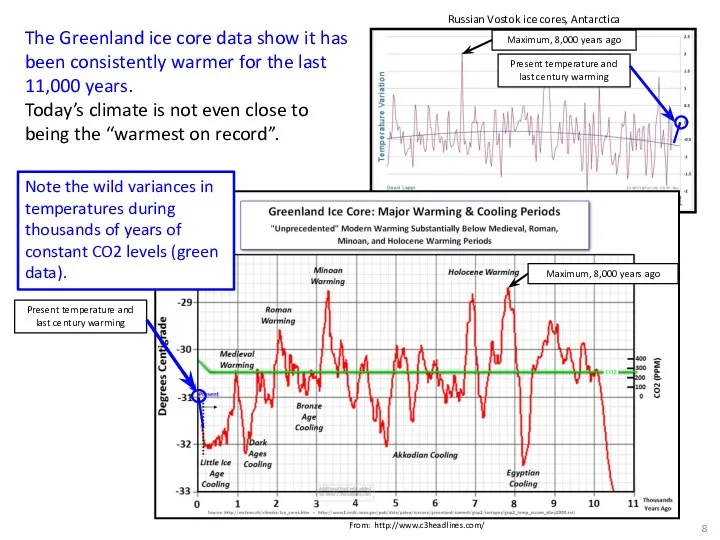
The Greenland ice core data show it has been consistently warmer
The Greenland ice core data show it has been consistently warmer
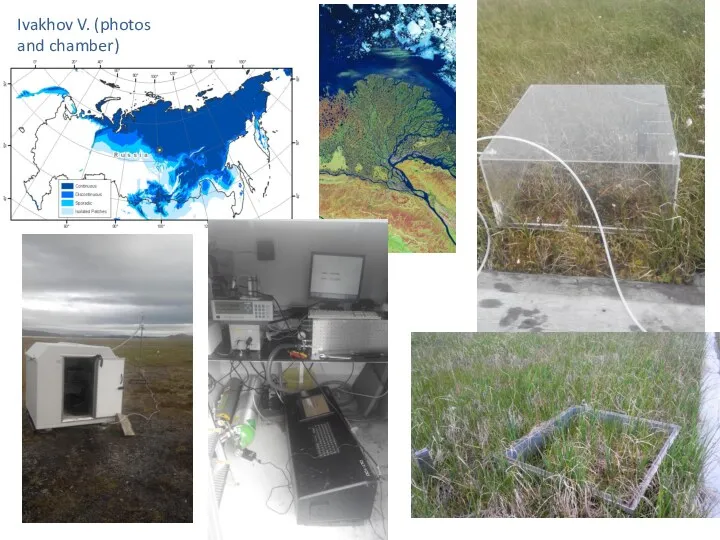
Ivakhov V. (photos and chamber)
Ivakhov V. (photos and chamber)
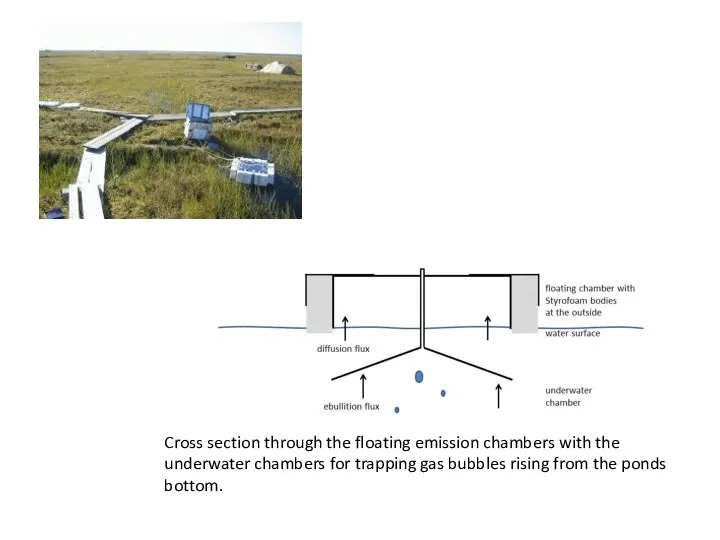
Cross section through the floating emission chambers with the underwater chambers
Cross section through the floating emission chambers with the underwater chambers
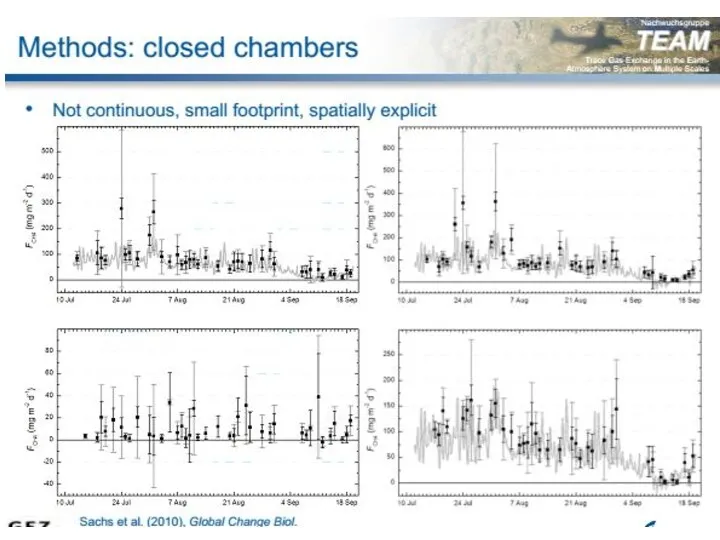
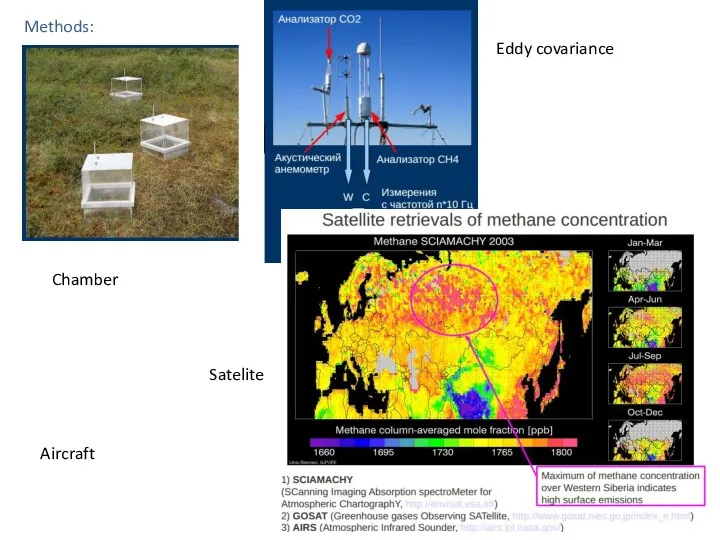
Methods:
Chamber
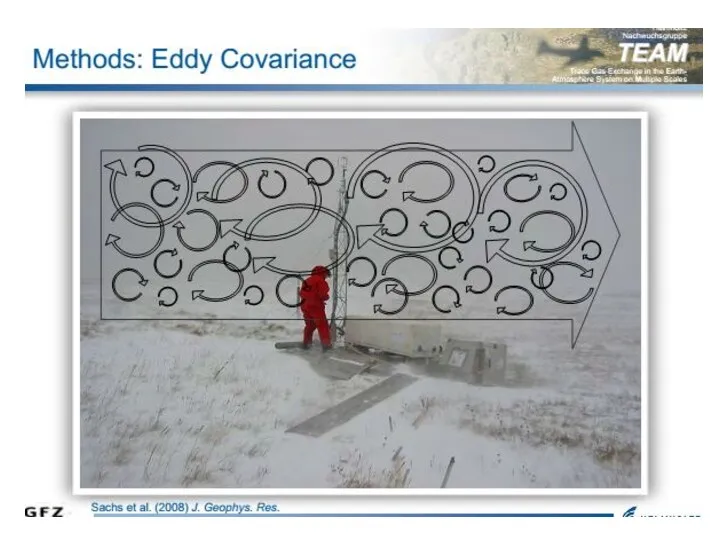
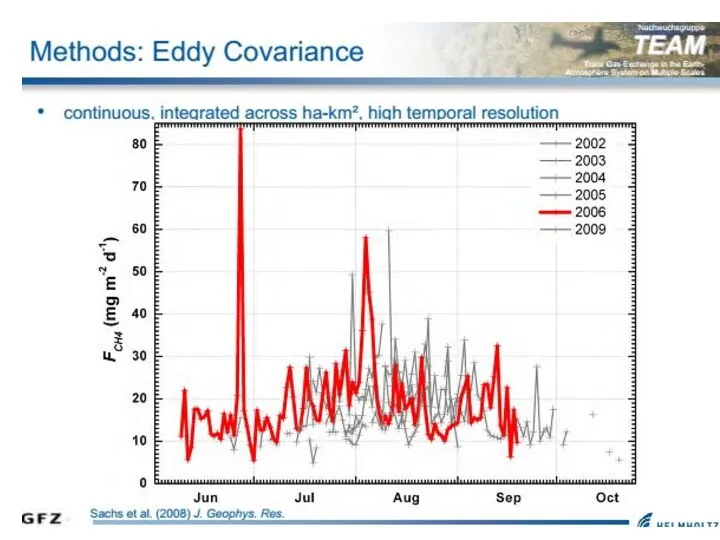
Eddy covariance
Satelite
Aircraft
Methods:
Chamber
Eddy covariance
Satelite
Aircraft
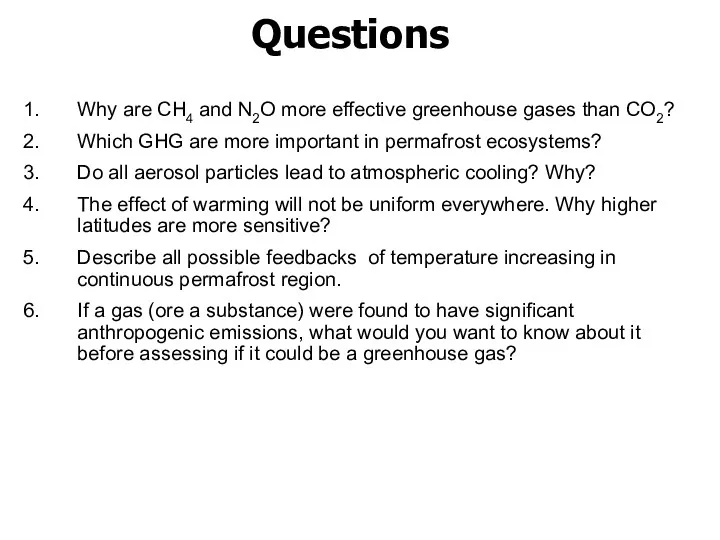
Questions
Why are CH4 and N2O more effective greenhouse gases than CO2?
Which
Questions
Why are CH4 and N2O more effective greenhouse gases than CO2?
Which
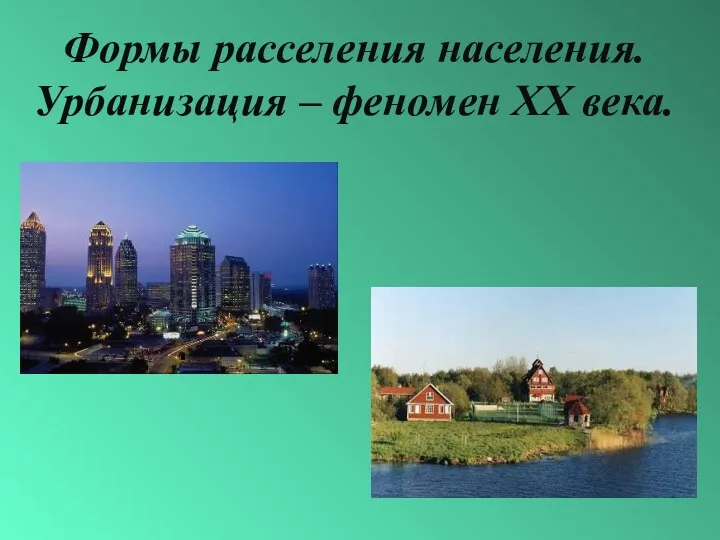 Формы расселения населения. Урбанизация – феномен ХХ века
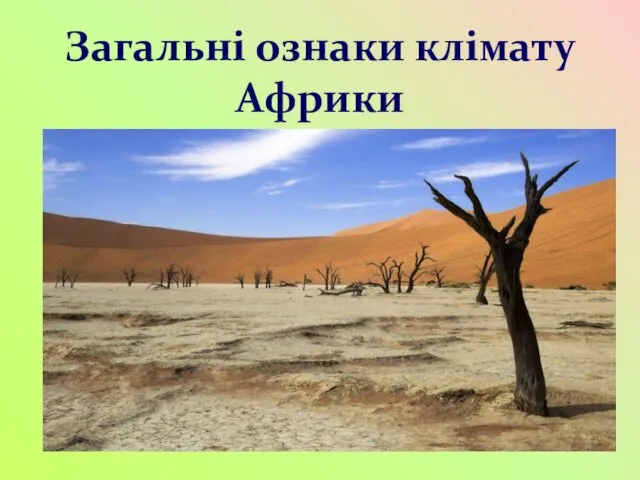 Загальні ознаки клімату Африки
 Почему идёт дождь. 1 класс
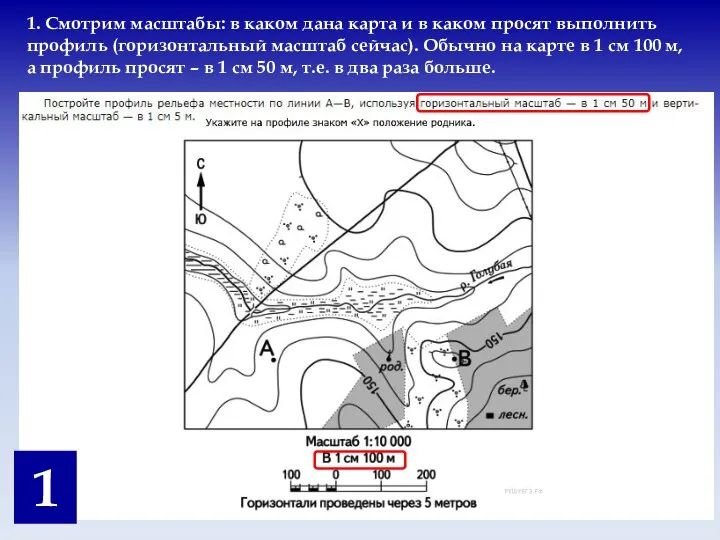 Профиль рельефа. Подготовка к ЕГЭ
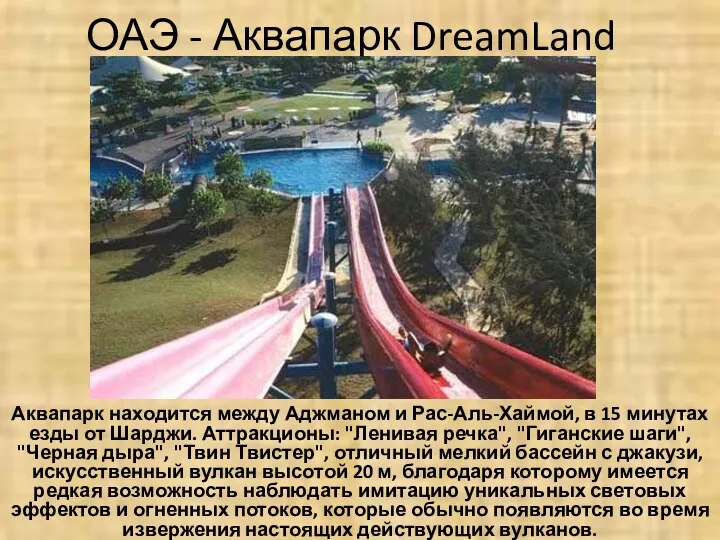 Объединённые Арабские Эмираты (ОАЭ)
 Европейский Север
 Город Мурманск
 Рельеф Земли. Равнины. Горы
 Атлантический океан
 Основы литологии. Раздел 2
 Лесные ресурсы
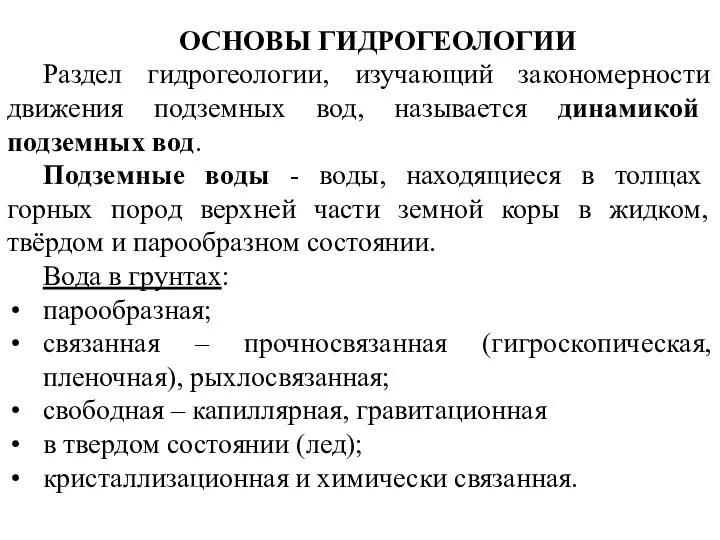 Основы гидрогеологии
 Виробництво транспортних засобів та електроніки, фармацевтичної продукції
 Самарская Лука
 Океанические течения
 Географическая оболочка Земли
 Человек в ландшафте
 Таежные ландшафты
 Влажность воздуха. Способы определения влажности воздуха
 Солтүстік Қазақстан облысы
 Разнообразие природы родного края. Нижегородская область. 3 класс
 Магматические горные породы
 Вода на Земле
 География в эпоху Средневековья на Руси
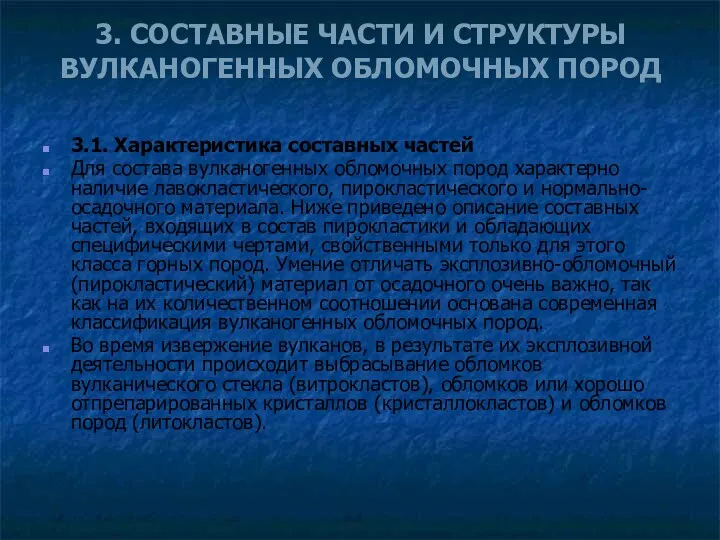 Составные части и структуры вулканогенных обломочных пород
 Горнодобывающая промышленность
 Экскурсия по достопримечательностям кинематографа в Нью – Йорке
 Остров Врангеля