- Cluster analysis. (Lecture 6-8)

Содержание
- 2. * Data Mining: Concepts and Techniques Chapter 8. Cluster Analysis What is Cluster Analysis? Types of
- 3. What is Cluster Analysis? Cluster: a collection of data objects Similar to one another within the
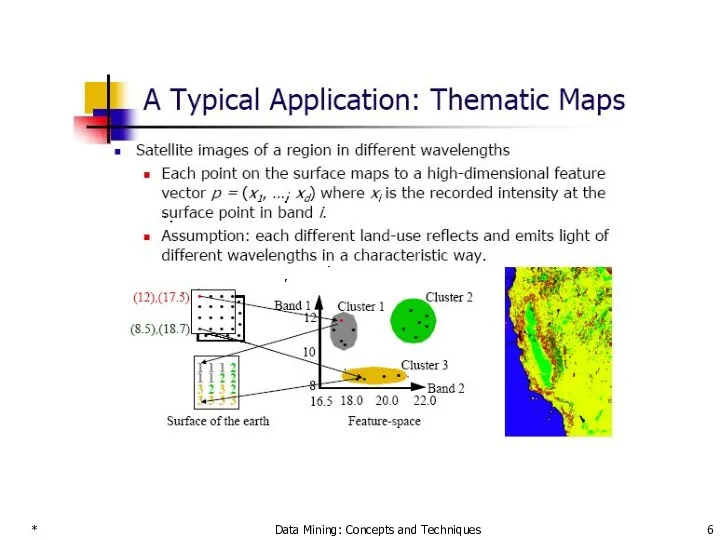
- 4. * Data Mining: Concepts and Techniques General Applications of Clustering Pattern Recognition Spatial Data Analysis create
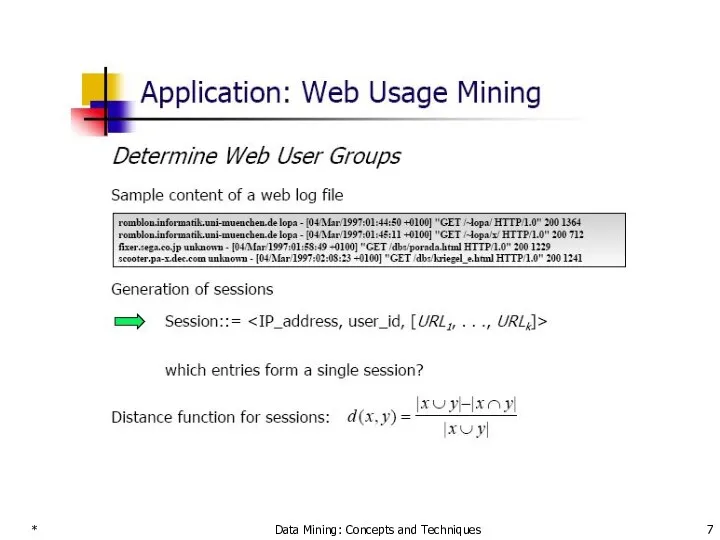
- 5. * Data Mining: Concepts and Techniques Examples of Clustering Applications Marketing: Help marketers discover distinct groups
- 6. * Data Mining: Concepts and Techniques
- 7. * Data Mining: Concepts and Techniques
- 8. * Data Mining: Concepts and Techniques
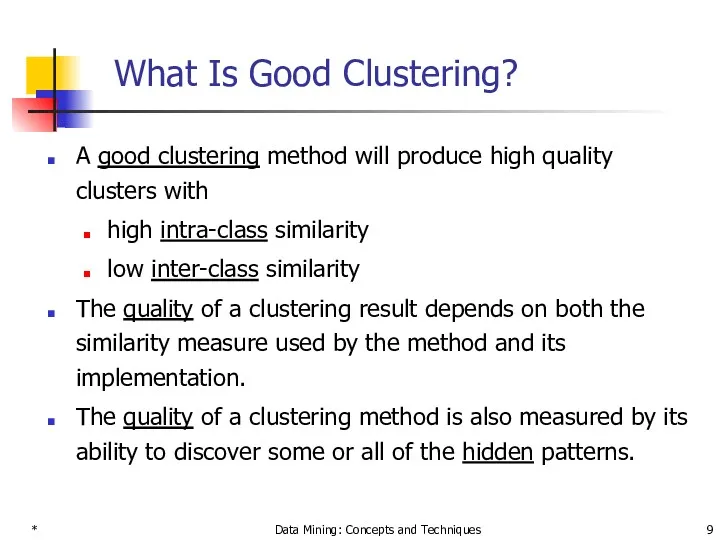
- 9. * Data Mining: Concepts and Techniques What Is Good Clustering? A good clustering method will produce
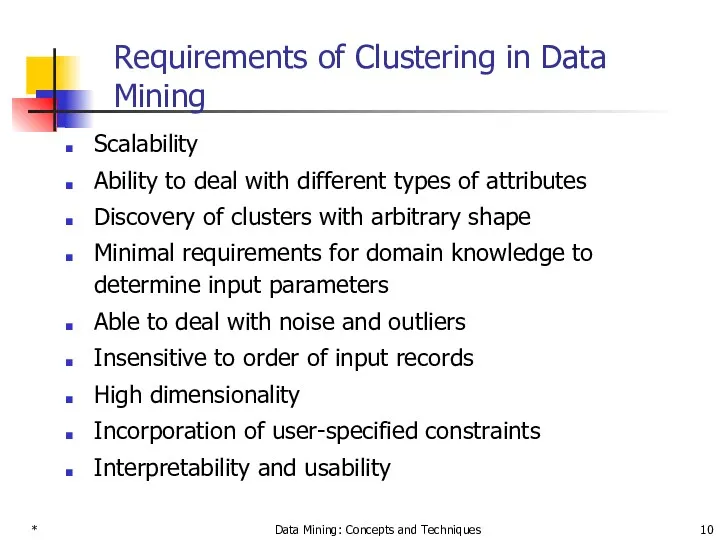
- 10. * Data Mining: Concepts and Techniques Requirements of Clustering in Data Mining Scalability Ability to deal
- 11. * Data Mining: Concepts and Techniques Chapter 8. Cluster Analysis What is Cluster Analysis? Types of
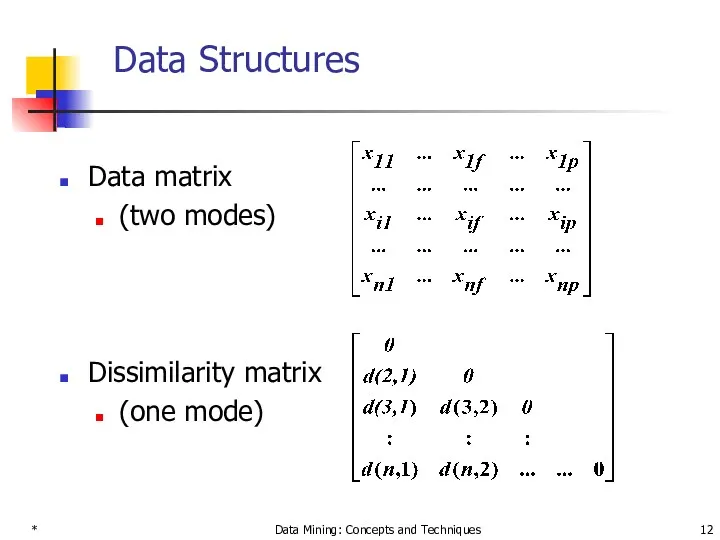
- 12. * Data Mining: Concepts and Techniques Data Structures Data matrix (two modes) Dissimilarity matrix (one mode)
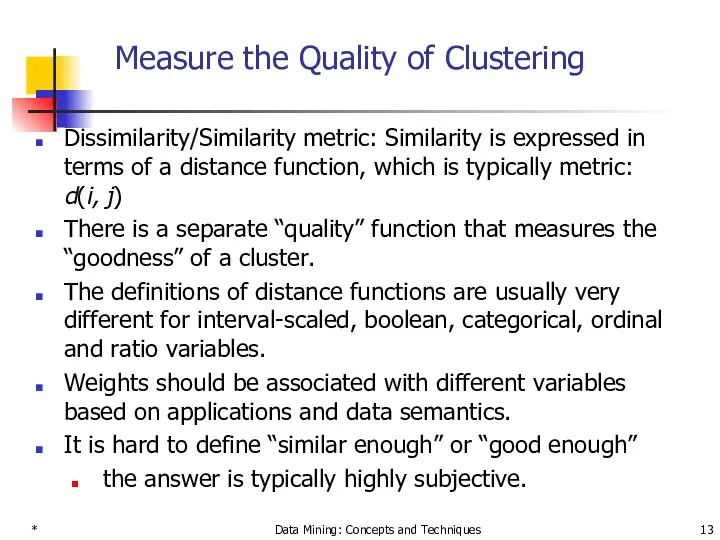
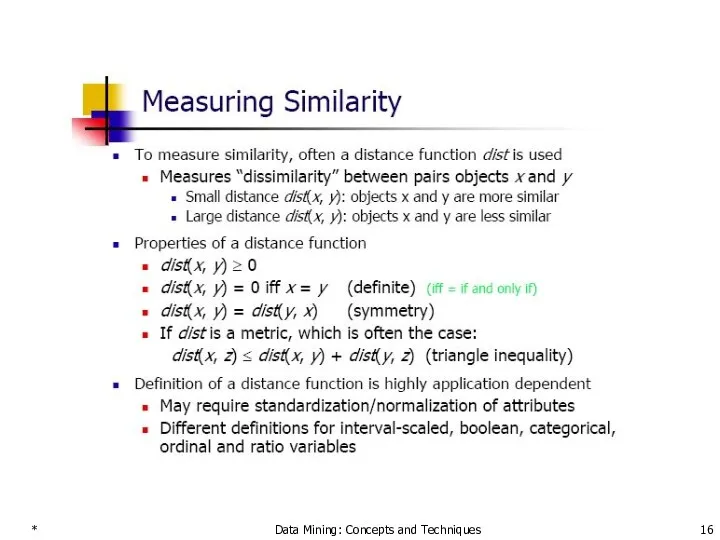
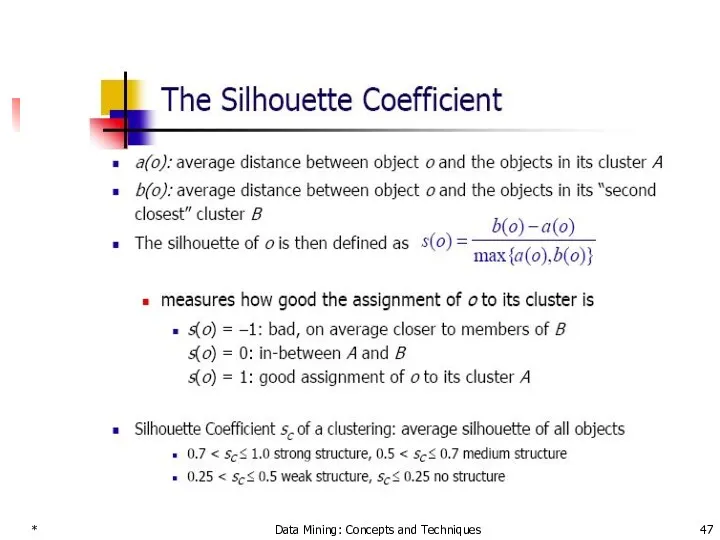
- 13. * Data Mining: Concepts and Techniques Measure the Quality of Clustering Dissimilarity/Similarity metric: Similarity is expressed
- 14. * Data Mining: Concepts and Techniques
- 15. * Data Mining: Concepts and Techniques
- 16. * Data Mining: Concepts and Techniques
- 17. * Data Mining: Concepts and Techniques Type of data in clustering analysis Interval-scaled variables: Binary variables:
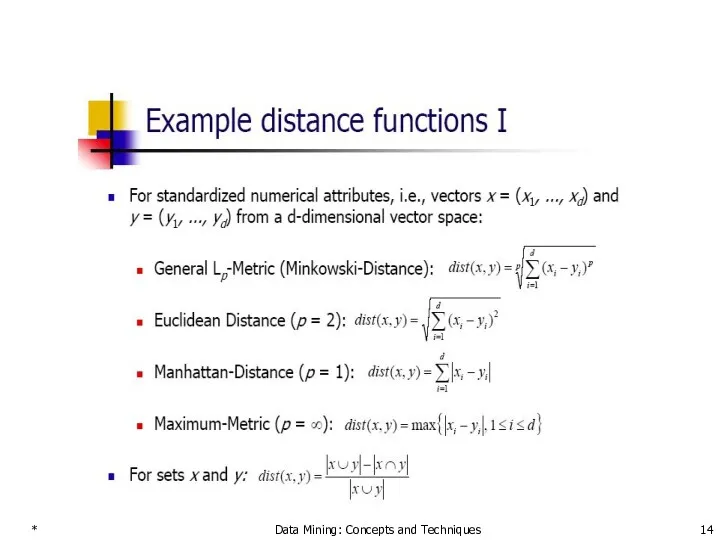
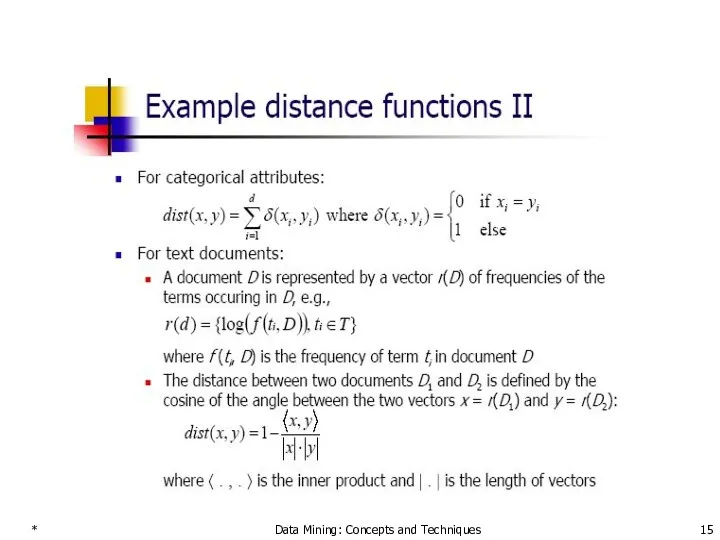
- 18. * Data Mining: Concepts and Techniques Interval-valued variables Standardize data Calculate the mean absolute deviation: where
- 19. * Data Mining: Concepts and Techniques Binary Variables A contingency table for binary data Simple matching
- 20. * Data Mining: Concepts and Techniques Binary Variables Association coefficient Yule: Q(i,j)= ad-bc/ ad+bc Rassel and
- 21. * Data Mining: Concepts and Techniques Dissimilarity between Binary Variables Example gender is a symmetric attribute
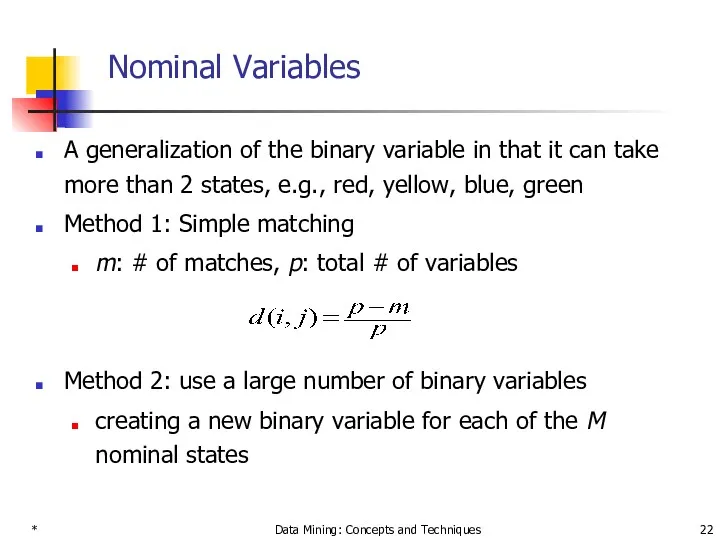
- 22. * Data Mining: Concepts and Techniques Nominal Variables A generalization of the binary variable in that
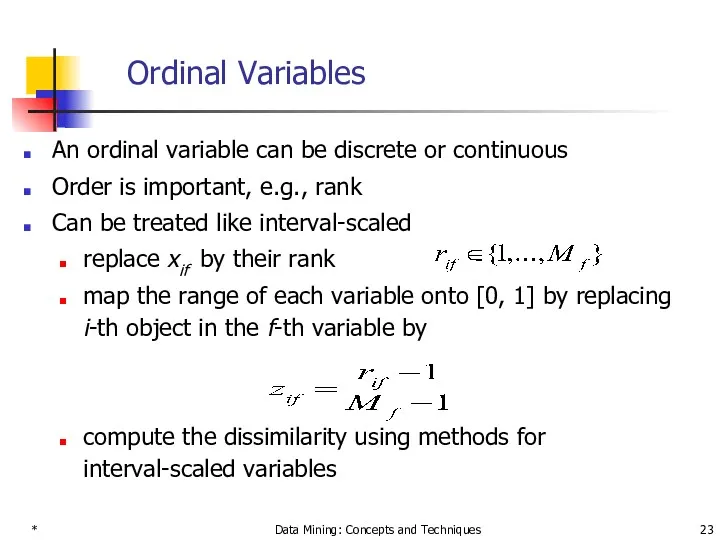
- 23. * Data Mining: Concepts and Techniques Ordinal Variables An ordinal variable can be discrete or continuous
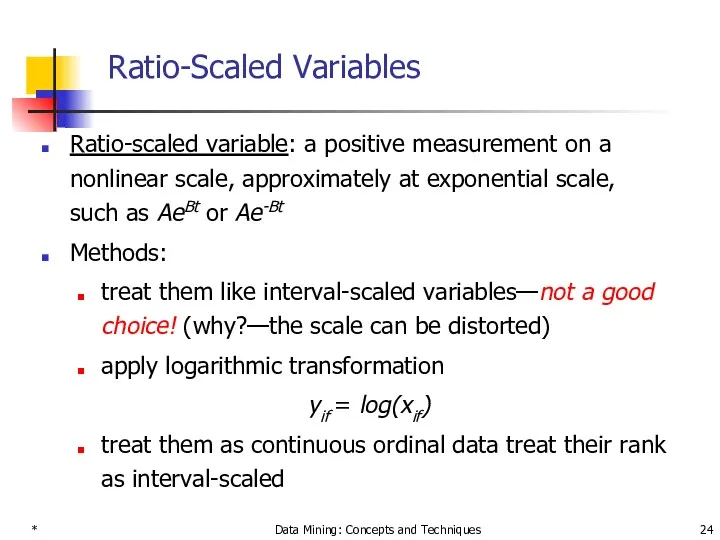
- 24. * Data Mining: Concepts and Techniques Ratio-Scaled Variables Ratio-scaled variable: a positive measurement on a nonlinear
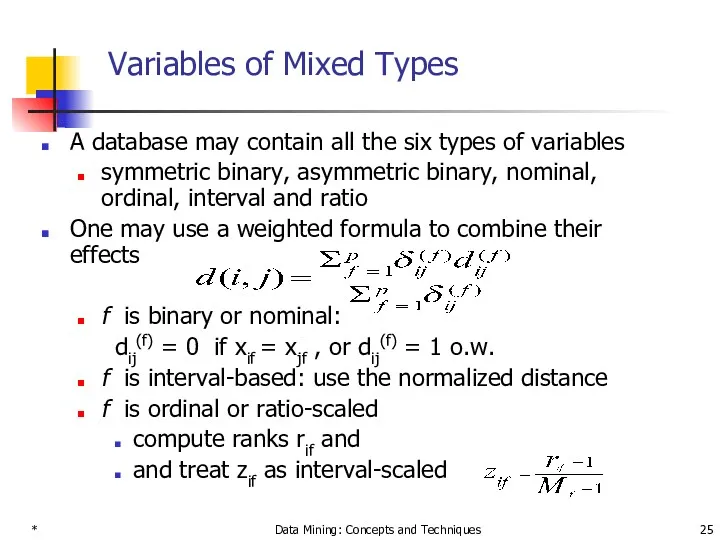
- 25. * Data Mining: Concepts and Techniques Variables of Mixed Types A database may contain all the
- 26. * Data Mining: Concepts and Techniques Chapter 8. Cluster Analysis What is Cluster Analysis? Types of
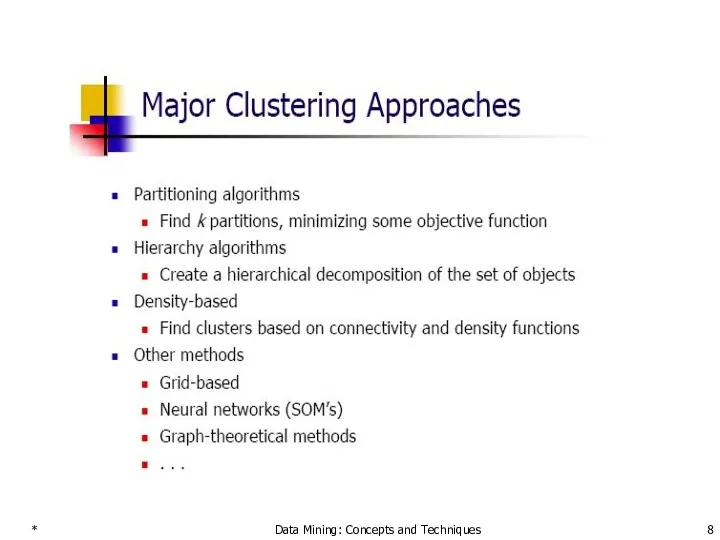
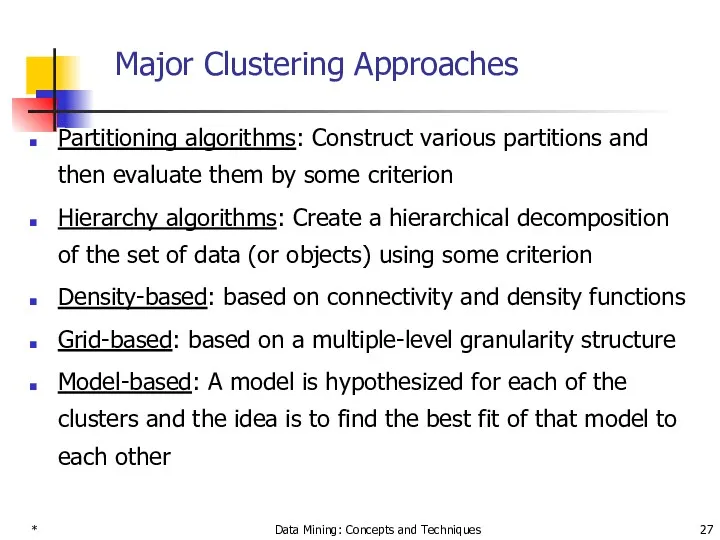
- 27. * Data Mining: Concepts and Techniques Major Clustering Approaches Partitioning algorithms: Construct various partitions and then
- 28. * Data Mining: Concepts and Techniques Chapter 8. Cluster Analysis What is Cluster Analysis? Types of
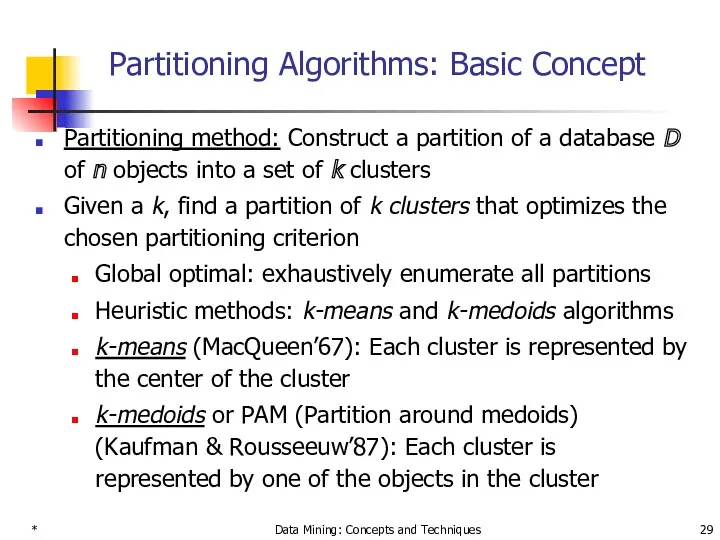
- 29. * Data Mining: Concepts and Techniques Partitioning Algorithms: Basic Concept Partitioning method: Construct a partition of
- 30. * Data Mining: Concepts and Techniques
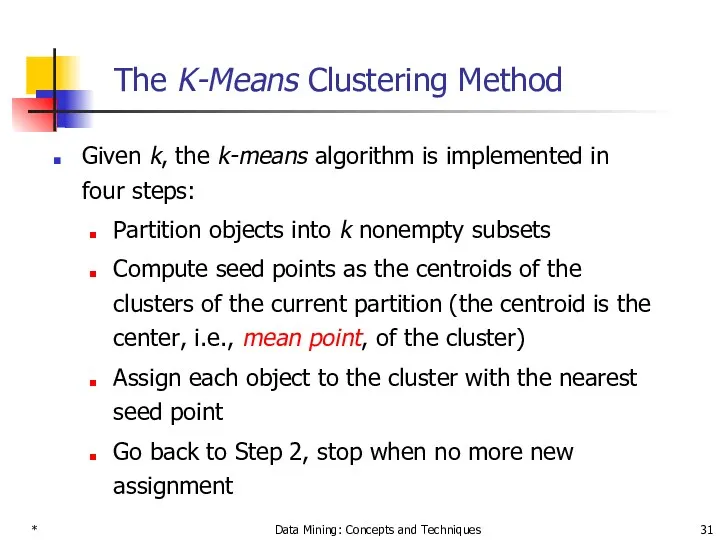
- 31. * Data Mining: Concepts and Techniques The K-Means Clustering Method Given k, the k-means algorithm is
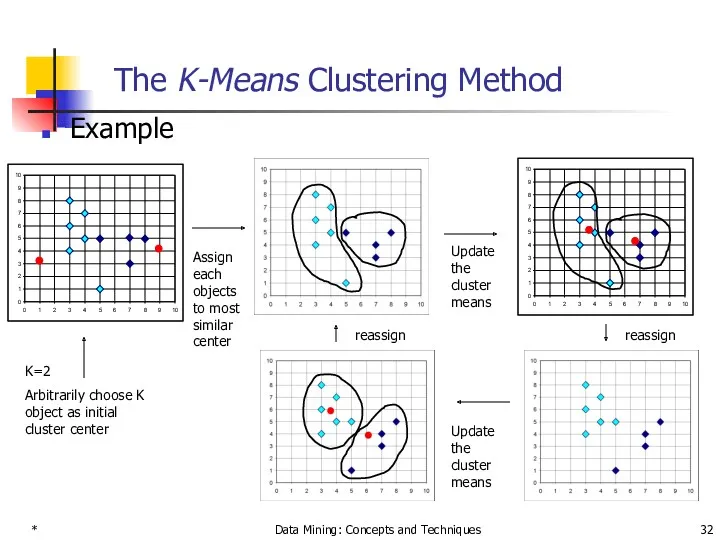
- 32. * Data Mining: Concepts and Techniques The K-Means Clustering Method Example 0 1 2 3 4
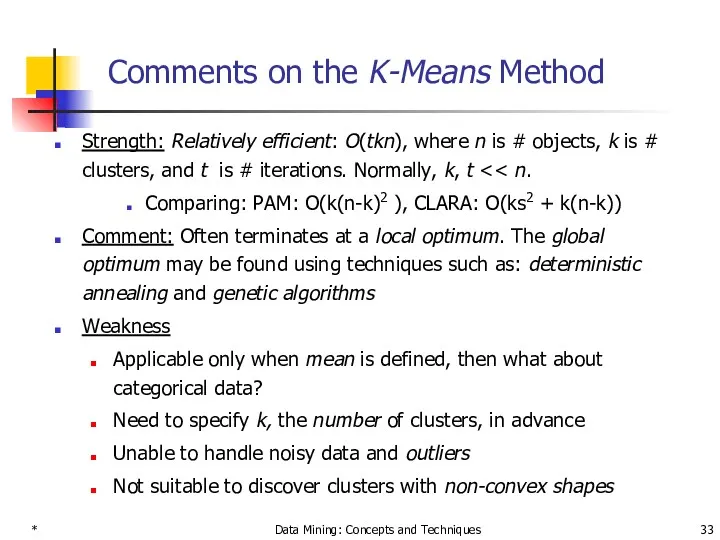
- 33. * Data Mining: Concepts and Techniques Comments on the K-Means Method Strength: Relatively efficient: O(tkn), where
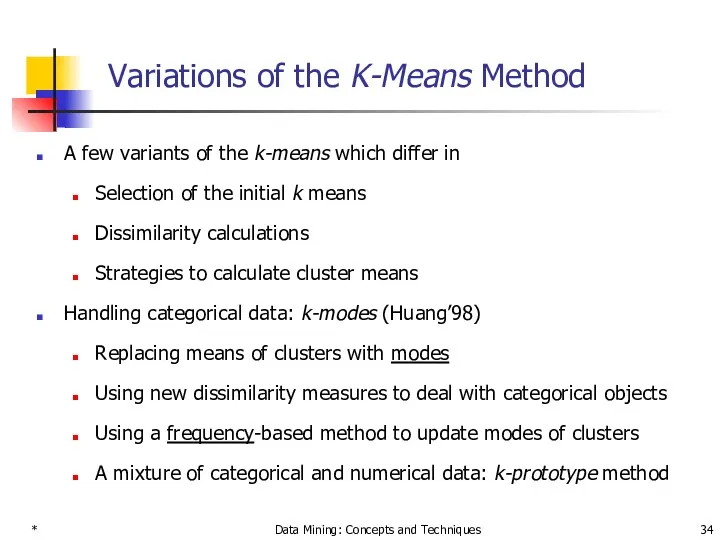
- 34. * Data Mining: Concepts and Techniques Variations of the K-Means Method A few variants of the
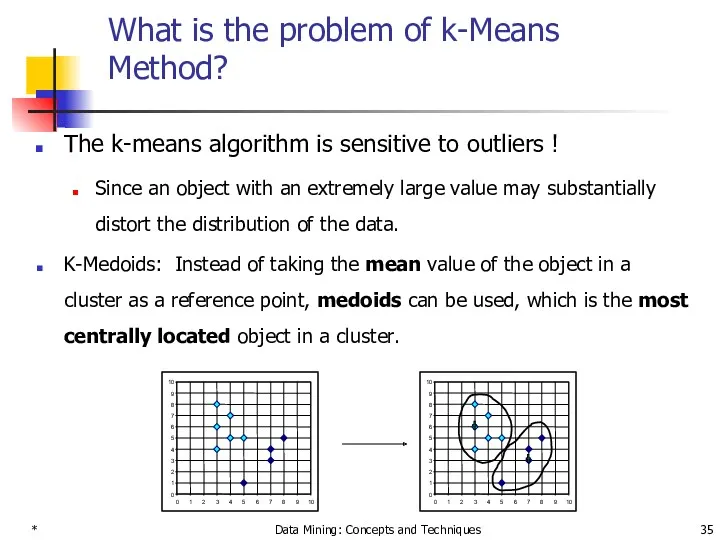
- 35. * Data Mining: Concepts and Techniques What is the problem of k-Means Method? The k-means algorithm
- 36. * Data Mining: Concepts and Techniques
- 37. * Data Mining: Concepts and Techniques
- 38. * Data Mining: Concepts and Techniques
- 39. * Data Mining: Concepts and Techniques Typical k-medoids algorithm (PAM) Total Cost = 20 0 1
- 40. * Data Mining: Concepts and Techniques What is the problem with PAM? Pam is more robust
- 41. * Data Mining: Concepts and Techniques
- 42. * Data Mining: Concepts and Techniques CLARA (Clustering Large Applications) (1990) CLARA (Kaufmann and Rousseeuw in
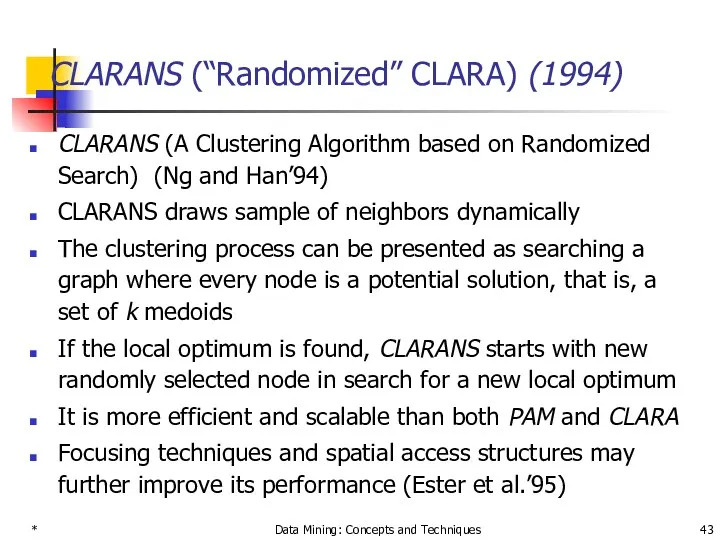
- 43. * Data Mining: Concepts and Techniques CLARANS (“Randomized” CLARA) (1994) CLARANS (A Clustering Algorithm based on
- 44. * Data Mining: Concepts and Techniques
- 45. * Data Mining: Concepts and Techniques
- 46. * Data Mining: Concepts and Techniques
- 47. * Data Mining: Concepts and Techniques
- 48. * Data Mining: Concepts and Techniques Chapter 8. Cluster Analysis What is Cluster Analysis? Types of
- 49. * Data Mining: Concepts and Techniques
- 50. * Data Mining: Concepts and Techniques
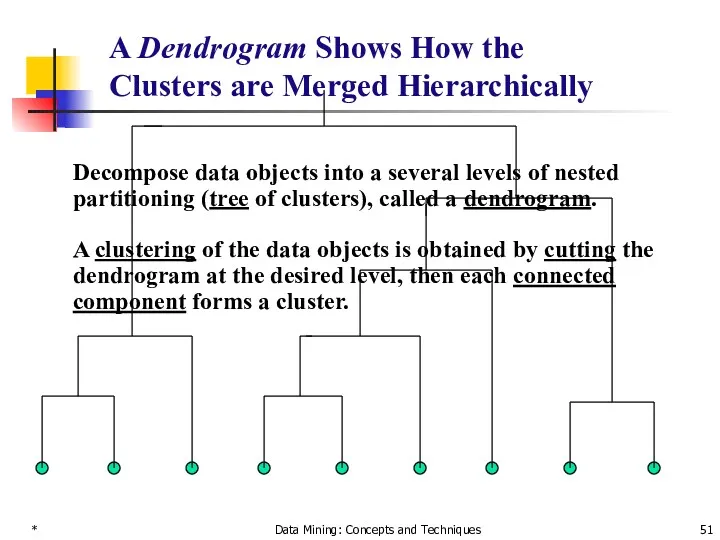
- 51. * Data Mining: Concepts and Techniques A Dendrogram Shows How the Clusters are Merged Hierarchically Decompose
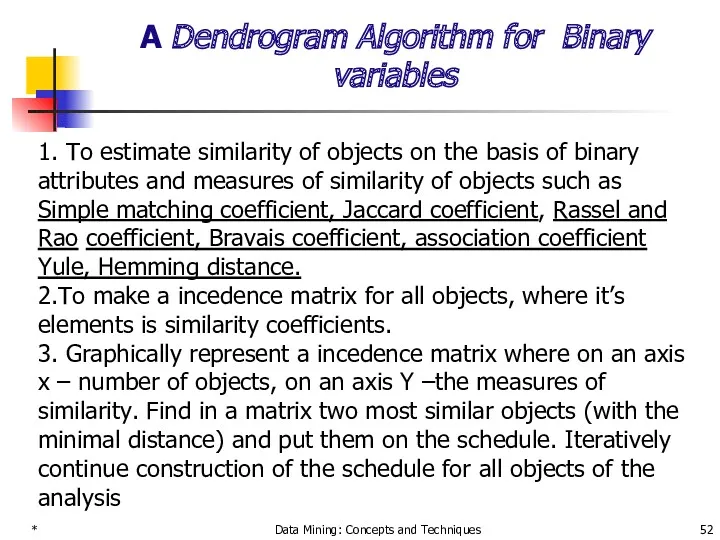
- 52. * Data Mining: Concepts and Techniques A Dendrogram Algorithm for Binary variables 1. To estimate similarity
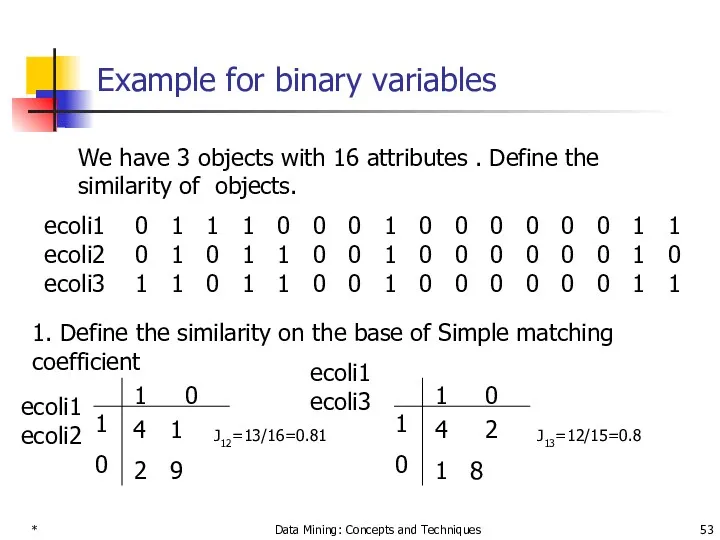
- 53. * Data Mining: Concepts and Techniques Example for binary variables ecoli1 0 1 1 1 0
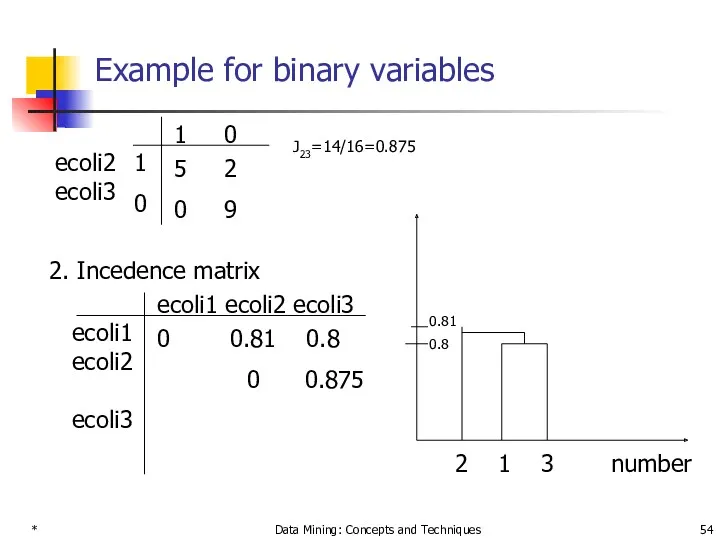
- 54. * Data Mining: Concepts and Techniques ecoli2 ecoli3 J23=14/16=0.875 2. Incedence matrix ecoli1 ecoli2 ecoli3 ecoli1
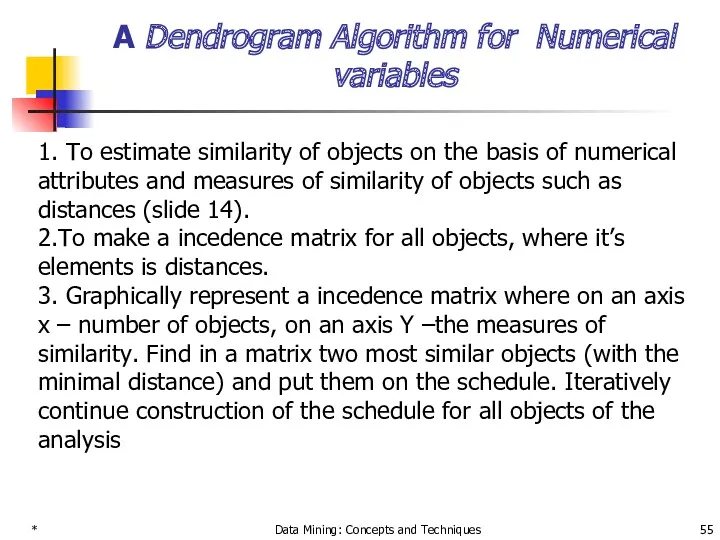
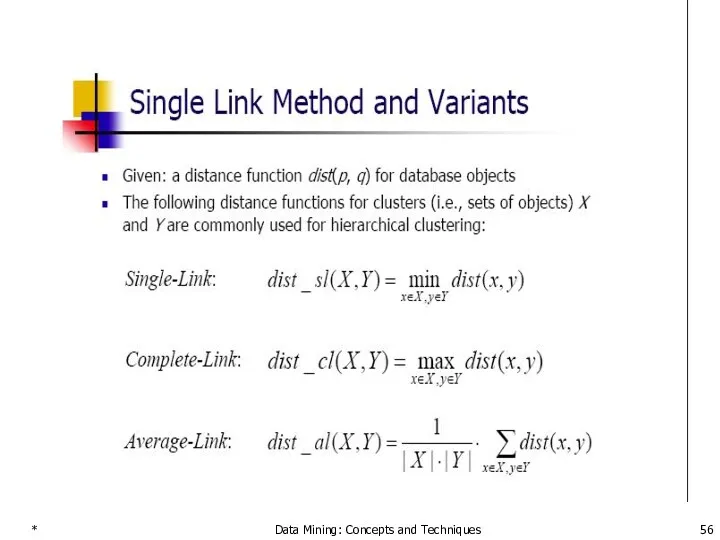
- 55. * Data Mining: Concepts and Techniques A Dendrogram Algorithm for Numerical variables 1. To estimate similarity
- 56. * Data Mining: Concepts and Techniques
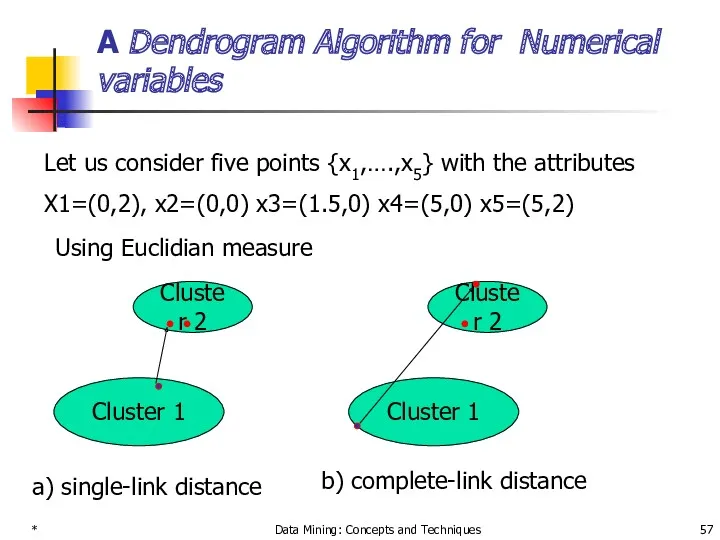
- 57. * Data Mining: Concepts and Techniques A Dendrogram Algorithm for Numerical variables Let us consider five
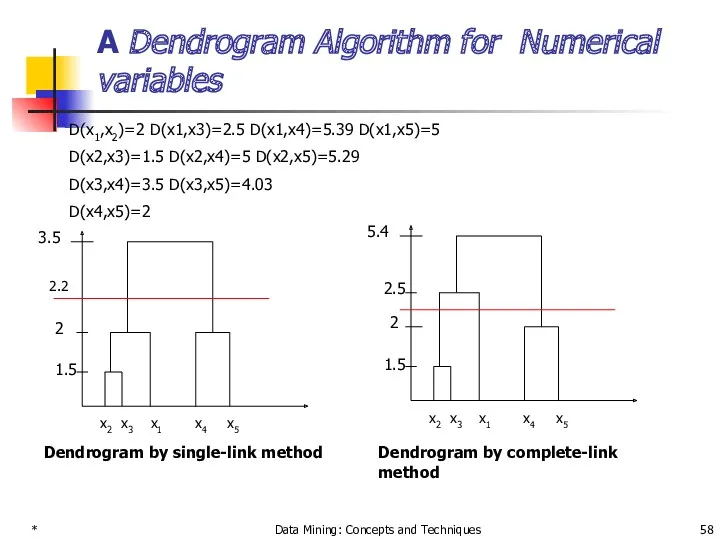
- 58. * Data Mining: Concepts and Techniques A Dendrogram Algorithm for Numerical variables D(x1,x2)=2 D(x1,x3)=2.5 D(x1,x4)=5.39 D(x1,x5)=5
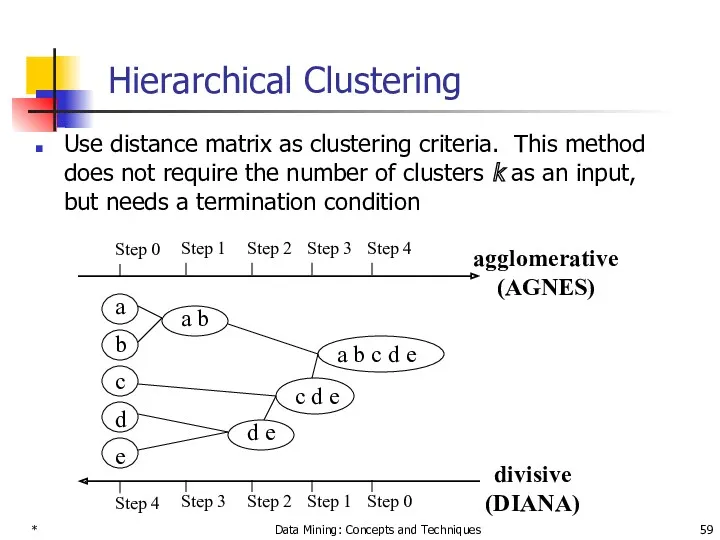
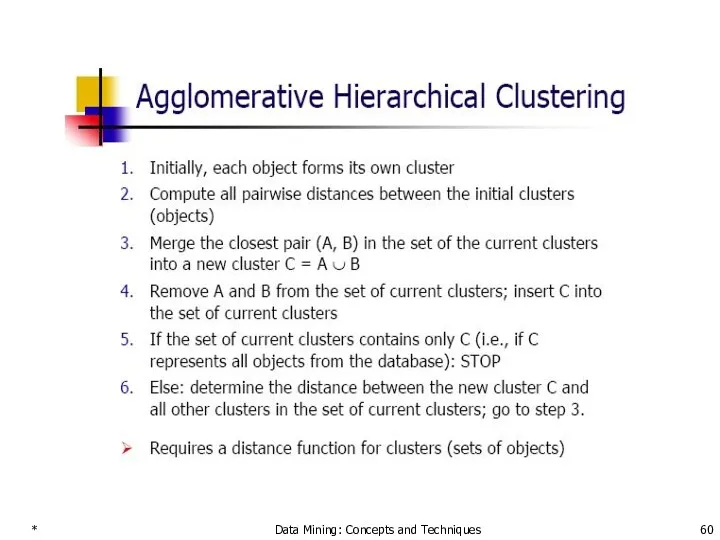
- 59. * Data Mining: Concepts and Techniques Hierarchical Clustering Use distance matrix as clustering criteria. This method
- 60. * Data Mining: Concepts and Techniques
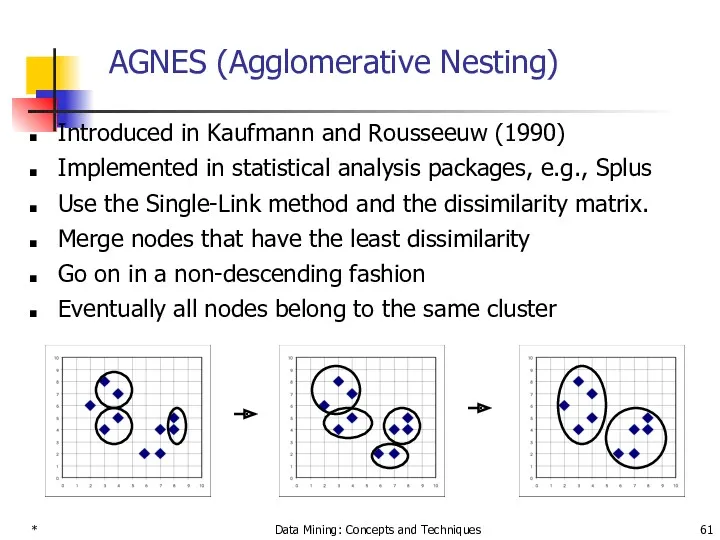
- 61. * Data Mining: Concepts and Techniques AGNES (Agglomerative Nesting) Introduced in Kaufmann and Rousseeuw (1990) Implemented
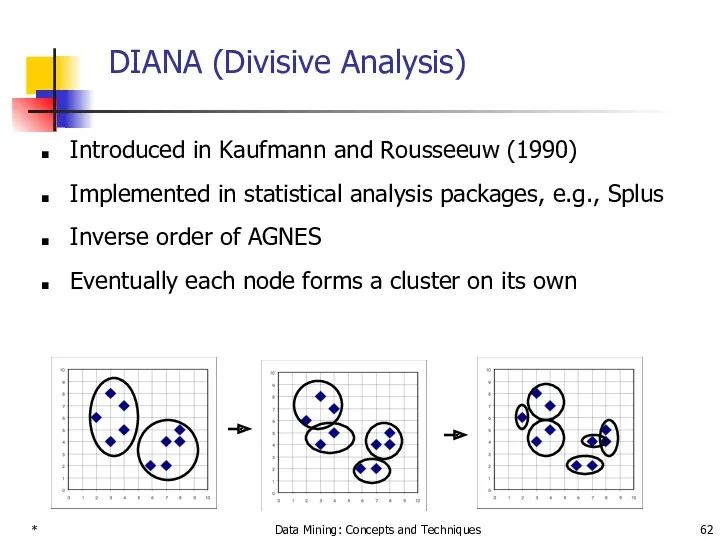
- 62. * Data Mining: Concepts and Techniques DIANA (Divisive Analysis) Introduced in Kaufmann and Rousseeuw (1990) Implemented
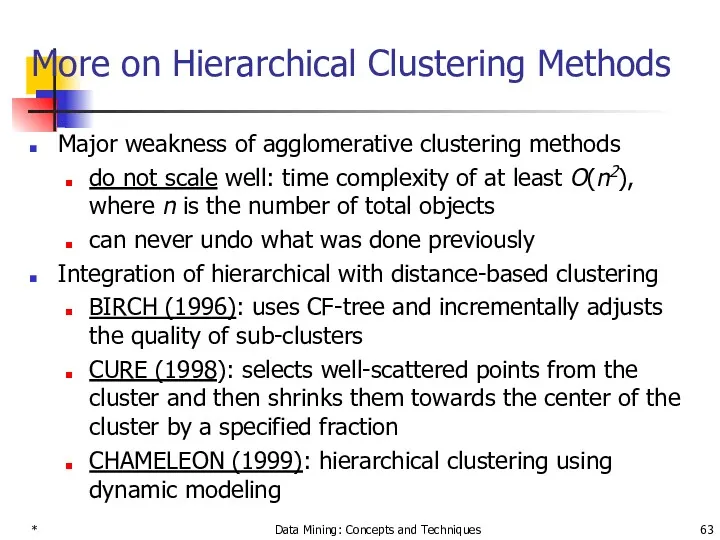
- 63. * Data Mining: Concepts and Techniques More on Hierarchical Clustering Methods Major weakness of agglomerative clustering
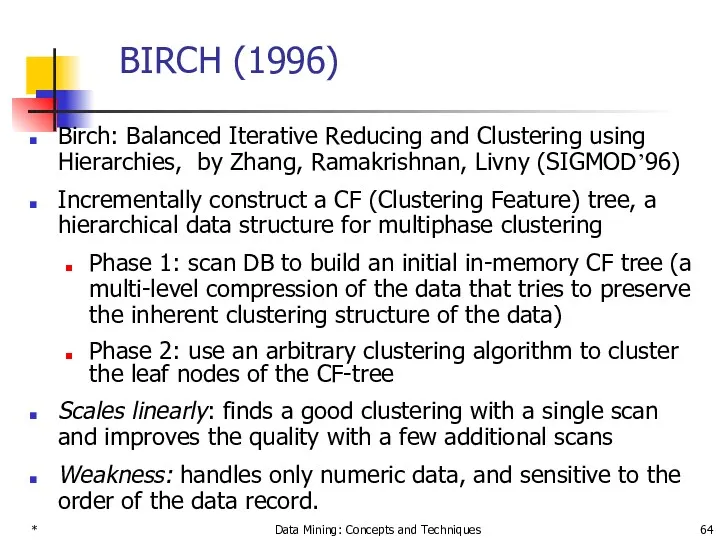
- 64. * Data Mining: Concepts and Techniques BIRCH (1996) Birch: Balanced Iterative Reducing and Clustering using Hierarchies,
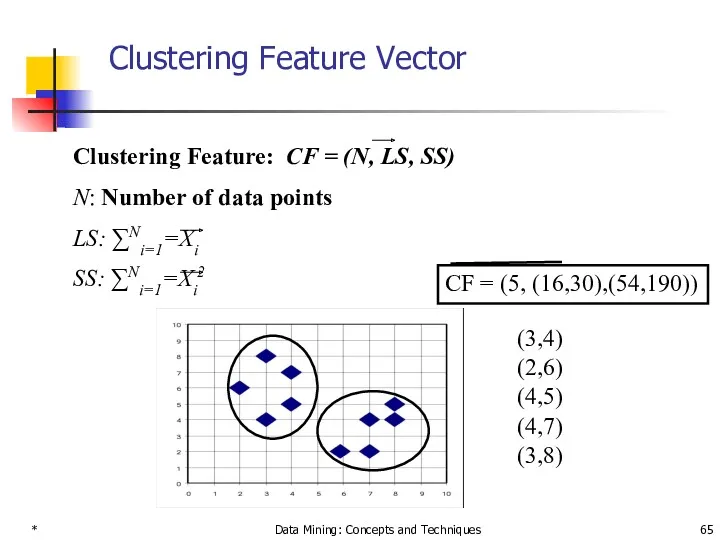
- 65. * Data Mining: Concepts and Techniques Clustering Feature Vector CF = (5, (16,30),(54,190)) (3,4) (2,6) (4,5)
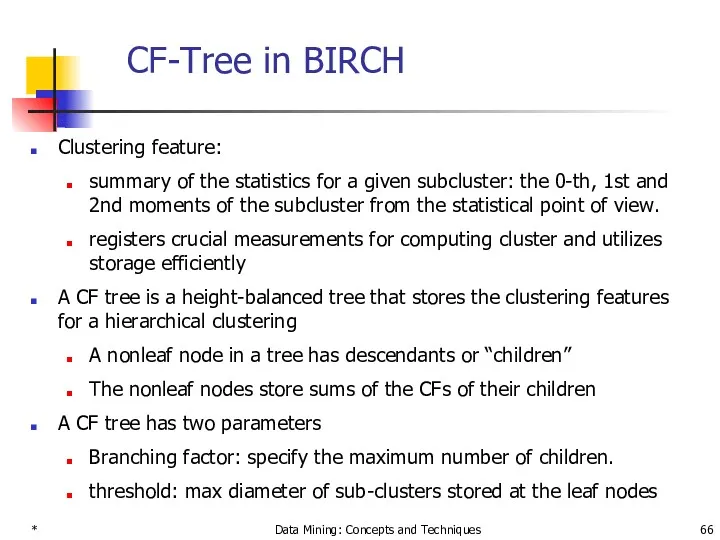
- 66. * Data Mining: Concepts and Techniques CF-Tree in BIRCH Clustering feature: summary of the statistics for
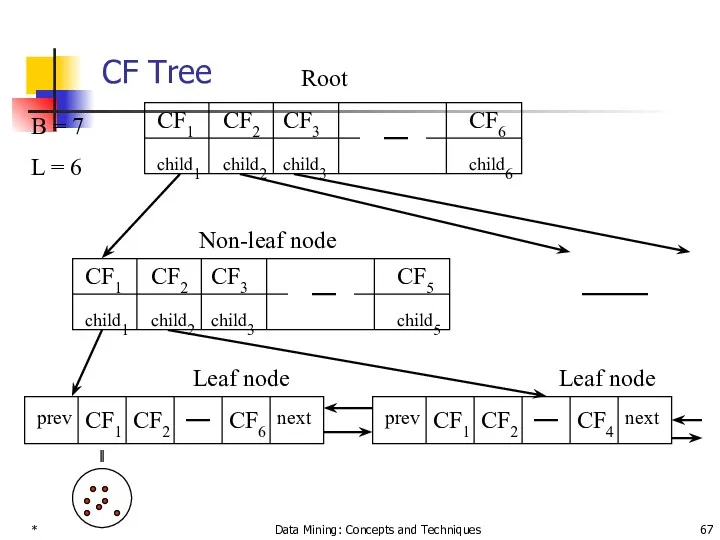
- 67. * Data Mining: Concepts and Techniques CF Tree CF1 child1 CF3 child3 CF2 child2 CF5 child5
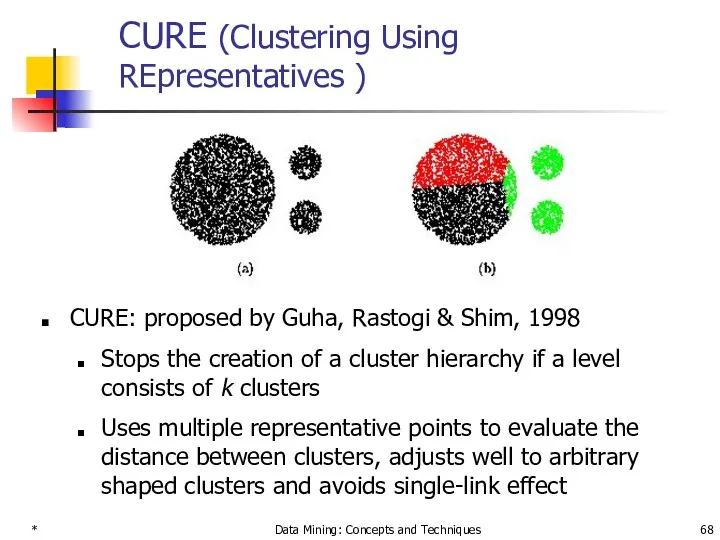
- 68. * Data Mining: Concepts and Techniques CURE (Clustering Using REpresentatives ) CURE: proposed by Guha, Rastogi
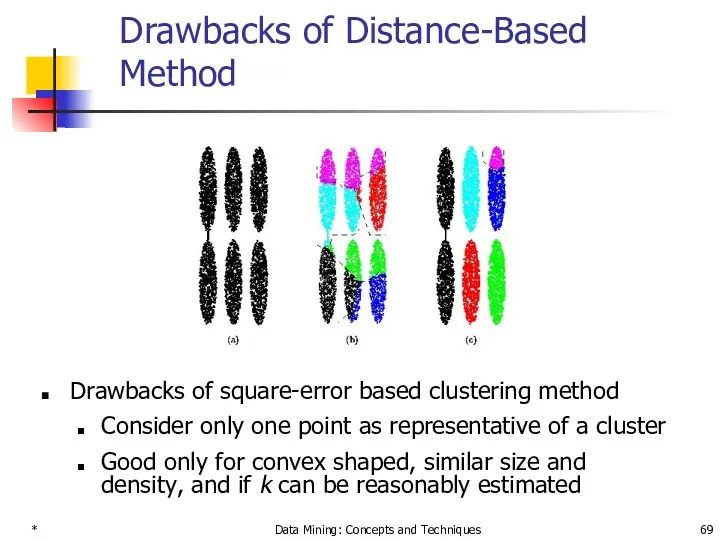
- 69. * Data Mining: Concepts and Techniques Drawbacks of Distance-Based Method Drawbacks of square-error based clustering method
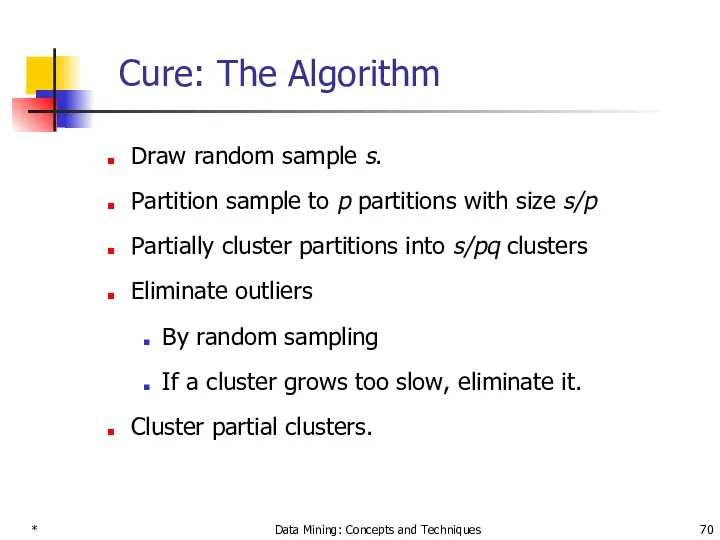
- 70. * Data Mining: Concepts and Techniques Cure: The Algorithm Draw random sample s. Partition sample to
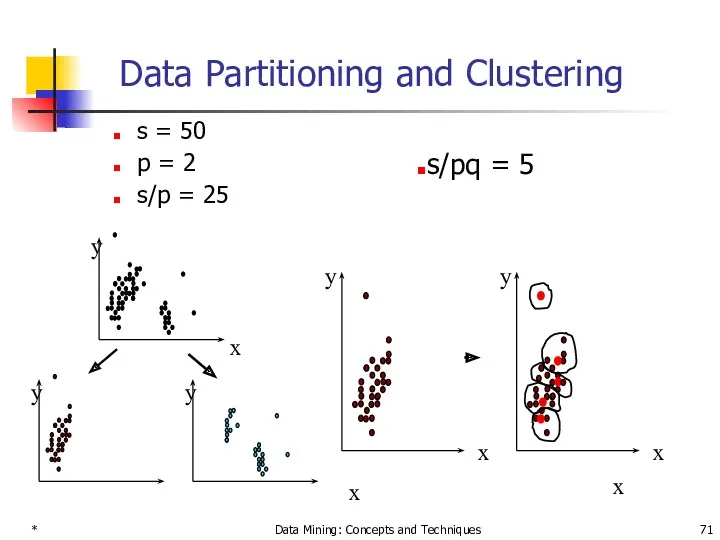
- 71. * Data Mining: Concepts and Techniques Data Partitioning and Clustering s = 50 p = 2
- 72. * Data Mining: Concepts and Techniques Cure: Shrinking Representative Points Shrink the multiple representative points towards
- 73. * Data Mining: Concepts and Techniques Clustering Categorical Data: ROCK ROCK: Robust Clustering using linKs, by
- 74. * Data Mining: Concepts and Techniques Rock: Algorithm Links: The number of common neighbors for the
- 75. * Data Mining: Concepts and Techniques CHAMELEON (Hierarchical clustering using dynamic modeling) CHAMELEON: by G. Karypis,
- 76. * Data Mining: Concepts and Techniques Overall Framework of CHAMELEON Construct Sparse Graph Partition the Graph
- 77. * Data Mining: Concepts and Techniques Chapter 8. Cluster Analysis What is Cluster Analysis? Types of
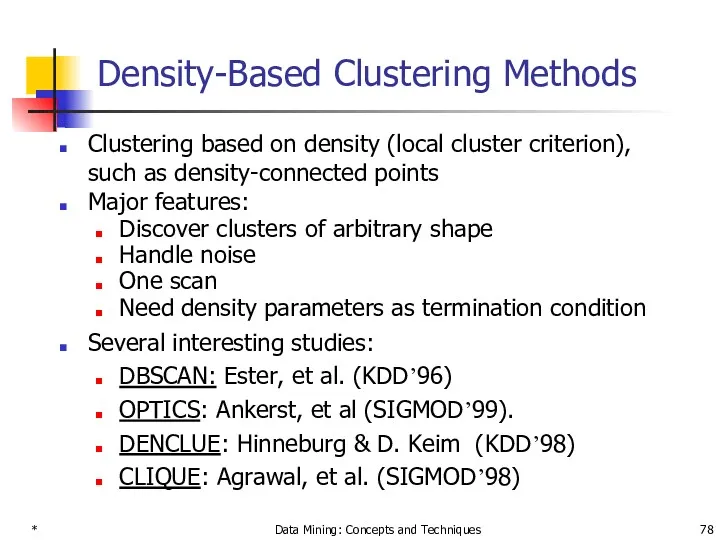
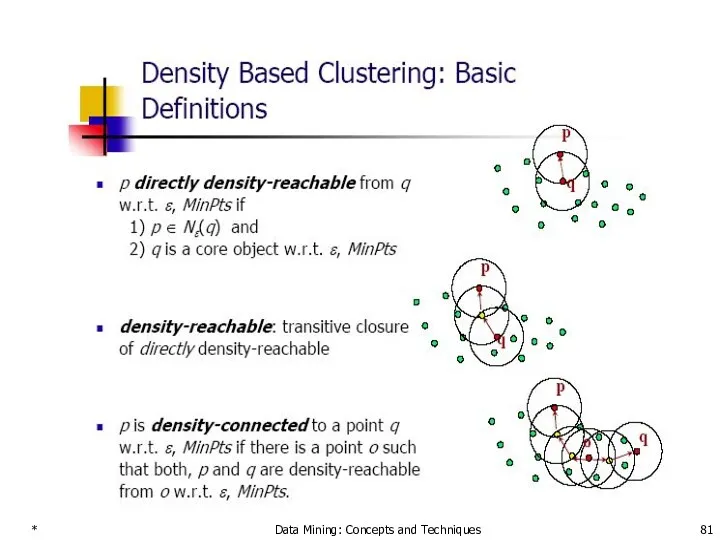
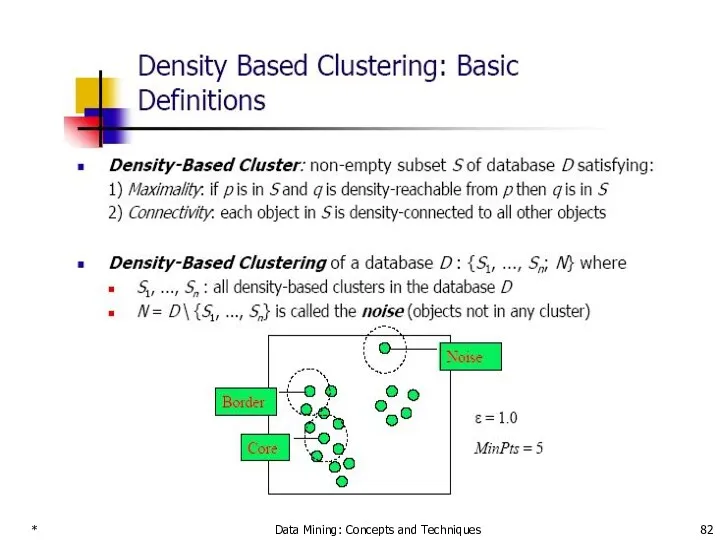
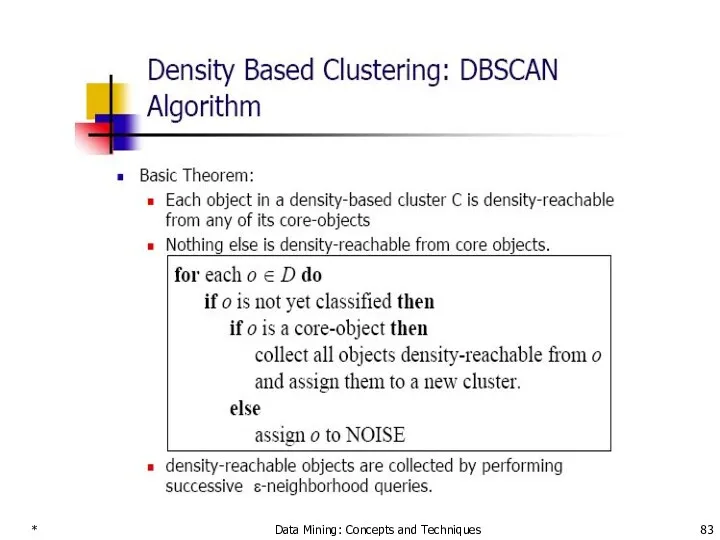
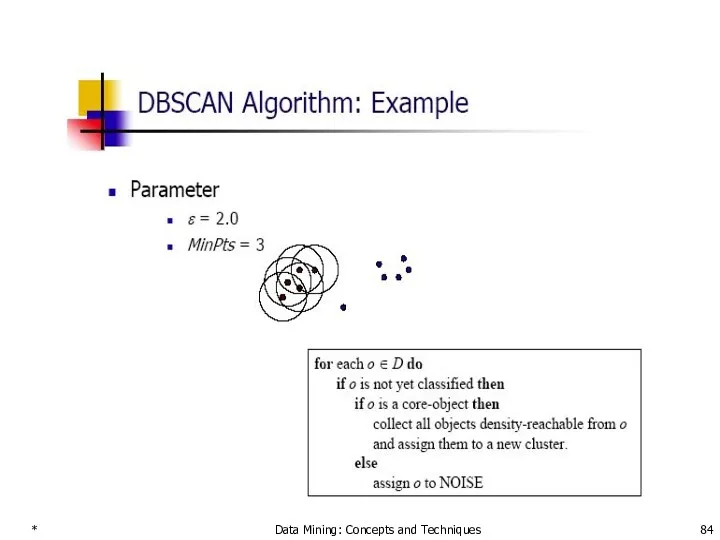
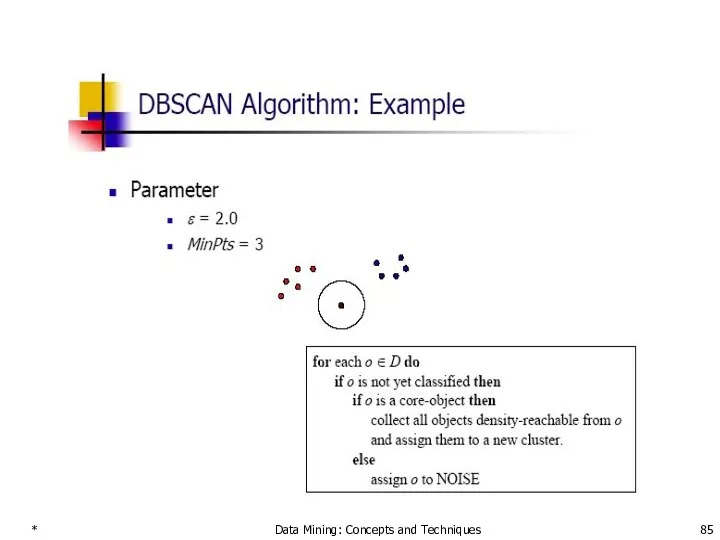
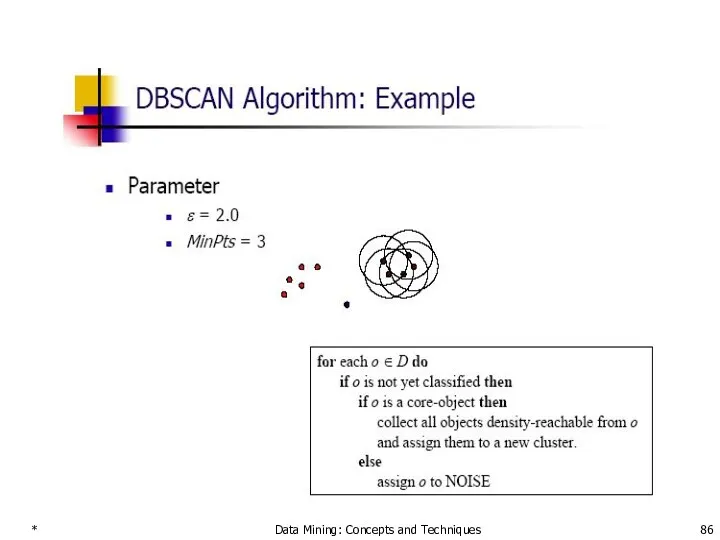
- 78. * Data Mining: Concepts and Techniques Density-Based Clustering Methods Clustering based on density (local cluster criterion),
- 79. * Data Mining: Concepts and Techniques
- 80. * Data Mining: Concepts and Techniques
- 81. * Data Mining: Concepts and Techniques
- 82. * Data Mining: Concepts and Techniques
- 83. * Data Mining: Concepts and Techniques
- 84. * Data Mining: Concepts and Techniques
- 85. * Data Mining: Concepts and Techniques
- 86. * Data Mining: Concepts and Techniques
- 87. * Data Mining: Concepts and Techniques
- 88. * Data Mining: Concepts and Techniques
- 89. * Data Mining: Concepts and Techniques Gradient: The steepness of a slope Example
- 90. * Data Mining: Concepts and Techniques Density Attractor
- 91. * Data Mining: Concepts and Techniques Center-Defined and Arbitrary
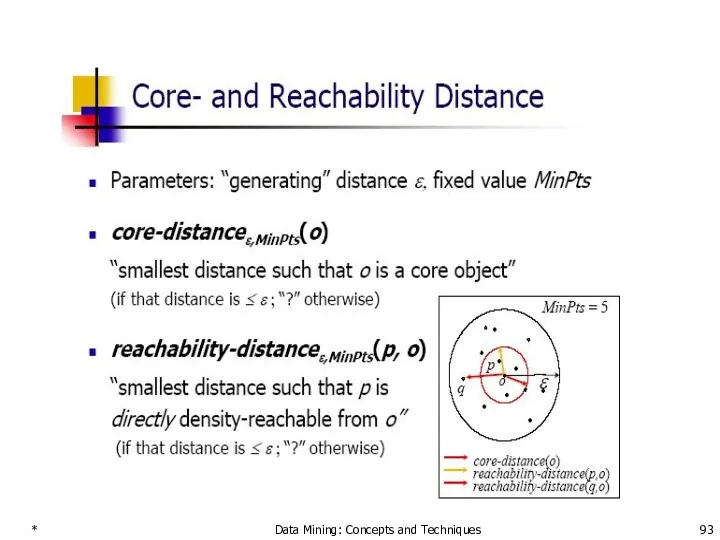
- 92. * Data Mining: Concepts and Techniques
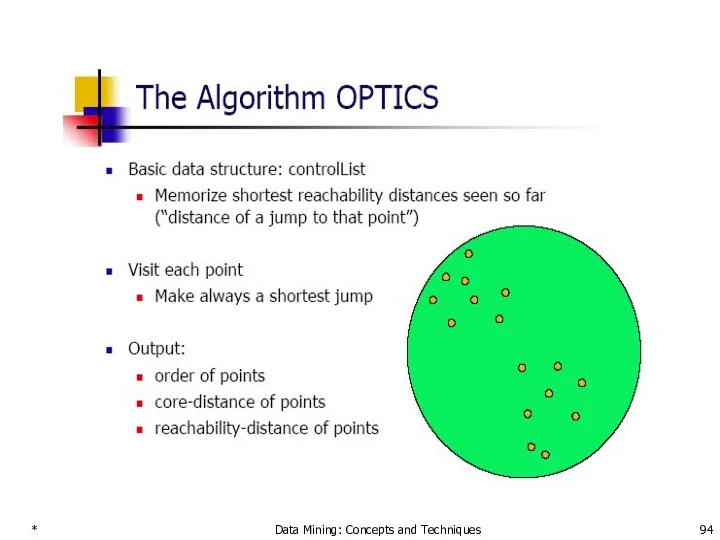
- 93. * Data Mining: Concepts and Techniques
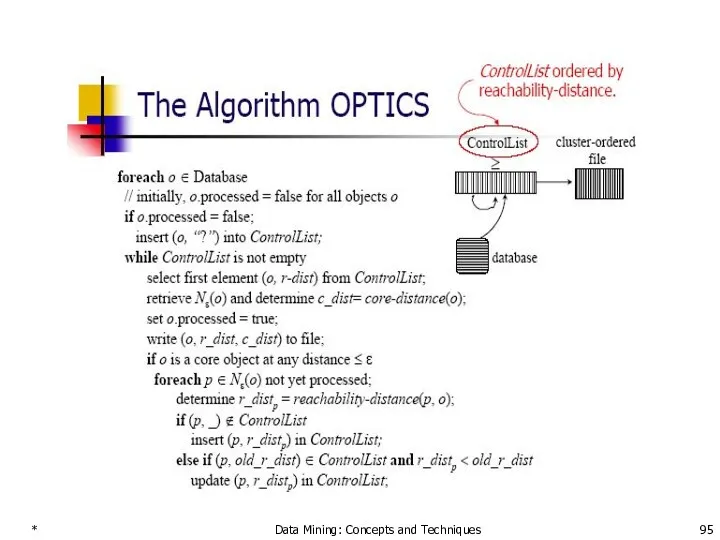
- 94. * Data Mining: Concepts and Techniques
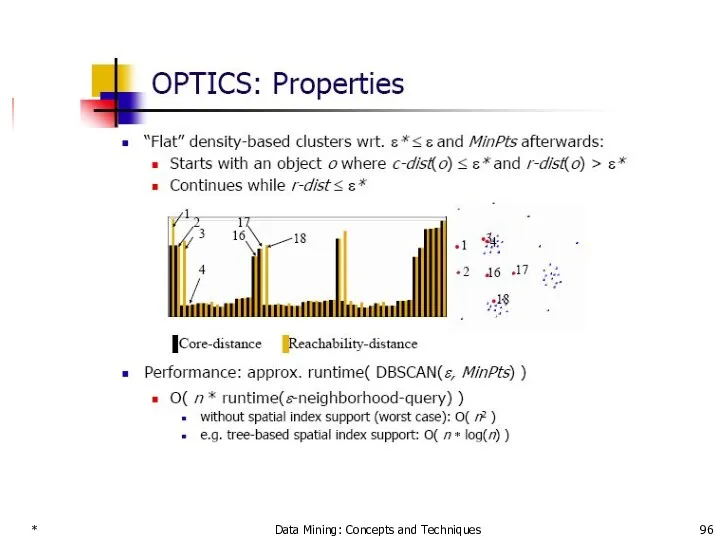
- 95. * Data Mining: Concepts and Techniques
- 96. * Data Mining: Concepts and Techniques
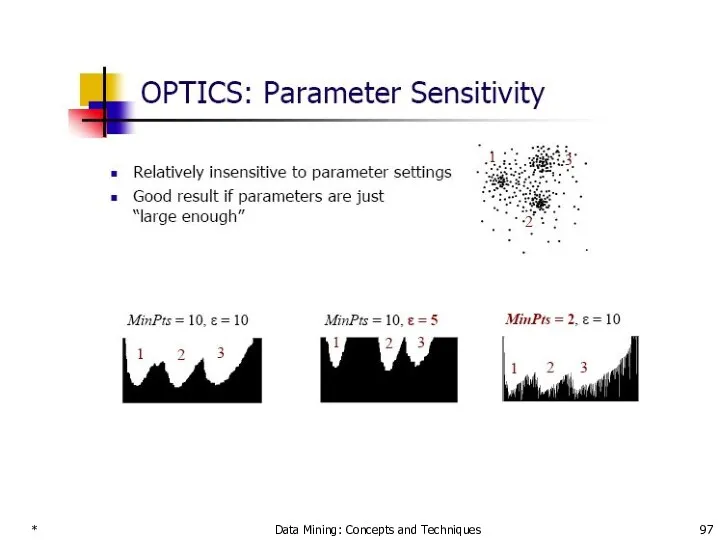
- 97. * Data Mining: Concepts and Techniques
- 98. * Data Mining: Concepts and Techniques Chapter 8. Cluster Analysis What is Cluster Analysis? Types of
- 99. * Data Mining: Concepts and Techniques Grid-Based Clustering Method Using multi-resolution grid data structure Several interesting
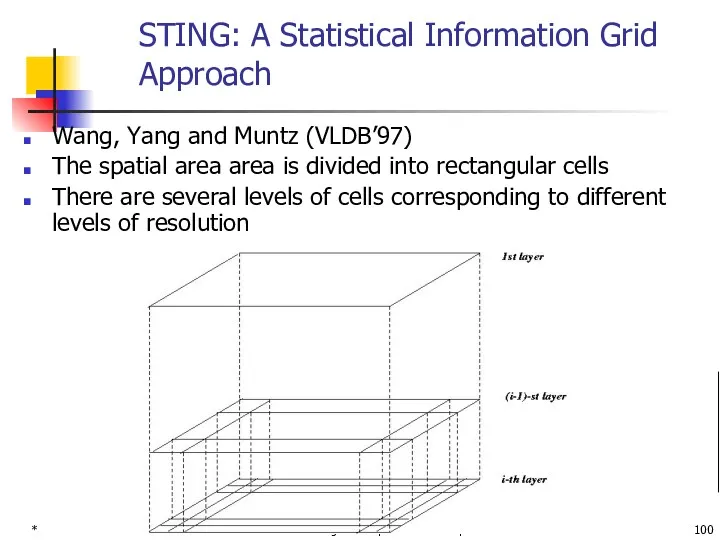
- 100. * Data Mining: Concepts and Techniques STING: A Statistical Information Grid Approach Wang, Yang and Muntz
- 101. STING: A Statistical Information Grid Approach (2) Each cell at a high level is partitioned into
- 102. STING: A Statistical Information Grid Approach (3) Remove the irrelevant cells from further consideration When finish
- 103. * Data Mining: Concepts and Techniques WaveCluster (1998) Sheikholeslami, Chatterjee, and Zhang (VLDB’98) A multi-resolution clustering
- 104. * Data Mining: Concepts and Techniques What is Wavelet (1)?
- 105. * Data Mining: Concepts and Techniques WaveCluster (1998) How to apply wavelet transform to find clusters
- 106. * Data Mining: Concepts and Techniques Wavelet Transform Decomposes a signal into different frequency subbands. (can
- 107. * Data Mining: Concepts and Techniques What Is Wavelet (2)?
- 108. * Data Mining: Concepts and Techniques Quantization
- 109. * Data Mining: Concepts and Techniques Transformation
- 110. * Data Mining: Concepts and Techniques WaveCluster (1998) Why is wavelet transformation useful for clustering Unsupervised
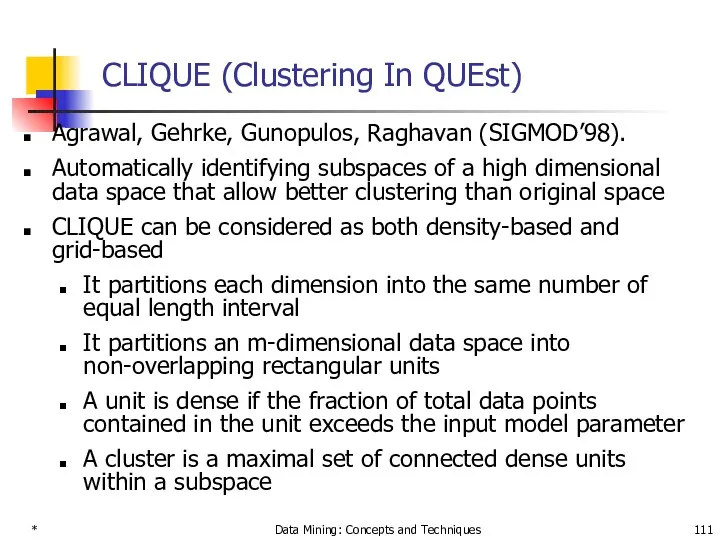
- 111. * Data Mining: Concepts and Techniques CLIQUE (Clustering In QUEst) Agrawal, Gehrke, Gunopulos, Raghavan (SIGMOD’98). Automatically
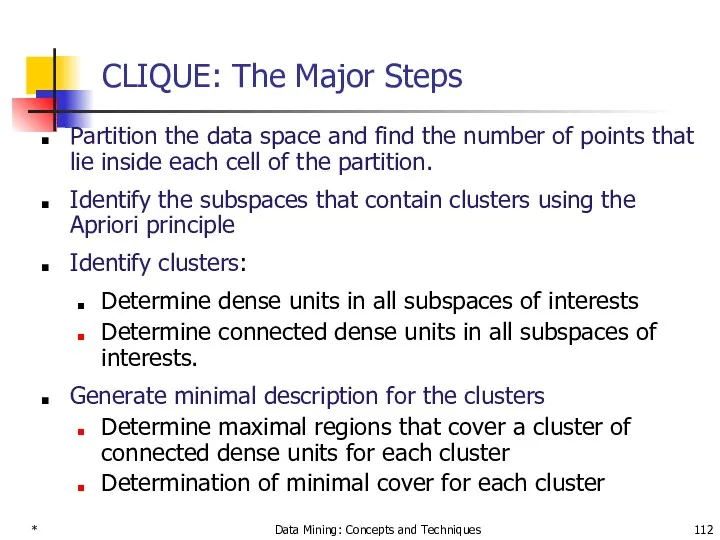
- 112. * Data Mining: Concepts and Techniques CLIQUE: The Major Steps Partition the data space and find
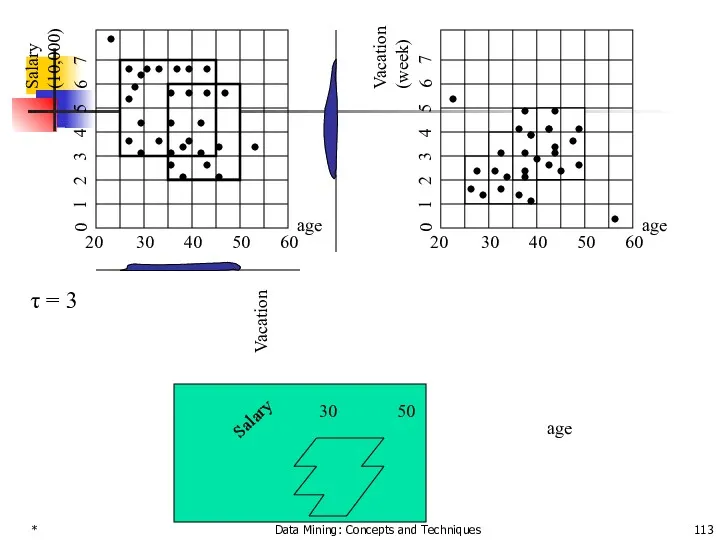
- 113. * Data Mining: Concepts and Techniques Salary (10,000) 20 30 40 50 60 age 5 4
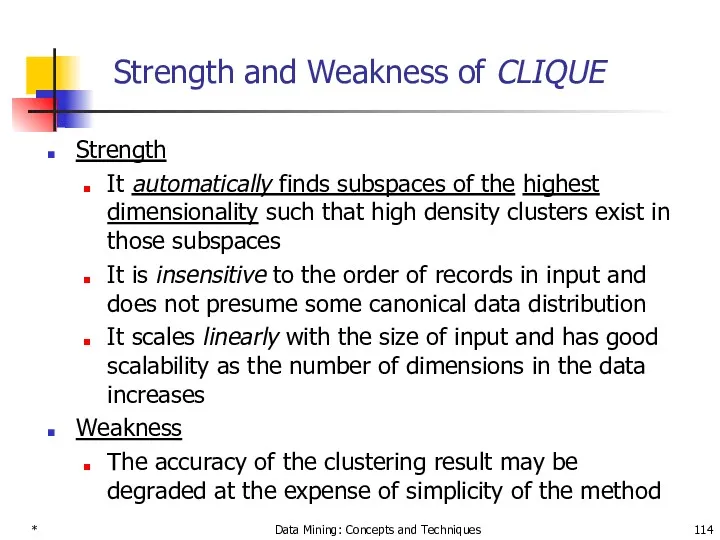
- 114. * Data Mining: Concepts and Techniques Strength and Weakness of CLIQUE Strength It automatically finds subspaces
- 115. * Data Mining: Concepts and Techniques Chapter 8. Cluster Analysis What is Cluster Analysis? Types of
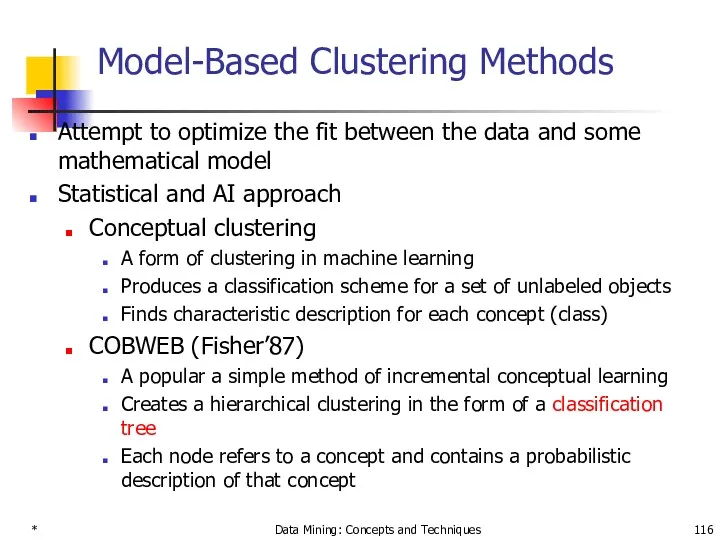
- 116. * Data Mining: Concepts and Techniques Model-Based Clustering Methods Attempt to optimize the fit between the
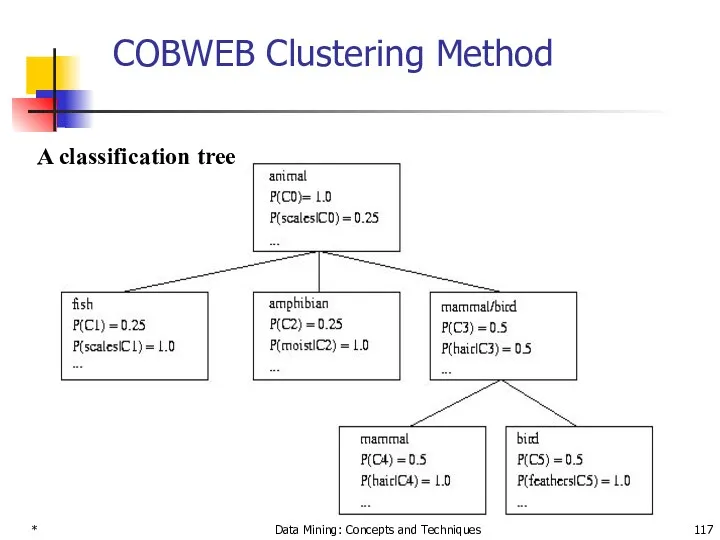
- 117. * Data Mining: Concepts and Techniques COBWEB Clustering Method A classification tree
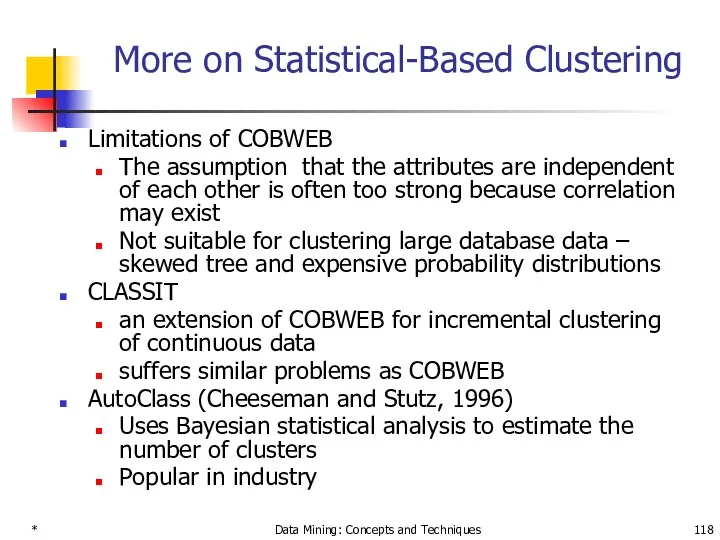
- 118. * Data Mining: Concepts and Techniques More on Statistical-Based Clustering Limitations of COBWEB The assumption that
- 119. * Data Mining: Concepts and Techniques Other Model-Based Clustering Methods Neural network approaches Represent each cluster
- 120. * Data Mining: Concepts and Techniques Model-Based Clustering Methods
- 121. * Data Mining: Concepts and Techniques Self-organizing feature maps (SOMs) Clustering is also performed by having
- 122. * Data Mining: Concepts and Techniques Chapter 8. Cluster Analysis What is Cluster Analysis? Types of
- 123. * Data Mining: Concepts and Techniques What Is Outlier Discovery? What are outliers? The set of
- 124. * Data Mining: Concepts and Techniques Outlier Discovery: Statistical Approaches Assume a model underlying distribution that
- 125. Outlier Discovery: Distance-Based Approach Introduced to counter the main limitations imposed by statistical methods We need
- 126. * Data Mining: Concepts and Techniques Outlier Discovery: Deviation-Based Approach Identifies outliers by examining the main
- 127. * Data Mining: Concepts and Techniques Chapter 8. Cluster Analysis What is Cluster Analysis? Types of
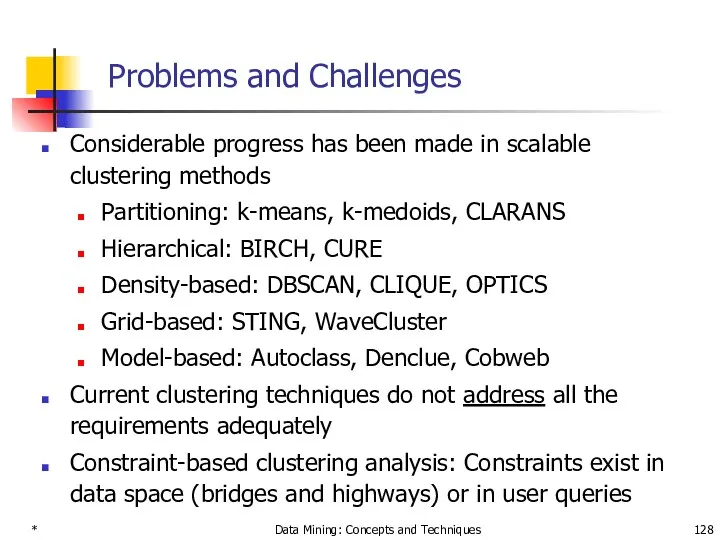
- 128. * Data Mining: Concepts and Techniques Problems and Challenges Considerable progress has been made in scalable
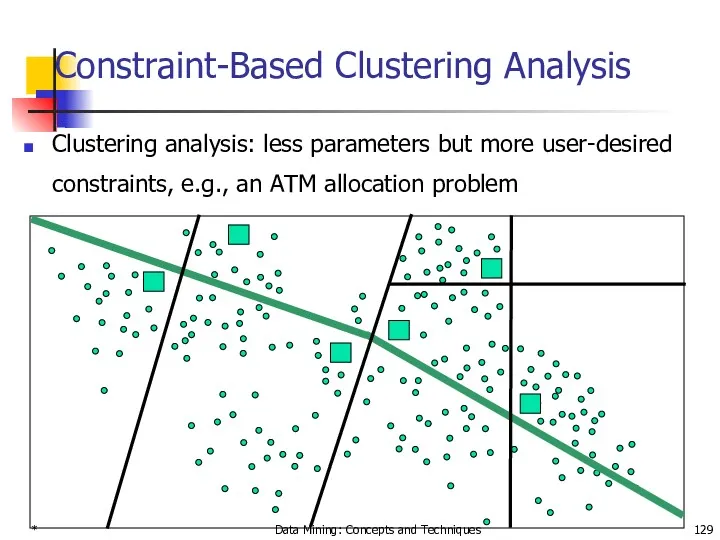
- 129. * Data Mining: Concepts and Techniques Constraint-Based Clustering Analysis Clustering analysis: less parameters but more user-desired
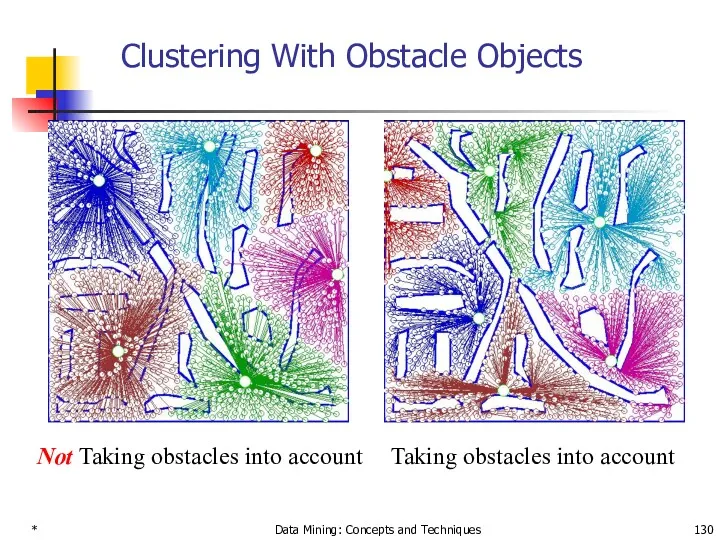
- 130. * Data Mining: Concepts and Techniques Clustering With Obstacle Objects Taking obstacles into account Not Taking
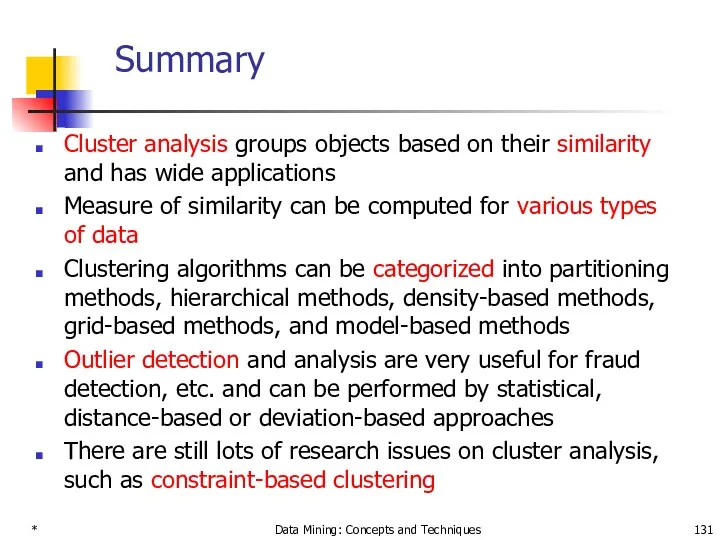
- 131. * Data Mining: Concepts and Techniques Summary Cluster analysis groups objects based on their similarity and
- 132. * Data Mining: Concepts and Techniques References (1) R. Agrawal, J. Gehrke, D. Gunopulos, and P.
- 134. Скачать презентацию
*
Data Mining: Concepts and Techniques
Chapter 8. Cluster Analysis
What is Cluster Analysis?
Types
*
Data Mining: Concepts and Techniques
Chapter 8. Cluster Analysis
What is Cluster Analysis?
Types
What is Cluster Analysis?
Cluster: a collection of data objects
Similar to one
What is Cluster Analysis?
Cluster: a collection of data objects
Similar to one
*
Data Mining: Concepts and Techniques
General Applications of Clustering
Pattern Recognition
Spatial Data
*
Data Mining: Concepts and Techniques
General Applications of Clustering
Pattern Recognition
Spatial Data
*
Data Mining: Concepts and Techniques
Examples of Clustering Applications
Marketing: Help marketers discover
*
Data Mining: Concepts and Techniques
Examples of Clustering Applications
Marketing: Help marketers discover
*
Data Mining: Concepts and Techniques
*
Data Mining: Concepts and Techniques
*
Data Mining: Concepts and Techniques
*
Data Mining: Concepts and Techniques
*
Data Mining: Concepts and Techniques
*
Data Mining: Concepts and Techniques
*
Data Mining: Concepts and Techniques
What Is Good Clustering?
A good clustering method
*
Data Mining: Concepts and Techniques
What Is Good Clustering?
A good clustering method
*
Data Mining: Concepts and Techniques
Requirements of Clustering in Data Mining
Scalability
Ability
*
Data Mining: Concepts and Techniques
Requirements of Clustering in Data Mining
Scalability
Ability
*
Data Mining: Concepts and Techniques
Chapter 8. Cluster Analysis
What is Cluster Analysis?
Types
*
Data Mining: Concepts and Techniques
Chapter 8. Cluster Analysis
What is Cluster Analysis?
Types
*
Data Mining: Concepts and Techniques
Data Structures
Data matrix
(two modes)
Dissimilarity matrix
(one mode)
*
Data Mining: Concepts and Techniques
Data Structures
Data matrix
(two modes)
Dissimilarity matrix
(one mode)
*
Data Mining: Concepts and Techniques
Measure the Quality of Clustering
Dissimilarity/Similarity metric: Similarity
*
Data Mining: Concepts and Techniques
Measure the Quality of Clustering
Dissimilarity/Similarity metric: Similarity
*
Data Mining: Concepts and Techniques
*
Data Mining: Concepts and Techniques
*
Data Mining: Concepts and Techniques
*
Data Mining: Concepts and Techniques
*
Data Mining: Concepts and Techniques
*
Data Mining: Concepts and Techniques
*
Data Mining: Concepts and Techniques
Type of data in clustering analysis
Interval-scaled variables:
Binary
*
Data Mining: Concepts and Techniques
Type of data in clustering analysis
Interval-scaled variables:
Binary
*
Data Mining: Concepts and Techniques
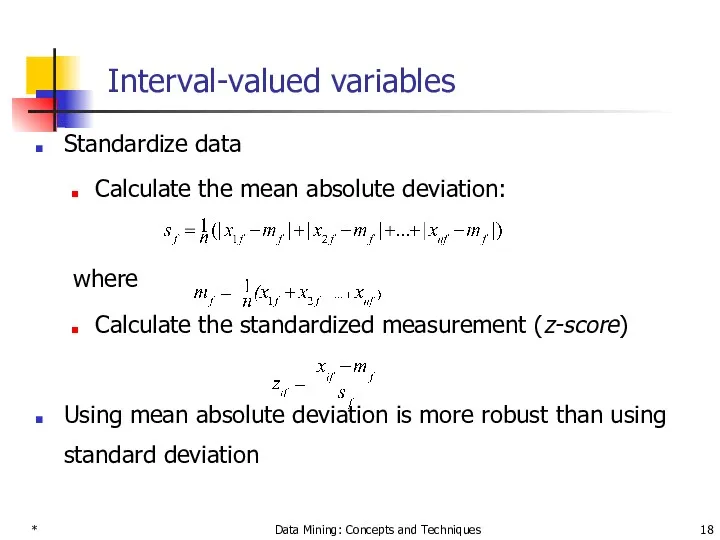
Interval-valued variables
Standardize data
Calculate the mean absolute deviation:
where
Calculate
*
Data Mining: Concepts and Techniques
Interval-valued variables
Standardize data
Calculate the mean absolute deviation:
where
Calculate
*
Data Mining: Concepts and Techniques
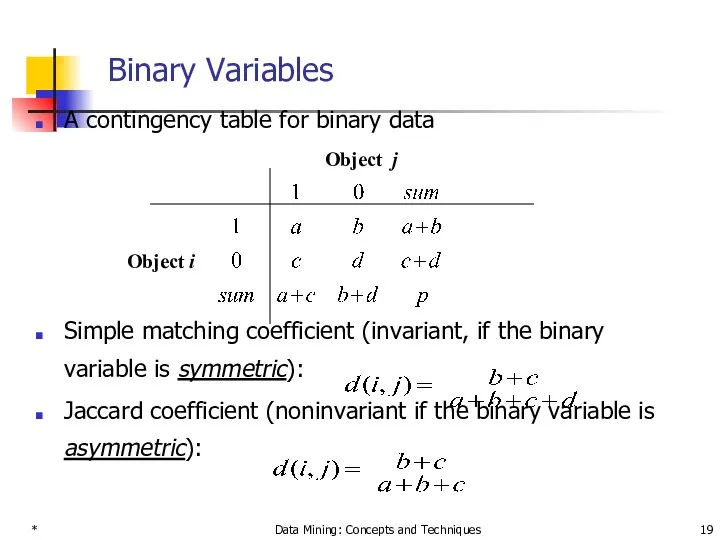
Binary Variables
A contingency table for binary data
Simple
*
Data Mining: Concepts and Techniques
Binary Variables
A contingency table for binary data
Simple
*
Data Mining: Concepts and Techniques
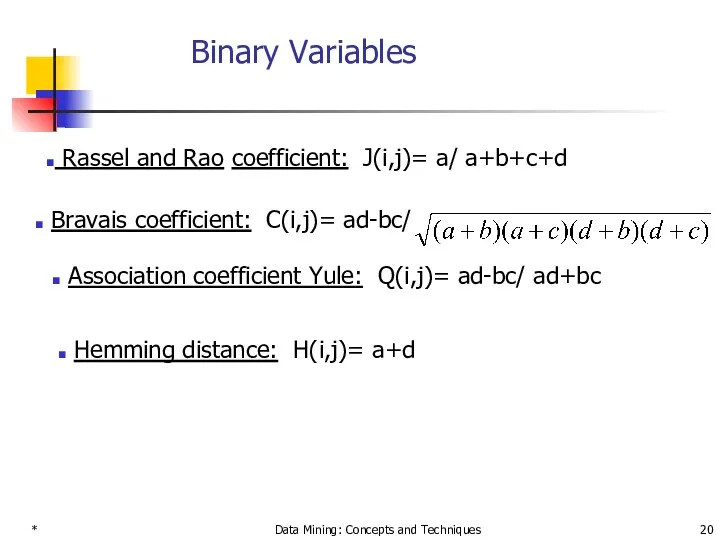
Binary Variables
Association coefficient Yule: Q(i,j)=
*
Data Mining: Concepts and Techniques
Binary Variables
Association coefficient Yule: Q(i,j)=
*
Data Mining: Concepts and Techniques
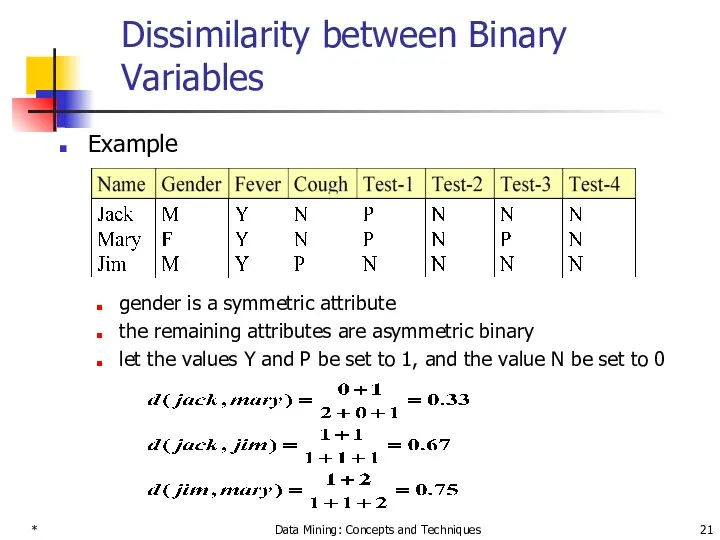
Dissimilarity between Binary Variables
Example
gender is a symmetric
*
Data Mining: Concepts and Techniques
Dissimilarity between Binary Variables
Example
gender is a symmetric
*
Data Mining: Concepts and Techniques
Nominal Variables
A generalization of the binary variable
*
Data Mining: Concepts and Techniques
Nominal Variables
A generalization of the binary variable
*
Data Mining: Concepts and Techniques
Ordinal Variables
An ordinal variable can be discrete
*
Data Mining: Concepts and Techniques
Ordinal Variables
An ordinal variable can be discrete
*
Data Mining: Concepts and Techniques
Ratio-Scaled Variables
Ratio-scaled variable: a positive measurement on
*
Data Mining: Concepts and Techniques
Ratio-Scaled Variables
Ratio-scaled variable: a positive measurement on
*
Data Mining: Concepts and Techniques
Variables of Mixed Types
A database may contain
*
Data Mining: Concepts and Techniques
Variables of Mixed Types
A database may contain

*
Data Mining: Concepts and Techniques
Chapter 8. Cluster Analysis
What is Cluster Analysis?
Types
*
Data Mining: Concepts and Techniques
Chapter 8. Cluster Analysis
What is Cluster Analysis?
Types
*
Data Mining: Concepts and Techniques
Major Clustering Approaches
Partitioning algorithms: Construct various partitions
*
Data Mining: Concepts and Techniques
Major Clustering Approaches
Partitioning algorithms: Construct various partitions
*
Data Mining: Concepts and Techniques
Chapter 8. Cluster Analysis
What is Cluster Analysis?
Types
*
Data Mining: Concepts and Techniques
Chapter 8. Cluster Analysis
What is Cluster Analysis?
Types
*
Data Mining: Concepts and Techniques
Partitioning Algorithms: Basic Concept
Partitioning method: Construct a
*
Data Mining: Concepts and Techniques
Partitioning Algorithms: Basic Concept
Partitioning method: Construct a
*
Data Mining: Concepts and Techniques
*
Data Mining: Concepts and Techniques
*
Data Mining: Concepts and Techniques
The K-Means Clustering Method
Given k, the
*
Data Mining: Concepts and Techniques
The K-Means Clustering Method
Given k, the
*
Data Mining: Concepts and Techniques
The K-Means Clustering Method
Example
0
1
2
3
4
5
6
7
8
9
10
0
1
2
3
4
5
6
7
8
9
10
K=2
Arbitrarily choose K
*
Data Mining: Concepts and Techniques
The K-Means Clustering Method
Example
0
1
2
3
4
5
6
7
8
9
10
0
1
2
3
4
5
6
7
8
9
10
K=2
Arbitrarily choose K
*
Data Mining: Concepts and Techniques
Comments on the K-Means Method
Strength: Relatively efficient:
*
Data Mining: Concepts and Techniques
Comments on the K-Means Method
Strength: Relatively efficient:
*
Data Mining: Concepts and Techniques
Variations of the K-Means Method
A few variants
*
Data Mining: Concepts and Techniques
Variations of the K-Means Method
A few variants
*
Data Mining: Concepts and Techniques
What is the problem of k-Means Method?
The
*
Data Mining: Concepts and Techniques
What is the problem of k-Means Method?
The
*
Data Mining: Concepts and Techniques
*
Data Mining: Concepts and Techniques
*
Data Mining: Concepts and Techniques
*
Data Mining: Concepts and Techniques
*
Data Mining: Concepts and Techniques
*
Data Mining: Concepts and Techniques
*
Data Mining: Concepts and Techniques
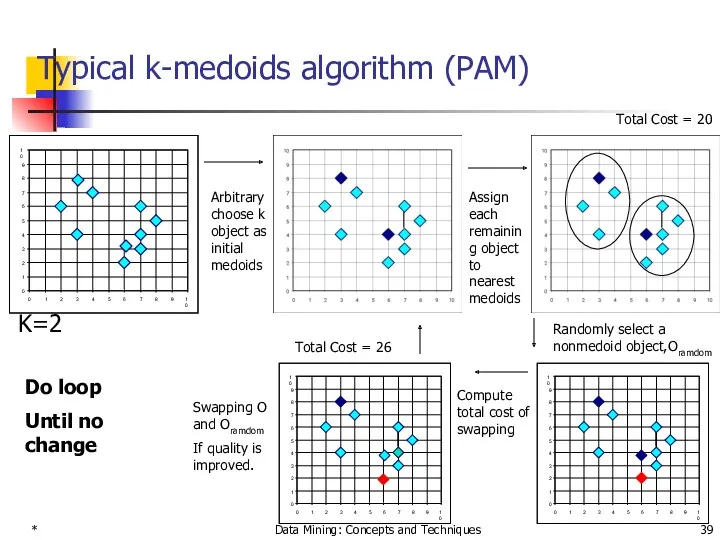
Typical k-medoids algorithm (PAM)
Total Cost = 20
0
1
2
3
4
5
6
7
8
9
10
0
1
2
3
4
5
6
7
8
9
10
K=2
Arbitrary
*
Data Mining: Concepts and Techniques
Typical k-medoids algorithm (PAM)
Total Cost = 20
0
1
2
3
4
5
6
7
8
9
10
0
1
2
3
4
5
6
7
8
9
10
K=2
Arbitrary
*
Data Mining: Concepts and Techniques
What is the problem with PAM?
Pam is
*
Data Mining: Concepts and Techniques
What is the problem with PAM?
Pam is
*
Data Mining: Concepts and Techniques
*
Data Mining: Concepts and Techniques
*
Data Mining: Concepts and Techniques
CLARA (Clustering Large Applications) (1990)
CLARA (Kaufmann and
*
Data Mining: Concepts and Techniques
CLARA (Clustering Large Applications) (1990)
CLARA (Kaufmann and
*
Data Mining: Concepts and Techniques
CLARANS (“Randomized” CLARA) (1994)
CLARANS (A Clustering Algorithm
*
Data Mining: Concepts and Techniques
CLARANS (“Randomized” CLARA) (1994)
CLARANS (A Clustering Algorithm
*
Data Mining: Concepts and Techniques
*
Data Mining: Concepts and Techniques
*
Data Mining: Concepts and Techniques
*
Data Mining: Concepts and Techniques
*
Data Mining: Concepts and Techniques
*
Data Mining: Concepts and Techniques
*
Data Mining: Concepts and Techniques
*
Data Mining: Concepts and Techniques

*
Data Mining: Concepts and Techniques
Chapter 8. Cluster Analysis
What is Cluster Analysis?
Types
*
Data Mining: Concepts and Techniques
Chapter 8. Cluster Analysis
What is Cluster Analysis?
Types
*
Data Mining: Concepts and Techniques
*
Data Mining: Concepts and Techniques
*
Data Mining: Concepts and Techniques
*
Data Mining: Concepts and Techniques
*
Data Mining: Concepts and Techniques
A Dendrogram Shows How the Clusters are
*
Data Mining: Concepts and Techniques
A Dendrogram Shows How the Clusters are
*
Data Mining: Concepts and Techniques
A Dendrogram Algorithm for Binary variables
1. To
*
Data Mining: Concepts and Techniques
A Dendrogram Algorithm for Binary variables
1. To
*
Data Mining: Concepts and Techniques
Example for binary variables
ecoli1 0 1
*
Data Mining: Concepts and Techniques
Example for binary variables
ecoli1 0 1
*
Data Mining: Concepts and Techniques
ecoli2
ecoli3
J23=14/16=0.875
2. Incedence matrix
ecoli1
ecoli2
ecoli3
ecoli1 ecoli2 ecoli3
0 0.81 0.8
*
Data Mining: Concepts and Techniques
ecoli2
ecoli3
J23=14/16=0.875
2. Incedence matrix
ecoli1
ecoli2
ecoli3
ecoli1 ecoli2 ecoli3
0 0.81 0.8
*
Data Mining: Concepts and Techniques
A Dendrogram Algorithm for Numerical variables
1. To
*
Data Mining: Concepts and Techniques
A Dendrogram Algorithm for Numerical variables
1. To
*
Data Mining: Concepts and Techniques
*
Data Mining: Concepts and Techniques
*
Data Mining: Concepts and Techniques
A Dendrogram Algorithm for Numerical variables
Let us
*
Data Mining: Concepts and Techniques
A Dendrogram Algorithm for Numerical variables
Let us
*
Data Mining: Concepts and Techniques
A Dendrogram Algorithm for Numerical variables
D(x1,x2)=2 D(x1,x3)=2.5
*
Data Mining: Concepts and Techniques
A Dendrogram Algorithm for Numerical variables
D(x1,x2)=2 D(x1,x3)=2.5
*
Data Mining: Concepts and Techniques
Hierarchical Clustering
Use distance matrix as clustering criteria.
*
Data Mining: Concepts and Techniques
Hierarchical Clustering
Use distance matrix as clustering criteria.
*
Data Mining: Concepts and Techniques
*
Data Mining: Concepts and Techniques
*
Data Mining: Concepts and Techniques
AGNES (Agglomerative Nesting)
Introduced in Kaufmann and Rousseeuw
*
Data Mining: Concepts and Techniques
AGNES (Agglomerative Nesting)
Introduced in Kaufmann and Rousseeuw
*
Data Mining: Concepts and Techniques
DIANA (Divisive Analysis)
Introduced in Kaufmann and Rousseeuw
*
Data Mining: Concepts and Techniques
DIANA (Divisive Analysis)
Introduced in Kaufmann and Rousseeuw
*
Data Mining: Concepts and Techniques
More on Hierarchical Clustering Methods
Major weakness of
*
Data Mining: Concepts and Techniques
More on Hierarchical Clustering Methods
Major weakness of
*
Data Mining: Concepts and Techniques
BIRCH (1996)
Birch: Balanced Iterative Reducing and Clustering
*
Data Mining: Concepts and Techniques
BIRCH (1996)
Birch: Balanced Iterative Reducing and Clustering
*
Data Mining: Concepts and Techniques
Clustering Feature Vector
CF = (5, (16,30),(54,190))
(3,4)
(2,6)
(4,5)
(4,7)
(3,8)
*
Data Mining: Concepts and Techniques
Clustering Feature Vector
CF = (5, (16,30),(54,190))
(3,4)
(2,6)
(4,5)
(4,7)
(3,8)
*
Data Mining: Concepts and Techniques
CF-Tree in BIRCH
Clustering feature:
summary of the
*
Data Mining: Concepts and Techniques
CF-Tree in BIRCH
Clustering feature:
summary of the
*
Data Mining: Concepts and Techniques
CF Tree
CF1
child1
CF3
child3
CF2
child2
CF5
child5
CF1
CF2
CF6
prev
next
CF1
CF2
CF4
prev
next
B = 7
L = 6
Root
Non-leaf node
Leaf
*
Data Mining: Concepts and Techniques
CF Tree
CF1
child1
CF3
child3
CF2
child2
CF5
child5
CF1
CF2
CF6
prev
next
CF1
CF2
CF4
prev
next
B = 7
L = 6
Root
Non-leaf node
Leaf
*
Data Mining: Concepts and Techniques
CURE (Clustering Using REpresentatives )
CURE: proposed by
*
Data Mining: Concepts and Techniques
CURE (Clustering Using REpresentatives )
CURE: proposed by
*
Data Mining: Concepts and Techniques
Drawbacks of Distance-Based Method
Drawbacks of square-error based
*
Data Mining: Concepts and Techniques
Drawbacks of Distance-Based Method
Drawbacks of square-error based
*
Data Mining: Concepts and Techniques
Cure: The Algorithm
Draw random sample s.
Partition sample
*
Data Mining: Concepts and Techniques
Cure: The Algorithm
Draw random sample s.
Partition sample
*
Data Mining: Concepts and Techniques
Data Partitioning and Clustering
s = 50
p =
*
Data Mining: Concepts and Techniques
Data Partitioning and Clustering
s = 50
p =
*
Data Mining: Concepts and Techniques
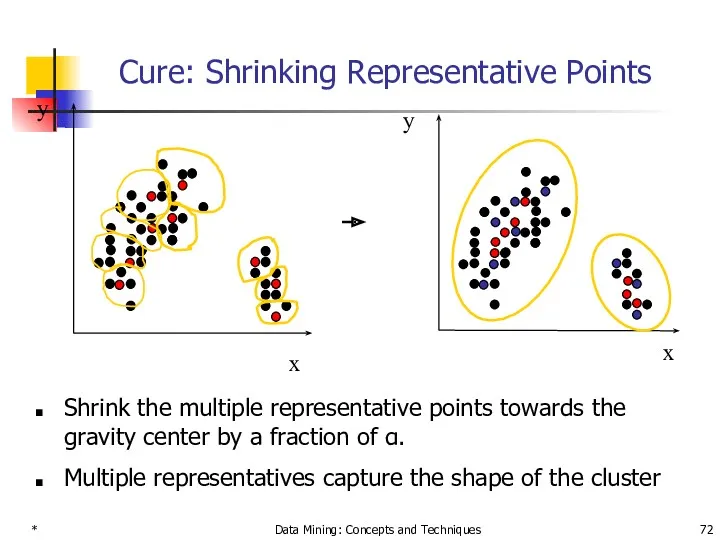
Cure: Shrinking Representative Points
Shrink the multiple representative
*
Data Mining: Concepts and Techniques
Cure: Shrinking Representative Points
Shrink the multiple representative
*
Data Mining: Concepts and Techniques
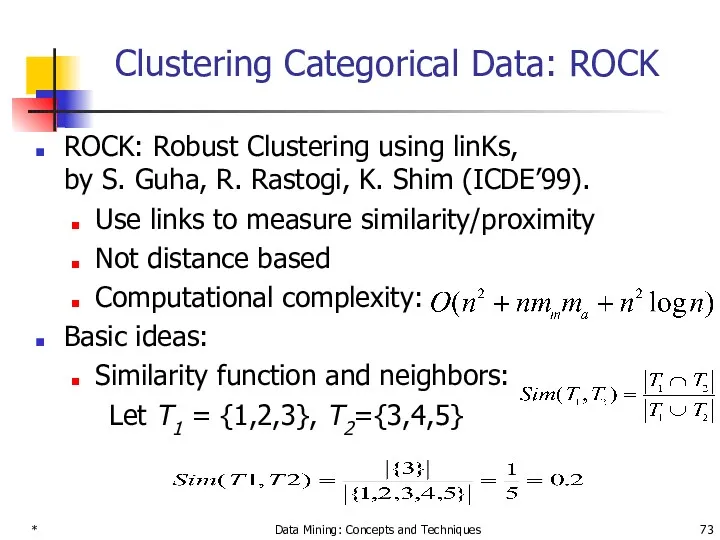
Clustering Categorical Data: ROCK
ROCK: Robust Clustering using
*
Data Mining: Concepts and Techniques
Clustering Categorical Data: ROCK
ROCK: Robust Clustering using
*
Data Mining: Concepts and Techniques
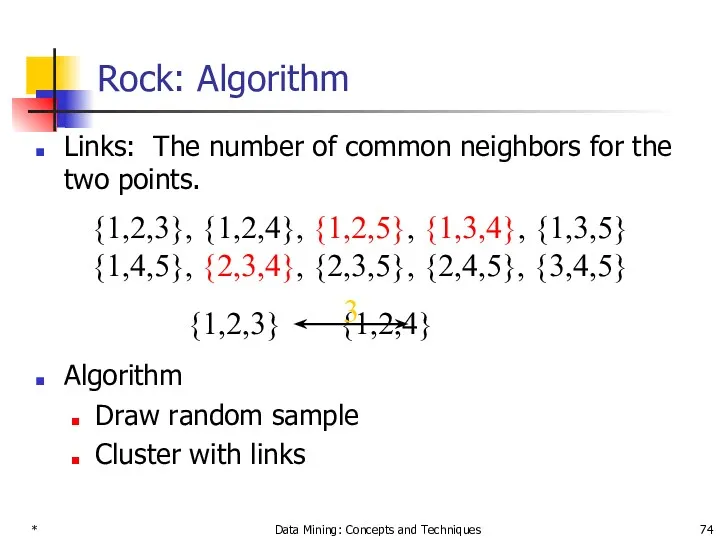
Rock: Algorithm
Links: The number of common neighbors
*
Data Mining: Concepts and Techniques
Rock: Algorithm
Links: The number of common neighbors
*
Data Mining: Concepts and Techniques
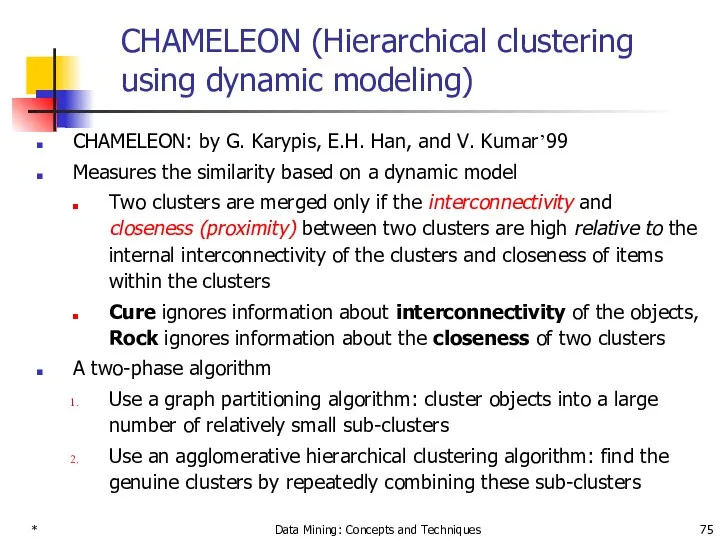
CHAMELEON (Hierarchical clustering using dynamic modeling)
CHAMELEON: by
*
Data Mining: Concepts and Techniques
CHAMELEON (Hierarchical clustering using dynamic modeling)
CHAMELEON: by

*
Data Mining: Concepts and Techniques
Overall Framework of CHAMELEON
Construct
Sparse Graph
Partition the Graph
Merge
*
Data Mining: Concepts and Techniques
Overall Framework of CHAMELEON
Construct
Sparse Graph
Partition the Graph
Merge
*
Data Mining: Concepts and Techniques
Chapter 8. Cluster Analysis
What is Cluster Analysis?
Types
*
Data Mining: Concepts and Techniques
Chapter 8. Cluster Analysis
What is Cluster Analysis?
Types
*
Data Mining: Concepts and Techniques
Density-Based Clustering Methods
Clustering based on density (local
*
Data Mining: Concepts and Techniques
Density-Based Clustering Methods
Clustering based on density (local
*
Data Mining: Concepts and Techniques
*
Data Mining: Concepts and Techniques
*
Data Mining: Concepts and Techniques
*
Data Mining: Concepts and Techniques
*
Data Mining: Concepts and Techniques
*
Data Mining: Concepts and Techniques
*
Data Mining: Concepts and Techniques
*
Data Mining: Concepts and Techniques
*
Data Mining: Concepts and Techniques
*
Data Mining: Concepts and Techniques
*
Data Mining: Concepts and Techniques
*
Data Mining: Concepts and Techniques
*
Data Mining: Concepts and Techniques
*
Data Mining: Concepts and Techniques
*
Data Mining: Concepts and Techniques
*
Data Mining: Concepts and Techniques
*
Data Mining: Concepts and Techniques
*
Data Mining: Concepts and Techniques
*
Data Mining: Concepts and Techniques
*
Data Mining: Concepts and Techniques
*
Data Mining: Concepts and Techniques
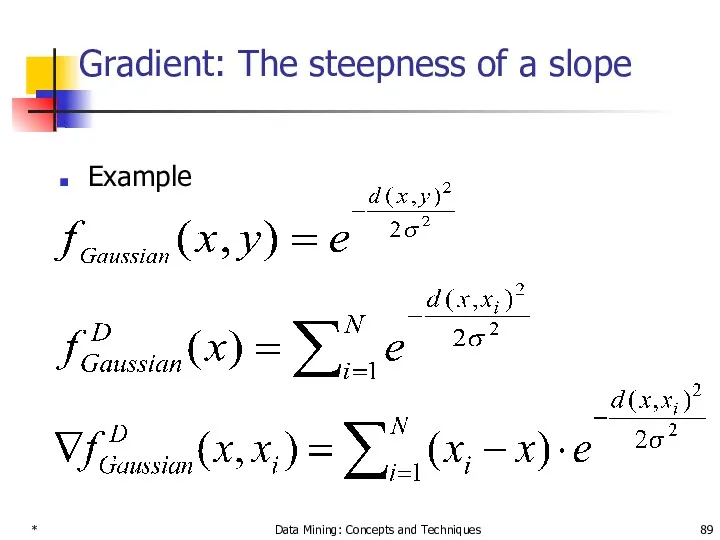
Gradient: The steepness of a slope
Example
*
Data Mining: Concepts and Techniques
Gradient: The steepness of a slope
Example
*
Data Mining: Concepts and Techniques
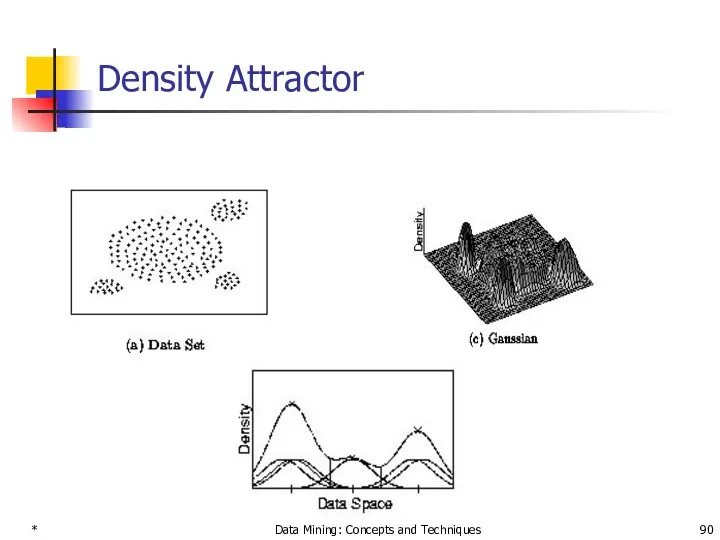
Density Attractor
*
Data Mining: Concepts and Techniques
Density Attractor
*
Data Mining: Concepts and Techniques
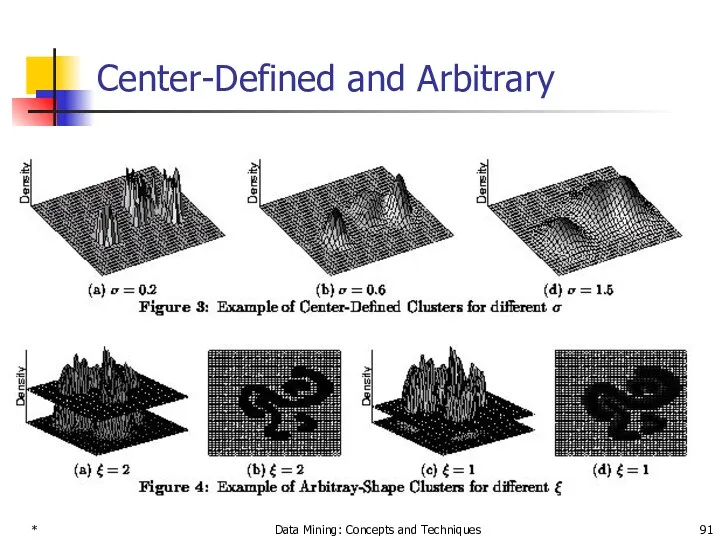
Center-Defined and Arbitrary
*
Data Mining: Concepts and Techniques
Center-Defined and Arbitrary
*
Data Mining: Concepts and Techniques
*
Data Mining: Concepts and Techniques
*
Data Mining: Concepts and Techniques
*
Data Mining: Concepts and Techniques
*
Data Mining: Concepts and Techniques
*
Data Mining: Concepts and Techniques
*
Data Mining: Concepts and Techniques
*
Data Mining: Concepts and Techniques
*
Data Mining: Concepts and Techniques
*
Data Mining: Concepts and Techniques
*
Data Mining: Concepts and Techniques
*
Data Mining: Concepts and Techniques
*
Data Mining: Concepts and Techniques
Chapter 8. Cluster Analysis
What is Cluster Analysis?
Types
*
Data Mining: Concepts and Techniques
Chapter 8. Cluster Analysis
What is Cluster Analysis?
Types
*
Data Mining: Concepts and Techniques
Grid-Based Clustering Method
Using multi-resolution grid data
*
Data Mining: Concepts and Techniques
Grid-Based Clustering Method
Using multi-resolution grid data
*
Data Mining: Concepts and Techniques
STING: A Statistical Information Grid Approach
Wang, Yang
*
Data Mining: Concepts and Techniques
STING: A Statistical Information Grid Approach
Wang, Yang
STING: A Statistical Information Grid Approach (2)
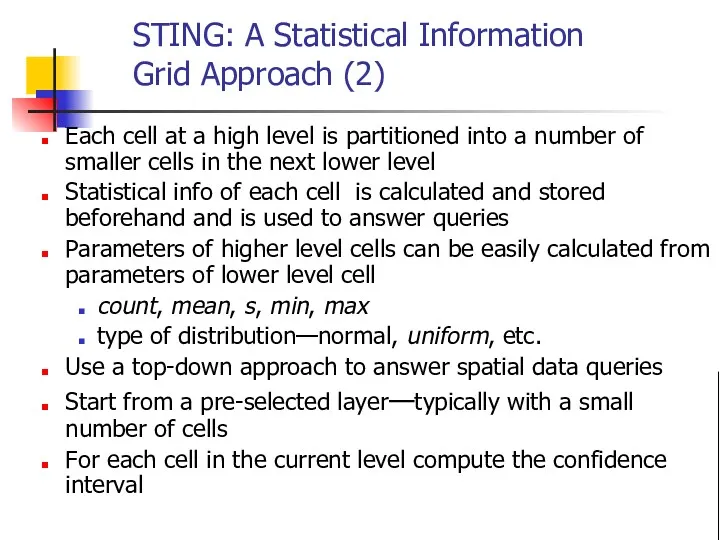
Each cell at a high
STING: A Statistical Information Grid Approach (2)
Each cell at a high
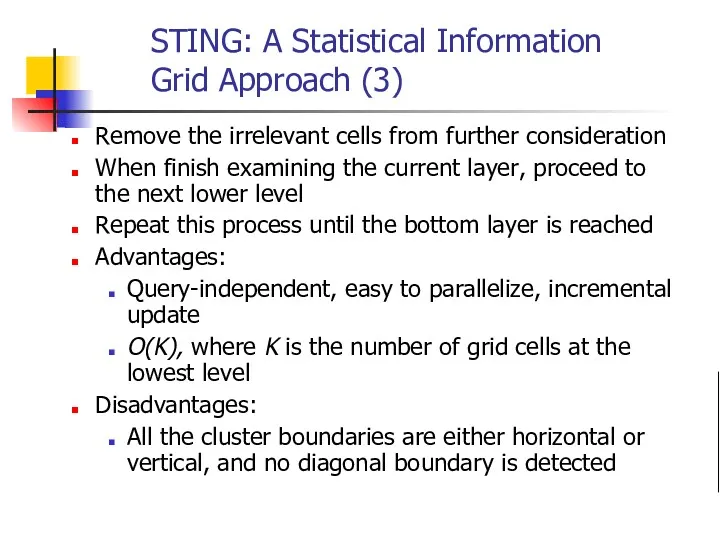
STING: A Statistical Information Grid Approach (3)
Remove the irrelevant cells from
STING: A Statistical Information Grid Approach (3)
Remove the irrelevant cells from

*
Data Mining: Concepts and Techniques
WaveCluster (1998)
Sheikholeslami, Chatterjee, and Zhang (VLDB’98)
A
*
Data Mining: Concepts and Techniques
WaveCluster (1998)
Sheikholeslami, Chatterjee, and Zhang (VLDB’98)
A
*
Data Mining: Concepts and Techniques
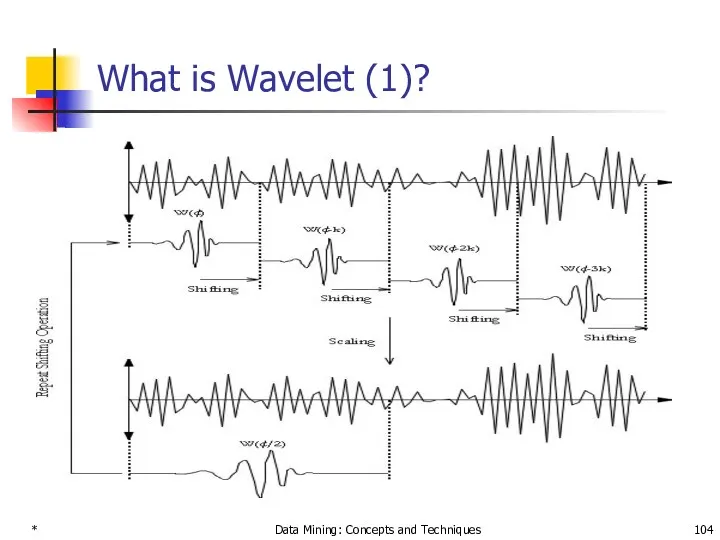
What is Wavelet (1)?
*
Data Mining: Concepts and Techniques
What is Wavelet (1)?
*
Data Mining: Concepts and Techniques
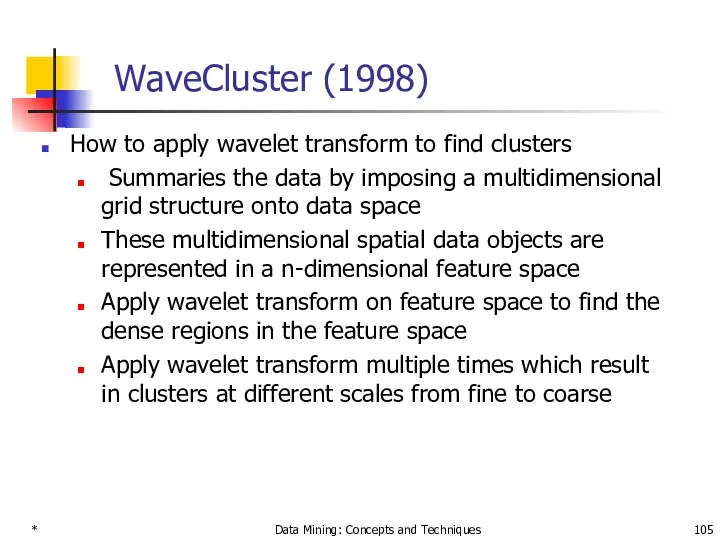
WaveCluster (1998)
How to apply wavelet transform to
*
Data Mining: Concepts and Techniques
WaveCluster (1998)
How to apply wavelet transform to
*
Data Mining: Concepts and Techniques
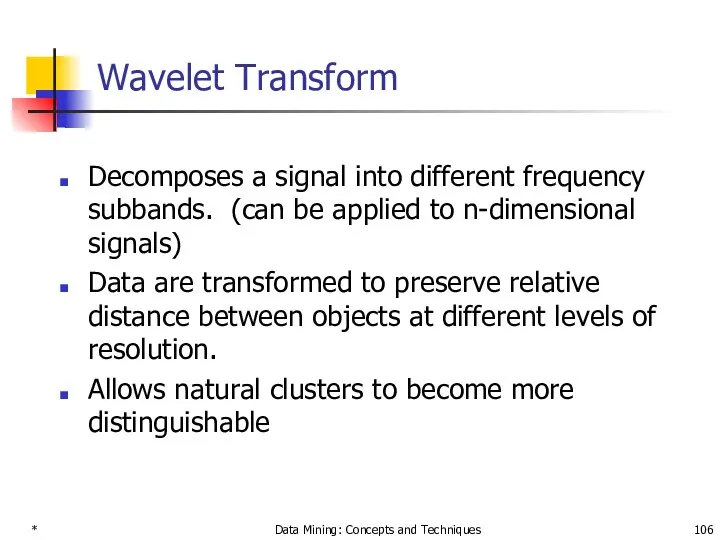
Wavelet Transform
Decomposes a signal into different frequency
*
Data Mining: Concepts and Techniques
Wavelet Transform
Decomposes a signal into different frequency
*
Data Mining: Concepts and Techniques
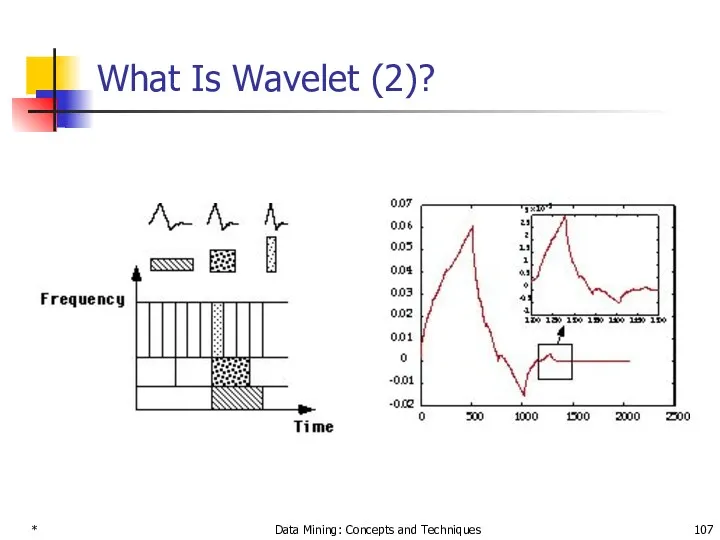
What Is Wavelet (2)?
*
Data Mining: Concepts and Techniques
What Is Wavelet (2)?

*
Data Mining: Concepts and Techniques
Quantization
*
Data Mining: Concepts and Techniques
Quantization
*
Data Mining: Concepts and Techniques
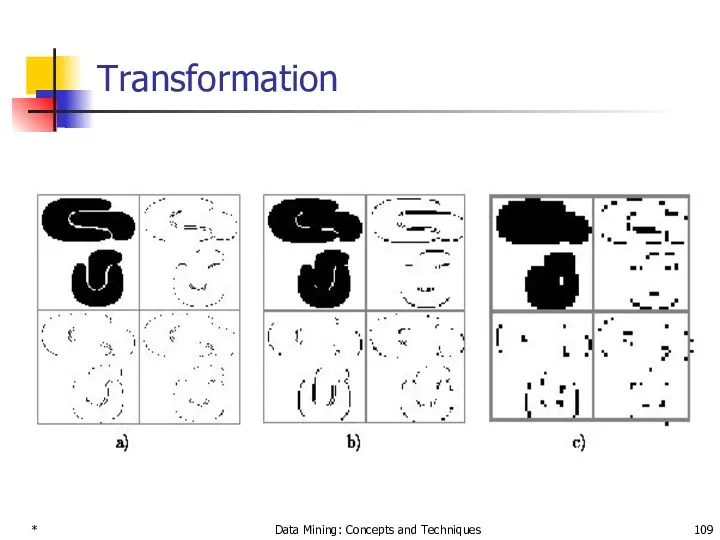
Transformation
*
Data Mining: Concepts and Techniques
Transformation
*
Data Mining: Concepts and Techniques
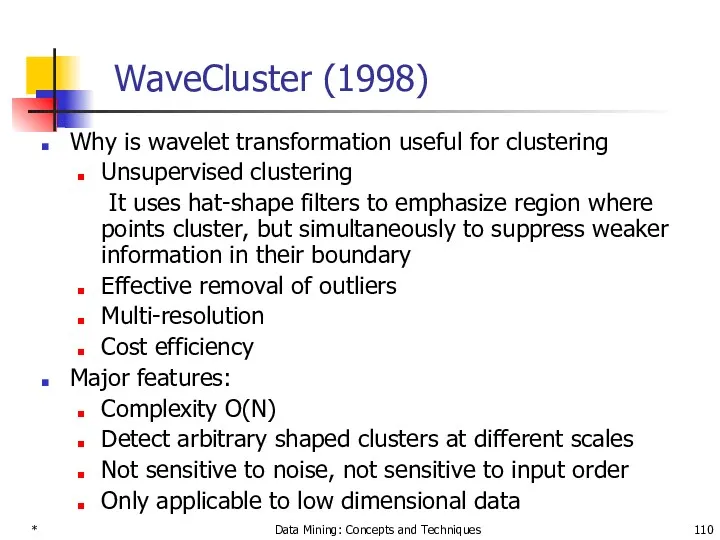
WaveCluster (1998)
Why is wavelet transformation useful for
*
Data Mining: Concepts and Techniques
WaveCluster (1998)
Why is wavelet transformation useful for
*
Data Mining: Concepts and Techniques
CLIQUE (Clustering In QUEst)
Agrawal, Gehrke, Gunopulos,
*
Data Mining: Concepts and Techniques
CLIQUE (Clustering In QUEst)
Agrawal, Gehrke, Gunopulos,
*
Data Mining: Concepts and Techniques
CLIQUE: The Major Steps
Partition the data space
*
Data Mining: Concepts and Techniques
CLIQUE: The Major Steps
Partition the data space
*
Data Mining: Concepts and Techniques
Salary (10,000)
20
30
40
50
60
age
5
4
3
1
2
6
7
0
τ = 3
*
Data Mining: Concepts and Techniques
Salary (10,000)
20
30
40
50
60
age
5
4
3
1
2
6
7
0
τ = 3
*
Data Mining: Concepts and Techniques
Strength and Weakness of CLIQUE
Strength
It automatically
*
Data Mining: Concepts and Techniques
Strength and Weakness of CLIQUE
Strength
It automatically
*
Data Mining: Concepts and Techniques
Chapter 8. Cluster Analysis
What is Cluster Analysis?
Types
*
Data Mining: Concepts and Techniques
Chapter 8. Cluster Analysis
What is Cluster Analysis?
Types
*
Data Mining: Concepts and Techniques
Model-Based Clustering Methods
Attempt to optimize the fit
*
Data Mining: Concepts and Techniques
Model-Based Clustering Methods
Attempt to optimize the fit
*
Data Mining: Concepts and Techniques
COBWEB Clustering Method
A classification tree
*
Data Mining: Concepts and Techniques
COBWEB Clustering Method
A classification tree
*
Data Mining: Concepts and Techniques
More on Statistical-Based Clustering
Limitations of COBWEB
The assumption
*
Data Mining: Concepts and Techniques
More on Statistical-Based Clustering
Limitations of COBWEB
The assumption
*
Data Mining: Concepts and Techniques
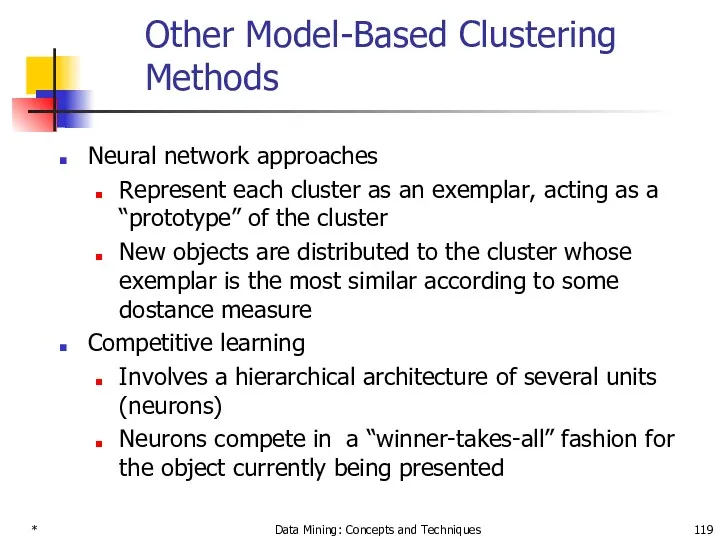
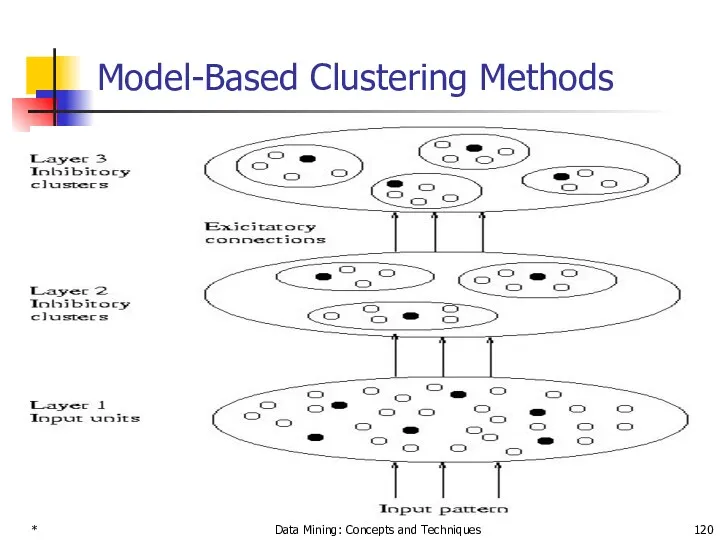
Other Model-Based Clustering Methods
Neural network approaches
Represent each
*
Data Mining: Concepts and Techniques
Other Model-Based Clustering Methods
Neural network approaches
Represent each
*
Data Mining: Concepts and Techniques
Model-Based Clustering Methods
*
Data Mining: Concepts and Techniques
Model-Based Clustering Methods
*
Data Mining: Concepts and Techniques
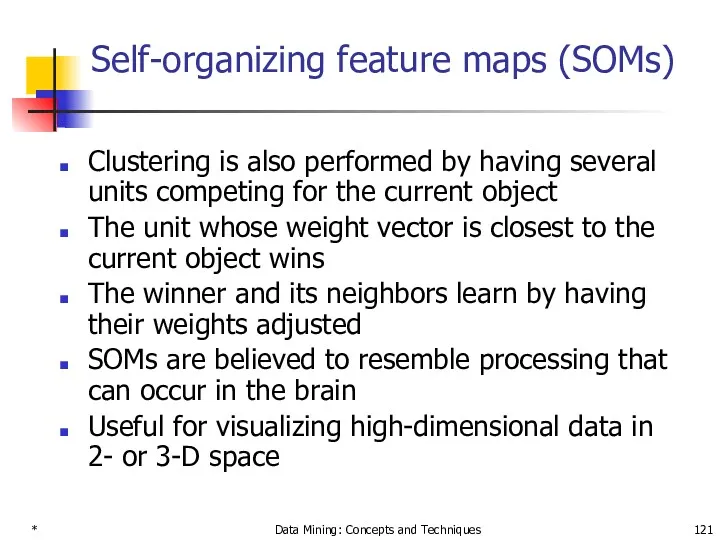
Self-organizing feature maps (SOMs)
Clustering is also performed
*
Data Mining: Concepts and Techniques
Self-organizing feature maps (SOMs)
Clustering is also performed
*
Data Mining: Concepts and Techniques
Chapter 8. Cluster Analysis
What is Cluster Analysis?
Types
*
Data Mining: Concepts and Techniques
Chapter 8. Cluster Analysis
What is Cluster Analysis?
Types
*
Data Mining: Concepts and Techniques
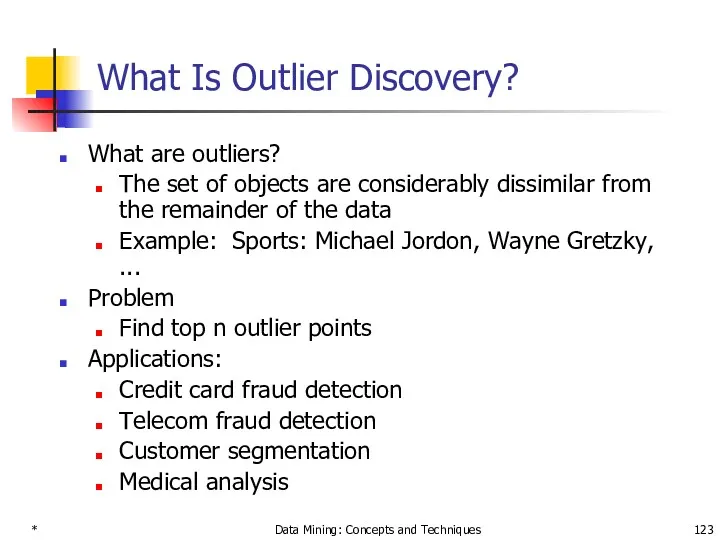
What Is Outlier Discovery?
What are outliers?
The set
*
Data Mining: Concepts and Techniques
What Is Outlier Discovery?
What are outliers?
The set
*
Data Mining: Concepts and Techniques
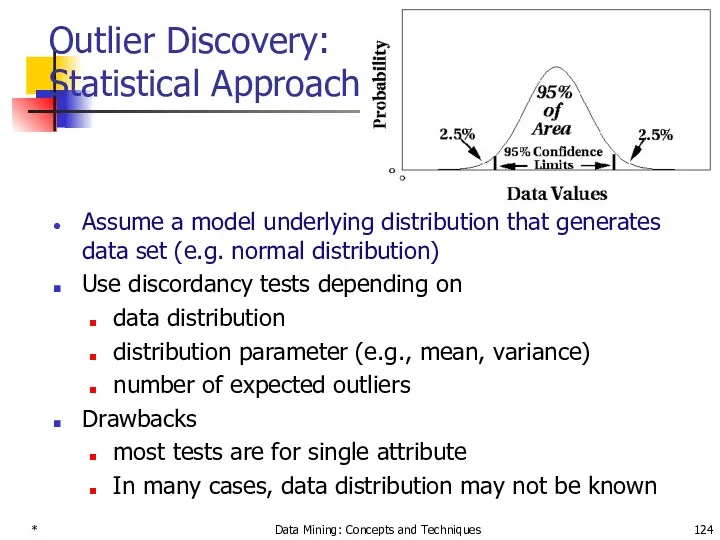
Outlier Discovery: Statistical Approaches
Assume a model underlying
*
Data Mining: Concepts and Techniques
Outlier Discovery: Statistical Approaches
Assume a model underlying
Outlier Discovery: Distance-Based Approach
Introduced to counter the main limitations imposed by
Outlier Discovery: Distance-Based Approach
Introduced to counter the main limitations imposed by
*
Data Mining: Concepts and Techniques
Outlier Discovery: Deviation-Based Approach
Identifies outliers by examining
*
Data Mining: Concepts and Techniques
Outlier Discovery: Deviation-Based Approach
Identifies outliers by examining
*
Data Mining: Concepts and Techniques
Chapter 8. Cluster Analysis
What is Cluster Analysis?
Types
*
Data Mining: Concepts and Techniques
Chapter 8. Cluster Analysis
What is Cluster Analysis?
Types
*
Data Mining: Concepts and Techniques
Problems and Challenges
Considerable progress has been made
*
Data Mining: Concepts and Techniques
Problems and Challenges
Considerable progress has been made
*
Data Mining: Concepts and Techniques
Constraint-Based Clustering Analysis
Clustering analysis: less parameters but
*
Data Mining: Concepts and Techniques
Constraint-Based Clustering Analysis
Clustering analysis: less parameters but
*
Data Mining: Concepts and Techniques
Clustering With Obstacle Objects
Taking obstacles into account
Not
*
Data Mining: Concepts and Techniques
Clustering With Obstacle Objects
Taking obstacles into account
Not
*
Data Mining: Concepts and Techniques
Summary
Cluster analysis groups objects based on their
*
Data Mining: Concepts and Techniques
Summary
Cluster analysis groups objects based on their

*
Data Mining: Concepts and Techniques
References (1)
R. Agrawal, J. Gehrke, D. Gunopulos,
*
Data Mining: Concepts and Techniques
References (1)
R. Agrawal, J. Gehrke, D. Gunopulos,
 Характеристики відмінної вимоги. (Лекція 3.2)
 Разработка урока обобщения и закрепления знаний, полученных при изучении курса Информатики в форме телевизионной игры Своя игра
 Графические возможности Matlab
 Структурная методология
 Специальные функции-члены класса. Лекция 11
 Телеканал ТВ Центр. Телевизионный сезон 2012-2013 гг
 Разработка ТЗ на новый SEO функционал на маркетплейсе
 Общие сведения о языке программирования Паскаль. Начала программирования. Информатика. 8 класс
 Letters emails
 Облачные технологии
 Компьютерная сеть та модель – OSI
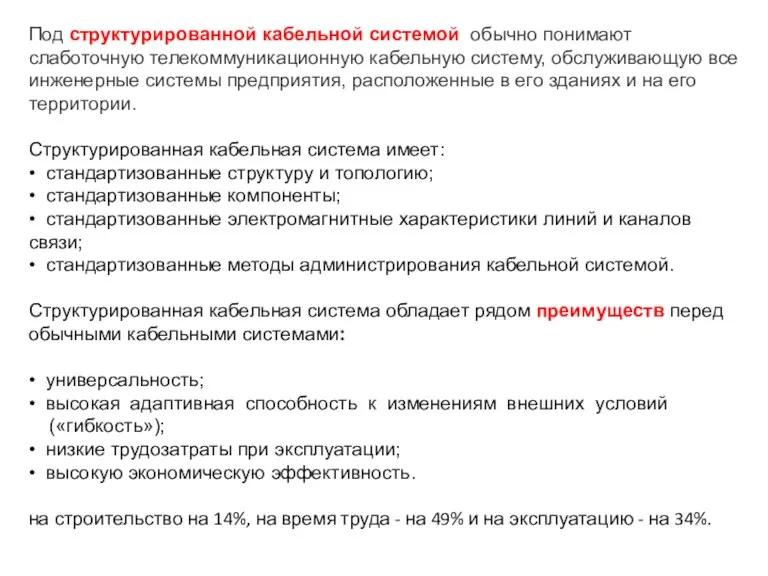 Структурированные кабельные системы
 Електронний щоденник засобами Delphi
 Коротка історія розвитку мов програмування
 Условный оператор if. Введение в программирование на языке Python
 Информационные объекты различных видов
 Адресация компьютеров в сети
 Changes in society by computing technology
 Way the newspaper is made
 Архитектура СУБД Oracle. Основные понятия. (Лекция 2)
 Технология CSS
 Презентация к Уроку Что такое алгоритм? Исполнители вокруг нас
 Рекурсия. Описание подпрограмм
 Турнир смекалистых
 Роботы будущего
 Использование функций в табличном процессоре MS EXCEL
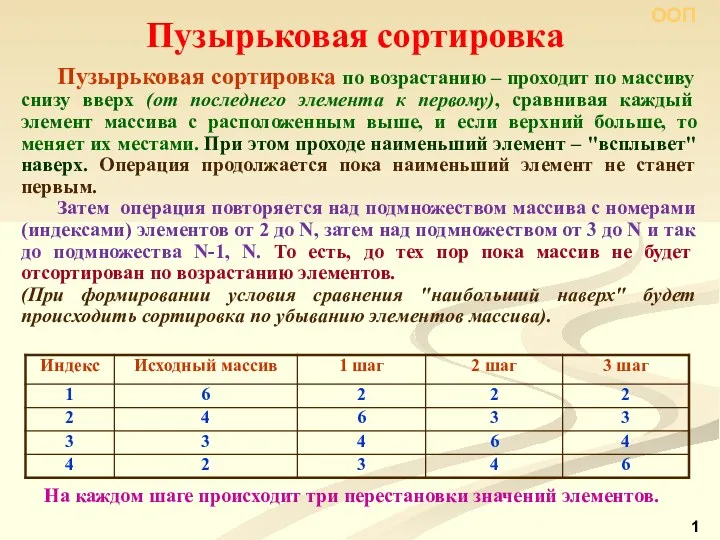 Пузырьковая сортировка
 Database systems