- Multiple regression analysis demand evaluation

Содержание
- 2. Simple linear regression is used to analyze the relationship between one independent variable affecting the demand,
- 3. We would like to investigate the relationship between demand and more than one independent variable that
- 4. multiple regression analysis
- 5. When using simple pair regression we consider that demand changes as a result of price changes,
- 6. Any change in any other variable, except price will cause a shift of the demand curve
- 7. Construction of multivariable demand function Task: Reflection of the relationship between dependent and independent variables
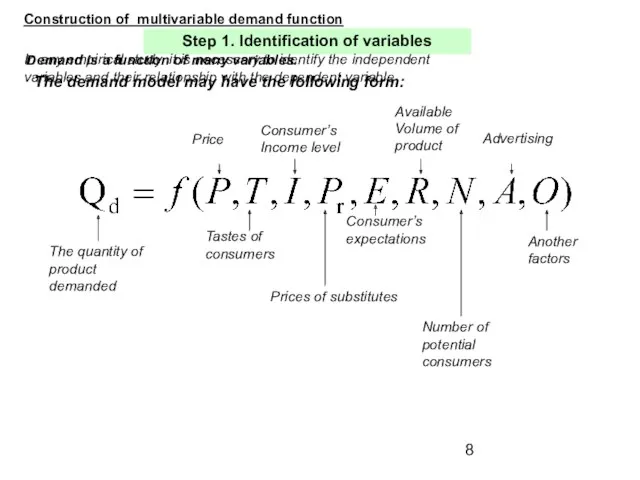
- 8. Construction of multivariable demand function Step 1. Identification of variables The quantity of product demanded Demand
- 9. We must also determine whether the independent variables are connected to each other It is not
- 10. Construction of multivariable demand function Step 2. Collection and refinement of data Consider the following aspects:
- 11. Organization of information (month, quarter, year); A greater number of observations allows us to achieve greater
- 12. The number of observations required to obtain good results Basic rule: well-chosen model requires the number
- 13. If the trend of the experimental values of the dependent variable is approximately linear, and there
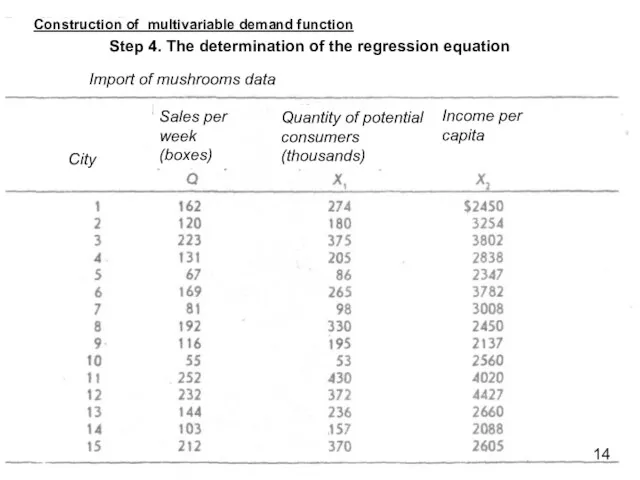
- 14. Construction of multivariable demand function Step 4. The determination of the regression equation 14 Import of
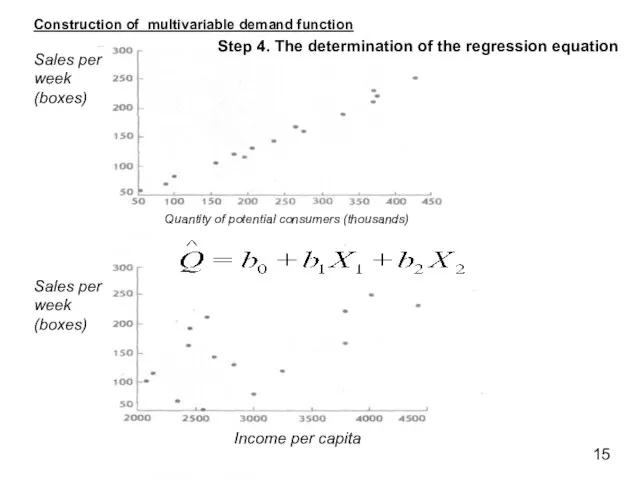
- 15. Construction of multivariable demand function Step 4. The determination of the regression equation 15 Quantity of
- 16. 0,009 Q = 3,5 + 0,5 X1 + 0,009 X2 Construction of multivariable demand function Step
- 18. Скачать презентацию

Simple linear regression is used to analyze the relationship between one
Simple linear regression is used to analyze the relationship between one
We would like to investigate the relationship between demand and more
We would like to investigate the relationship between demand and more

multiple regression analysis
multiple regression analysis
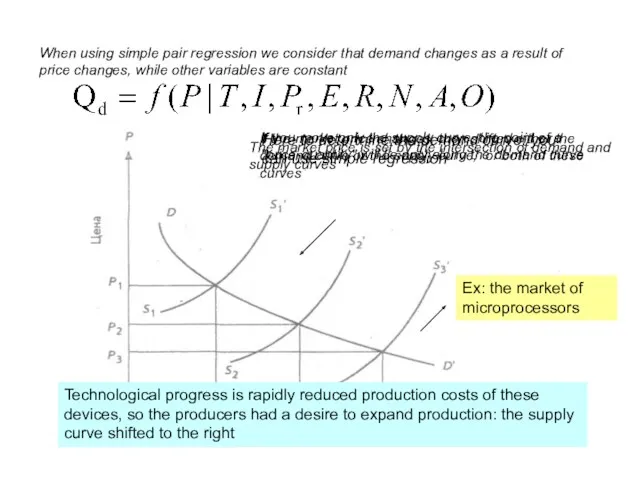
When using simple pair regression we consider that demand changes as
When using simple pair regression we consider that demand changes as
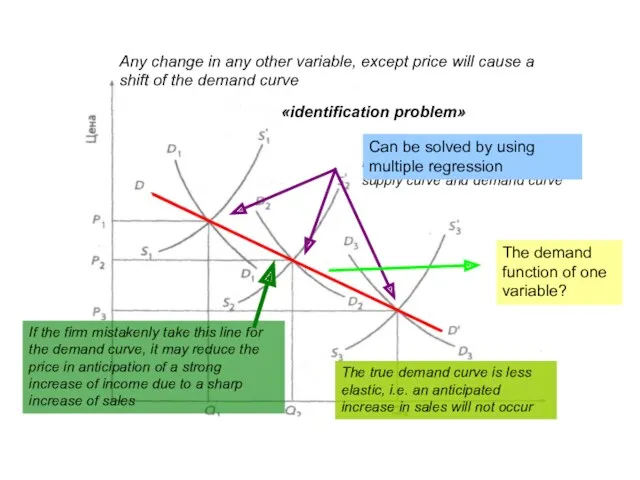
Any change in any other variable, except price will cause a
Any change in any other variable, except price will cause a

Construction of multivariable demand function
Task: Reflection of the relationship between dependent
Construction of multivariable demand function
Task: Reflection of the relationship between dependent
Construction of multivariable demand function
Step 1. Identification of variables
The quantity of
Construction of multivariable demand function
Step 1. Identification of variables
The quantity of
We must also determine whether the independent variables are connected to
We must also determine whether the independent variables are connected to
Construction of multivariable demand function
Step 2. Collection and refinement of data
Consider
Construction of multivariable demand function
Step 2. Collection and refinement of data
Consider
Organization of information (month, quarter, year);
A greater number of observations allows
Organization of information (month, quarter, year);
A greater number of observations allows
The number of observations required to obtain good results
Basic rule: well-chosen
The number of observations required to obtain good results
Basic rule: well-chosen
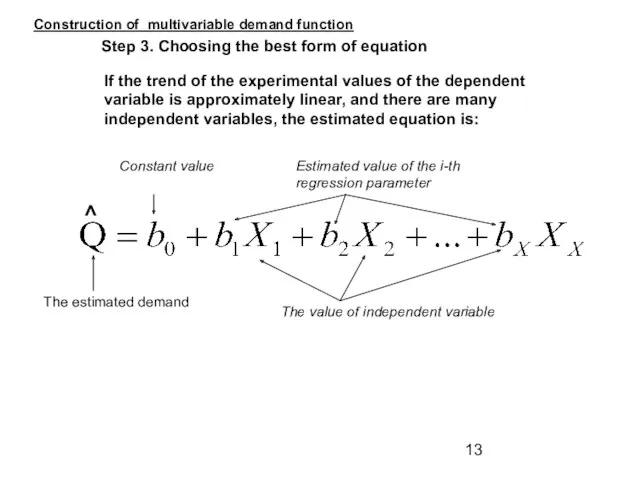
If the trend of the experimental values of the dependent variable
If the trend of the experimental values of the dependent variable
Construction of multivariable demand function
Step 4. The determination of the regression
Construction of multivariable demand function
Step 4. The determination of the regression
Construction of multivariable demand function
Step 4. The determination of the regression
Construction of multivariable demand function
Step 4. The determination of the regression
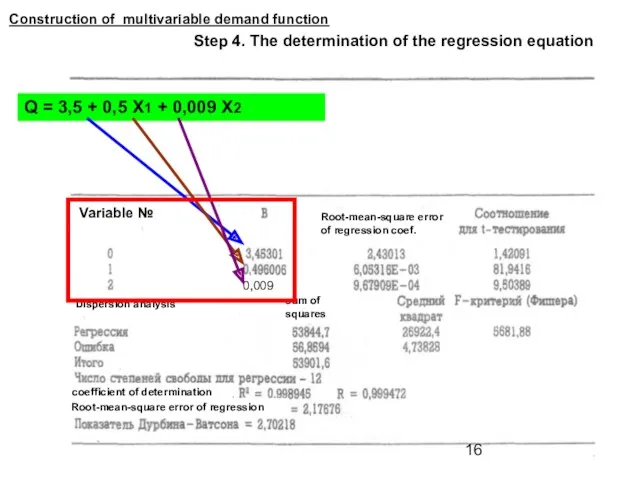
0,009
Q = 3,5 + 0,5 X1 + 0,009 X2
Construction of
0,009
Q = 3,5 + 0,5 X1 + 0,009 X2
Construction of
 Бюро переводов:С немецким просто
 Программа лояльности для питомников и заводчиков
 Номер 8-800 — удобно, просто и выгодно
 Новая концентрация аромата Want
 Структура продаж
 Маркетингові цінові стратегії підприємства
 Маркетинг в индустрии питания
 Формирование брендинга регионов – путь к успешному развитию территории
 Электронный рекламный буклет Творческой студии ILA
 Допродажи – это просто
 Дипломная работа Консалтинговая система на транспорте
 Фильм Аль Капоне. Размещение рекламы в фильме
 Каталог типовых решений для оснащения магазинов любого формата. Торговый дом Криспи
 Жилой комплекс Нахабино Ясное
 Компания Комус. Программа базовой подготовки водителей/экспедиторов
 Продвижение канала в социальных сетях
 Оптовая торговля, ее функции и особенности организации
 Винный магазин Вин.Со
 СДЭК. Международная логистическая компания
 Аренда декора, деревня Красный поселок, ЖК Сампо
 The history of marketing: main steps
 Управління маркетингом
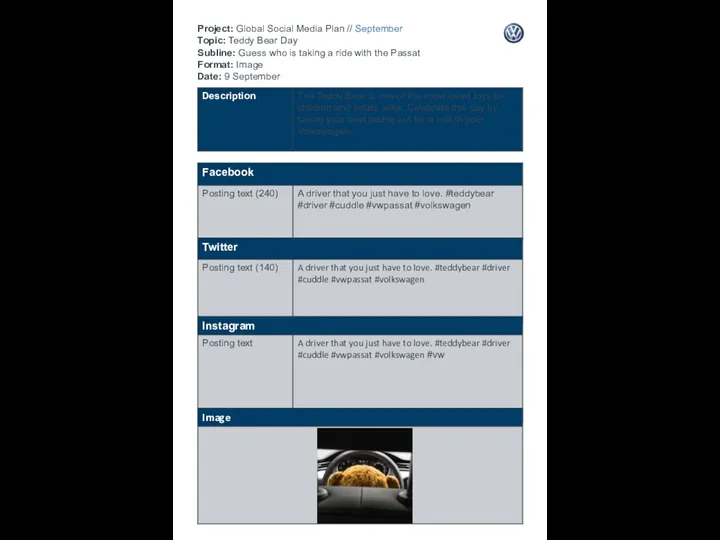 Global Social Media Plan // September Topic: Teddy Bear Day Subline: Guess who is taking a ride with the Passat
 Vibro mattress quotation
 Комерційний успіх фірми Sandor
 DHL - немецкая международная курьерская компания
 Сеть магазинов RCF-СТАРТ
 Контент-маркетинг. Задание на ЛР