- Admissions statistics

Содержание
- 2. Statistics on Students Admitted to the NUFYP 2016 - 2019
- 3. Statistics on admitted students by NU schools 2016 - 2019
- 4. Statistics on the Average Scores of entrance examinations 2016 - 2019
- 5. Results of IELTS test 2016 - 2019
- 6. Statistics on admitted students by Gender 2016 - 2019
- 7. Statistics on admitted students by regions 2016 – 2019
- 8. Distribution of Admitted Students by Regions 2016 28 24 7 41 12 20 53 101 40
- 9. Distribution of Admitted Students by Regions 2017 *1 student from Kyrgyz Republic *1 student from China
- 10. Distribution of Admitted Students by Regions 2018 *1 student from student from the Russian Federation *2
- 11. 22 22 14 26 20 20 27 8 28 97 44 50 139 24 18 11
- 13. Скачать презентацию
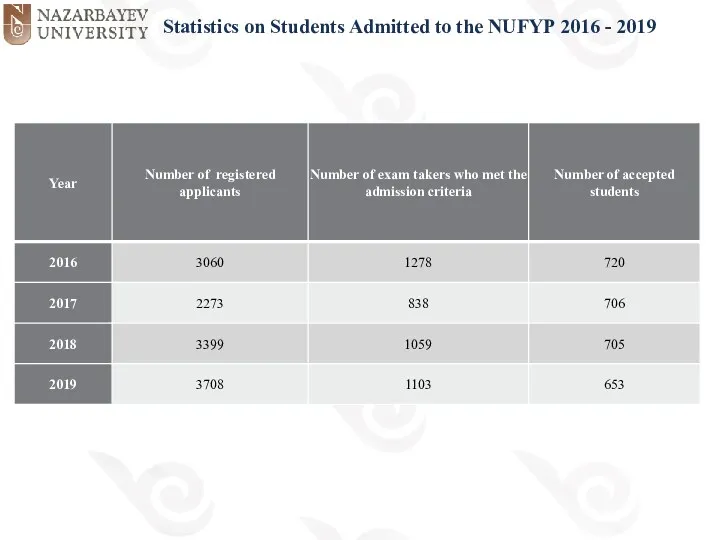
Statistics on Students Admitted to the NUFYP 2016 - 2019
Statistics on Students Admitted to the NUFYP 2016 - 2019
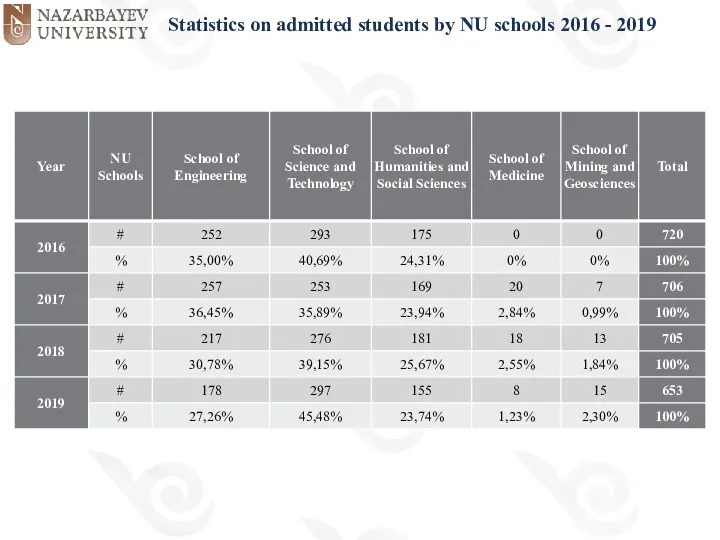
Statistics on admitted students by NU schools 2016 - 2019
Statistics on admitted students by NU schools 2016 - 2019
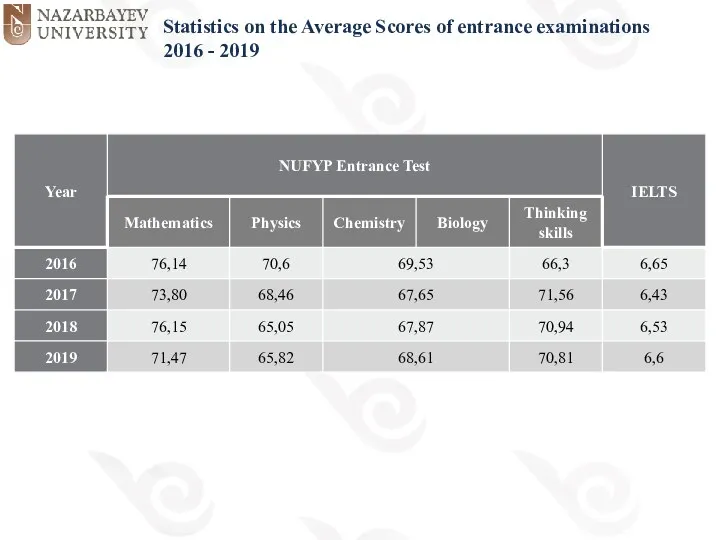
Statistics on the Average Scores of entrance examinations 2016 - 2019
Statistics on the Average Scores of entrance examinations 2016 - 2019
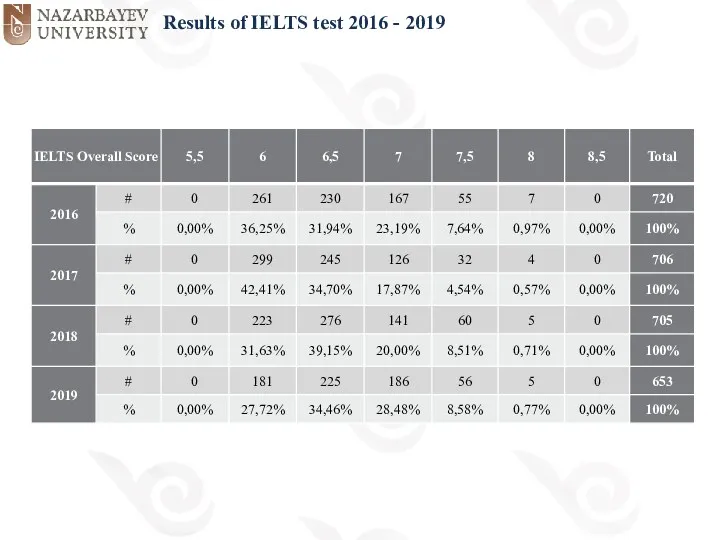
Results of IELTS test 2016 - 2019
Results of IELTS test 2016 - 2019
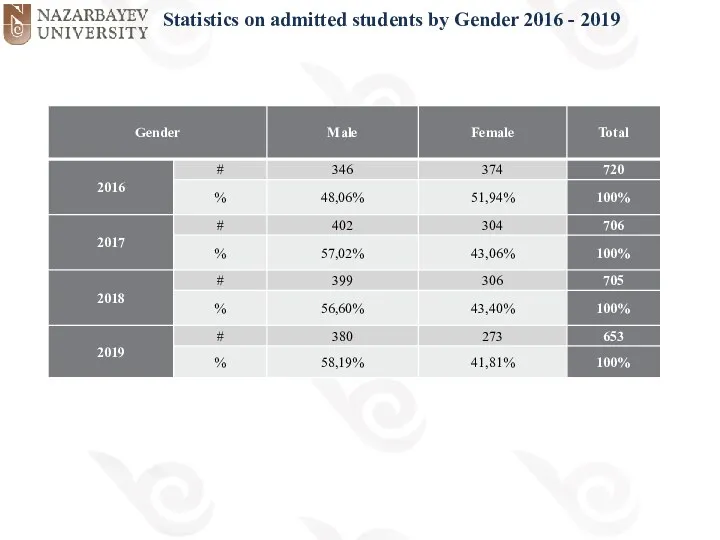
Statistics on admitted students by Gender 2016 - 2019
Statistics on admitted students by Gender 2016 - 2019
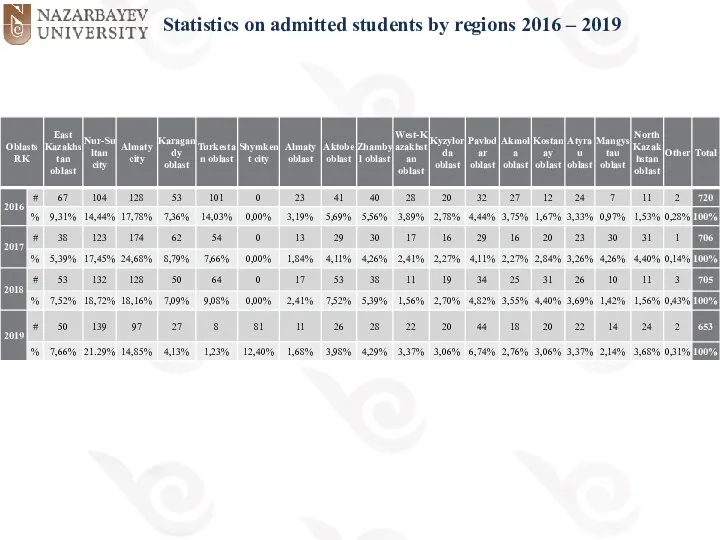
Statistics on admitted students by regions 2016 – 2019
Statistics on admitted students by regions 2016 – 2019
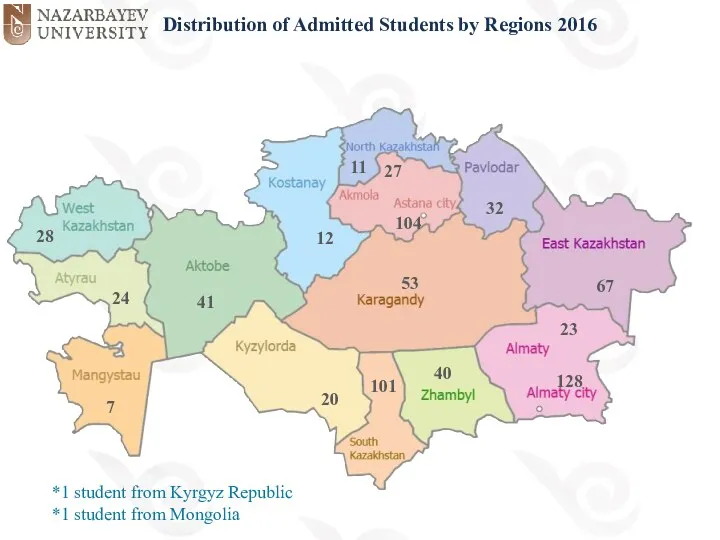
Distribution of Admitted Students by Regions 2016
28
24
7
41
12
20
53
101
40
128
32
67
104
11
27
23
*1 student from Kyrgyz Republic
*1
Distribution of Admitted Students by Regions 2016
28
24
7
41
12
20
53
101
40
128
32
67
104
11
27
23
*1 student from Kyrgyz Republic
*1
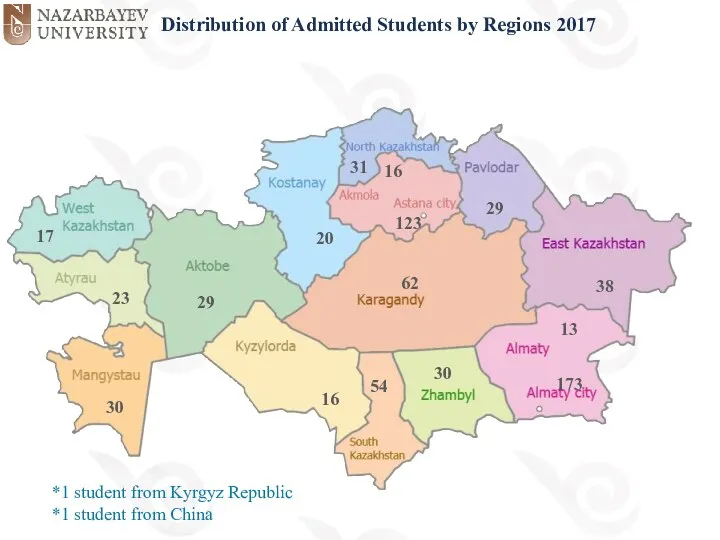
Distribution of Admitted Students by Regions 2017
*1 student from Kyrgyz Republic
*1
Distribution of Admitted Students by Regions 2017
*1 student from Kyrgyz Republic
*1

Distribution of Admitted Students by Regions 2018
*1 student from student from
Distribution of Admitted Students by Regions 2018
*1 student from student from
22
22
14
26
20
20
27
8
28
97
44
50
139
24
18
11
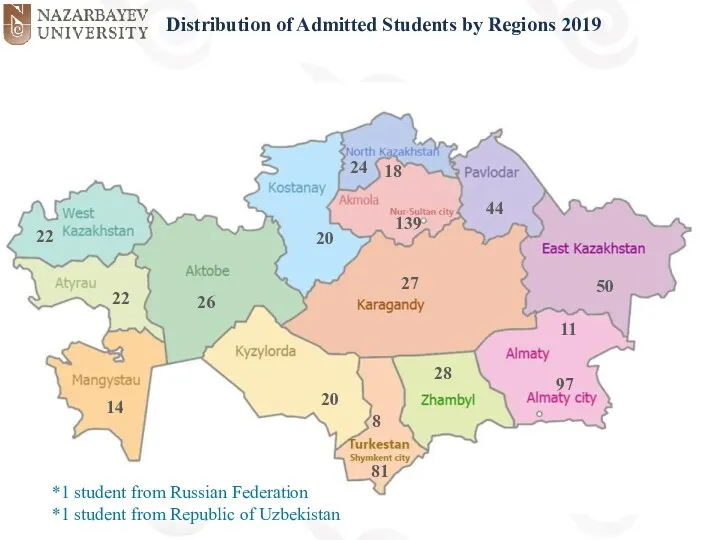
Distribution of Admitted Students by Regions 2019
*1 student from Russian Federation
*1
22
22
14
26
20
20
27
8
28
97
44
50
139
24
18
11
Distribution of Admitted Students by Regions 2019
*1 student from Russian Federation
*1
 Blast and Impact Research Department of Civil and Structural Engineering University of Sheffield, UK
 Правила оформления ВКР, курсовой работы, НИРС
 EF Россия – образование за рубежом
 Как стать офицером Российской армии. Правила приема в военные образовательные учреждения
 Жетысуский университет
 Вводные данные. Шаблон вебинара
 Современное образование Ленинградской области на 2014-2020 годы
 Тема урока: Этап проекта – Оформление результатов
 Интеллектуальная игра Что? Где? Когда?
 Реклама и связи с общественностью
 Предвыборная программа Абдулаева Тимура, кандидата на пост культурного организатора ассоциации студентов деревни универсиады
 Проектная деятельность
 Универсальные учебные действия
 Организация проведения Единого Государственного Экзамена
 Жоғары мектеп маман тұлғасын тәрбиелеу мен қалыптастырудың әлеуметтік институты ретінде
 Темы сочинений на сопоставление понятий верность и любовь, верность и дружба
 Иностранные языки. ФГОС ООО
 выступление на педсовете по теме Стандарты второго поколения
 Кильдинская детская музыкальная школа объявляет набор учащихся
 Взаимодействие семьи и школы во имя личностного развития школьника
 нурман мағжан
 KET. Тест из серии Кембриджских экзаменов, проверяющий способность справляться с английским языком на уровне (уровень А2)
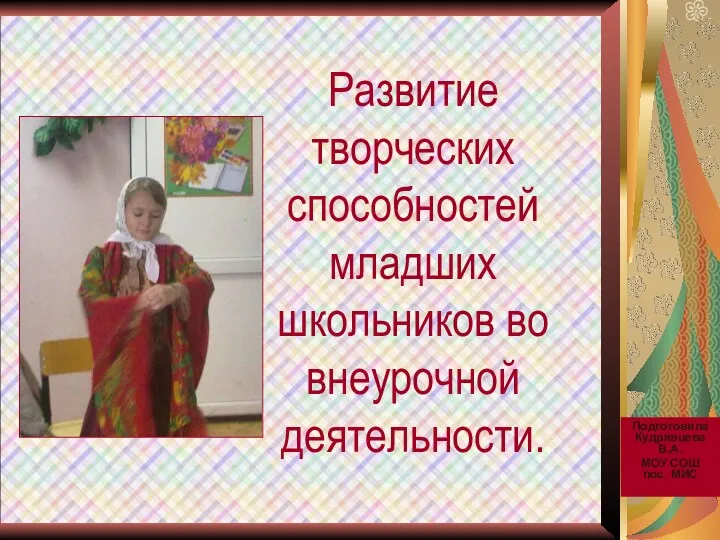 Развитие творческих способностей младших школьников
 Нормативные правовые акты, регламентирующие проведение ГИА-9 в 2019 году. Изменения в нормативных правовых документах
 Деятельность в ФГОС: опыт внедрения, проблемы и перспективы
 Система оценки достижений планируемых результатов освоения основной образовательной программы начального общего образования
 Творческий проект Замок Фей (макет)
 Метод учебного проекта