- A day in the life of the average american

Содержание
- 2. GLOSSARY: to be conducted by [kənˈdʌkt] – быть проводимым, осуществляемым the estimation [ˌestɪˈmeɪʃn] – оценка, мнение,
- 3. I. The American Time Use Survey Is conducted by the U.S. Bureau of Labor Statistics Asks
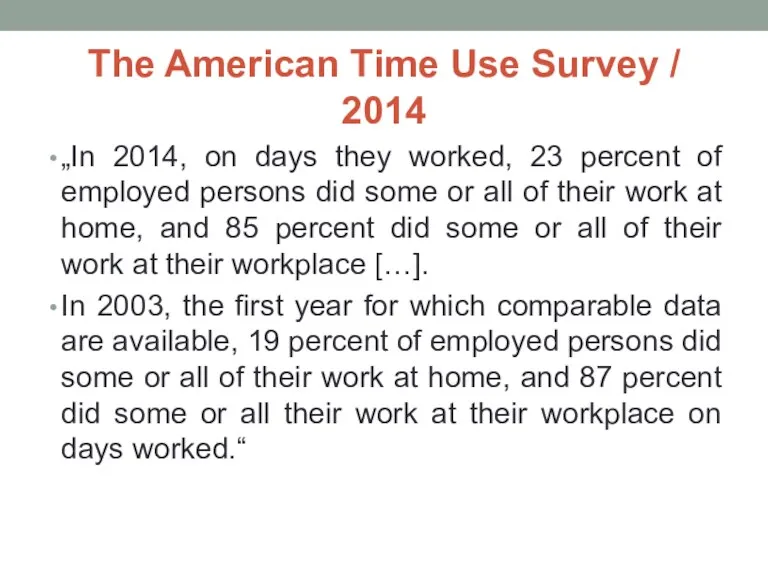
- 4. The American Time Use Survey / 2014 „In 2014, on days they worked, 23 percent of
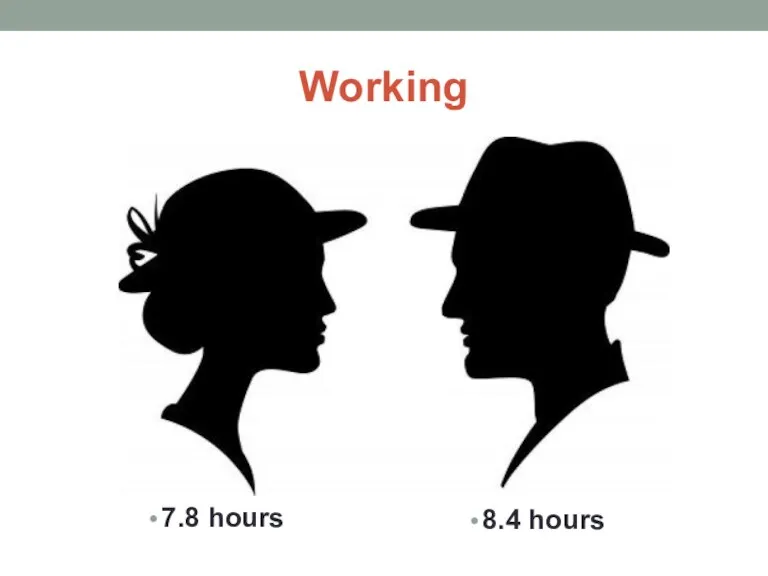
- 5. Working 7.8 hours 8.4 hours
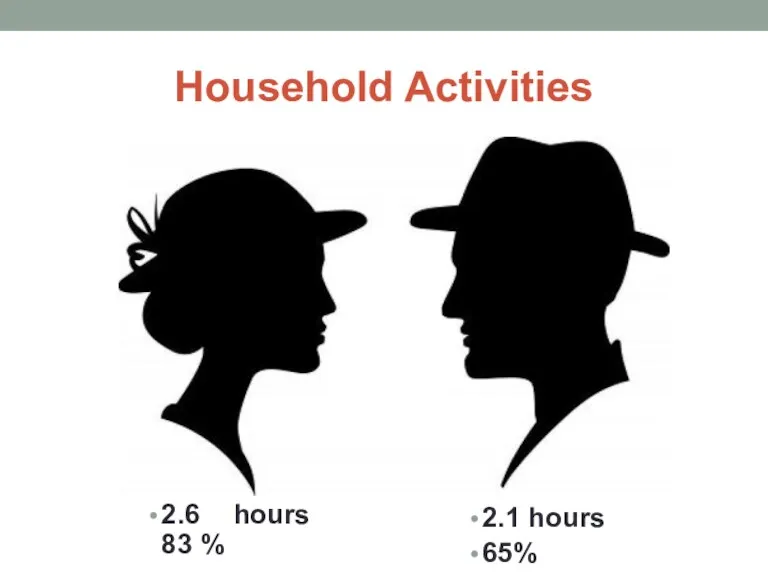
- 6. Household Activities 2.6 hours 83 % 2.1 hours 65%
- 7. Leisure Activities 5.2 hours 5.0 hours
- 8. Childcare 1.0 hour/ 2.1 hours 23 minutes/ 1.8 hours
- 9. II. The Moving Bubbles Chart by Nathan Yau (USA) shows transition probabilities for one activity to
- 12. Waking up
- 13. Lunch hour
- 14. Getting off work
- 16. Скачать презентацию
![GLOSSARY: to be conducted by [kənˈdʌkt] – быть проводимым, осуществляемым](/_ipx/f_webp&q_80&fit_contain&s_1440x1080/imagesDir/jpg/438426/slide-1.jpg)
GLOSSARY:
to be conducted by [kənˈdʌkt] – быть проводимым, осуществляемым
the estimation [ˌestɪˈmeɪʃn] –
GLOSSARY:
to be conducted by [kənˈdʌkt] – быть проводимым, осуществляемым
the estimation [ˌestɪˈmeɪʃn] –
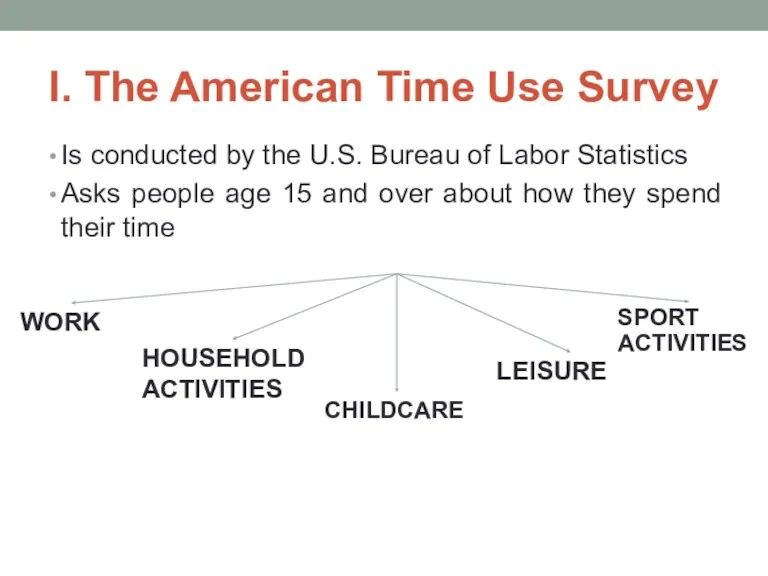
I. The American Time Use Survey
Is conducted by the U.S. Bureau
I. The American Time Use Survey
Is conducted by the U.S. Bureau
The American Time Use Survey / 2014
„In 2014, on days they
The American Time Use Survey / 2014
„In 2014, on days they
Working
7.8 hours
8.4 hours
Working
7.8 hours
8.4 hours
Household Activities
2.6 hours
83 %
2.1 hours
65%
Household Activities
2.6 hours
83 %
2.1 hours
65%
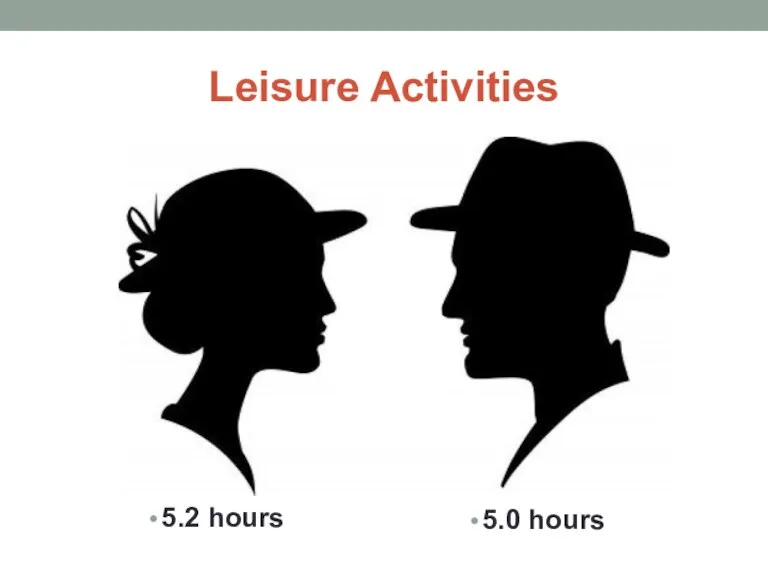
Leisure Activities
5.2 hours
5.0 hours
Leisure Activities
5.2 hours
5.0 hours
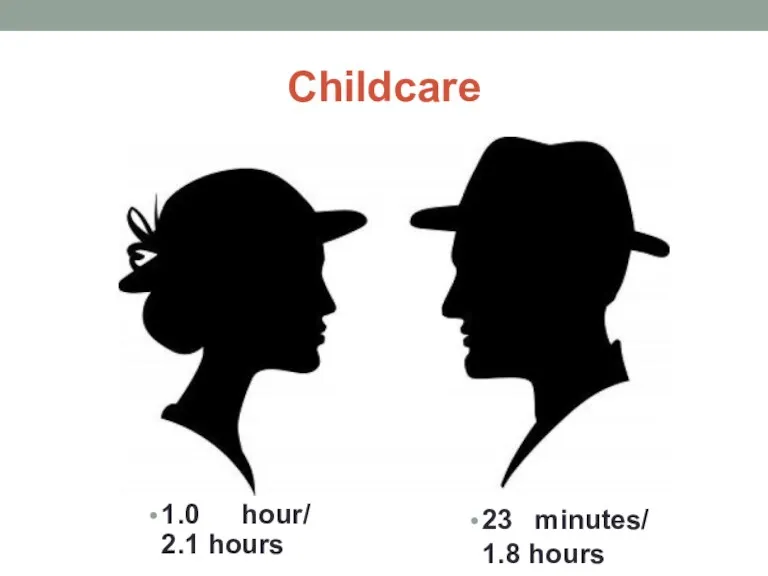
Childcare
1.0 hour/ 2.1 hours
23 minutes/ 1.8 hours
Childcare
1.0 hour/ 2.1 hours
23 minutes/ 1.8 hours
II. The Moving Bubbles Chart
by Nathan Yau (USA)
shows transition probabilities for
II. The Moving Bubbles Chart
by Nathan Yau (USA)
shows transition probabilities for


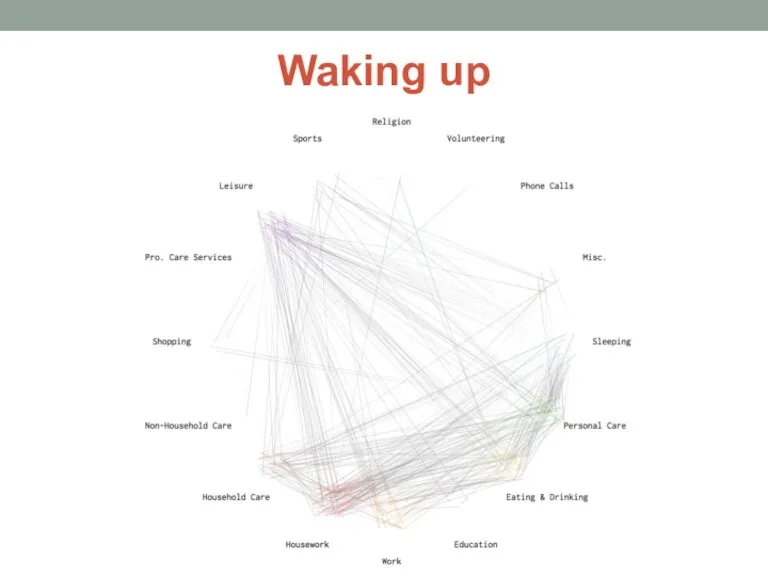
Waking up
Waking up
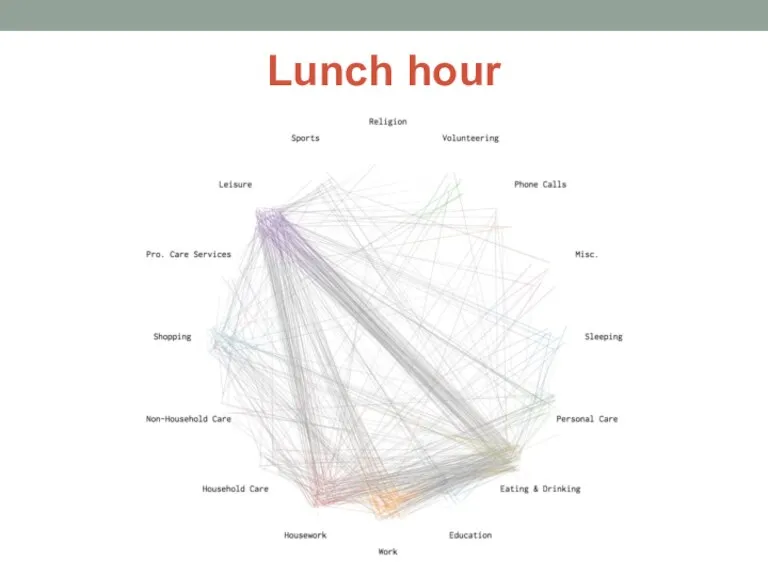
Lunch hour
Lunch hour
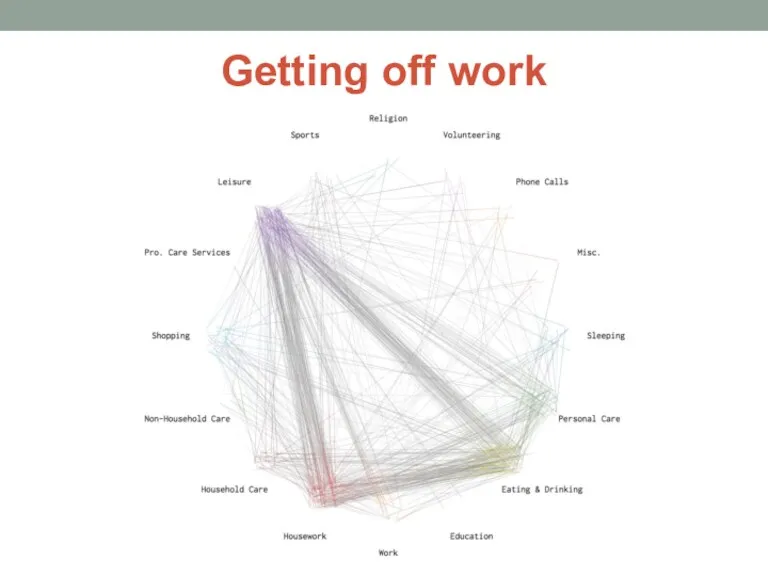
Getting off work
Getting off work
 Основные принципы организаций работы с детьми инвалидами
 Сад памяти. Международная акция
 Общественная организация: Совет молодёжи
 Культурный центр ЗИЛ. Актуальное городское событие для старшего возраста
 Личность
 Социальные статусы и роли
 Социальное развитие и молодежь (обществознание, 10 класс)
 Социальная сущность человека
 Социальная мобильность
 Хиппи. 8 класс
 Демографическая ситуация в России. 11 класс
 KotoВасия. Целевая группа
 презентация - Потребности человека
 Мастерство работника (Обществознание 7 класс)
 Экономическая сфера жизни общества
 Годовой отчёт Калужского регионального отделения ООДО Лига юных журналистов
 Урок обществознания в 11 классеРынок труда
 Ресурсный центр
 Контент-анализ
 Семья. Тест
 презентация по обществознанию
 Социальная защита населения
 Глобальные проблемы современности
 Соціальні відносини
 Символика МООО Российские студенческие отряды
 Презентация к уроку обществознания в 6 классе по теме Мораль
 Государственная молодежная политика во Франции
 Бережливый проект