Слайд 2
Effectiveness Evaluation About the Tsunami
Measures Taken at Kashiwazaki-Kariwa NPS
All of the
nuclear power stations of TEPCO had experienced huge external events. One of which is the Niigata-ken Chuetsu-Oki earthquake in 2007 at Kashiwazaki-Kariwa Nuclear Power Station (NPS), and the other is the Great East Japan Earthquake in 2011 at Fukushima Daiichi NPS and Fukushima Daini NPS. Especially, the Fukushima Daiichi Units 1–3 experienced severe accident, since prolonged station blackout (SBO) and loss of ultimate heat sink (LUHS) were induced by the huge tsunami which was generated by the Great East Japan Earth- quake. The most important lesson learned was that the defense-in-depth for external event was insufficient. Therefore, we are implementing many safety enhancement measures for tsunami in our Kashiwazaki-Kariwa Nuclear Power Station. Thus, in order to confirm the effectiveness of these safety enhancement measures, TEPCO performed tsunami PRA studies. The studies were conducted in accordance with “The Standard of Tsunami Probabilistic Risk Assessment (PRA) for nuclear power plants” established by the Atomic Energy Society of Japan. TEPCO conducted two state (the state before the implementation of accident management (AM) measures and the state at the present) evaluations to confirm the effectiveness of the safety enhancement measures. In this evaluation, TEPCO were able to confirm the effectiveness of safety enhancement measures carried out towards plant vulnerabilities that were found before these measures were implemented.
Слайд 3
Effectiveness Evaluation About the Tsunami
Measures Taken at Kashiwazaki-Kariwa NPS
All of the
nuclear power stations of TEPCO had experienced huge external events. One of which is the Niigata-ken Chuetsu-Oki earthquake in 2007 at Kashiwazaki-Kariwa Nuclear Power Station (NPS), and the other is the Great East Japan Earthquake in 2011 at Fukushima Daiichi NPS and Fukushima Daini NPS. Especially, the Fukushima Daiichi Units 1–3 experienced severe accident, since prolonged station blackout (SBO) and loss of ultimate heat sink (LUHS) were induced by the huge tsunami which was generated by the Great East Japan Earthquake.
One of the lessons learned is “defense-in-depth for tsunami was insufficient.” In terms of safety enhancement of nuclear power plant from this lesson, countermeasure for each layer of defense-in-depth against tsunami is enhanced in the Kashiwazaki-Kariwa NPS. Then, we perform tsunami PRA in order to understand plant vulnerability and to check validity of deployed countermeasure against tsunami for Unit 7 (ABWR) of the Kashiwazaki-Kariwa NPS. This paper describes the evaluation result completed by applying to states before and after the implementation of the tsunami countermeasures.
Слайд 4
Effectiveness Evaluation About the Tsunami
Measures Taken at Kashiwazaki-Kariwa NPS
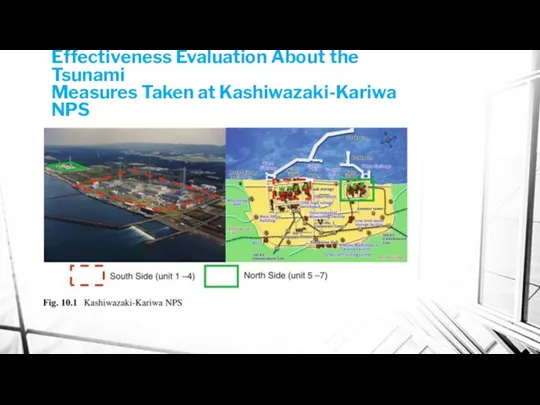
The Kashiwazaki-Kariwa Nuclear
Power Plant (see Fig. 10.1) is located in Kariwa Village and Kashiwazaki City in Niigata Prefecture facing on the coast of the Japan Sea, and seven nuclear reactors (Unit 1–5: BWR5, Unit 6, 7: ABWR, a total of 8212 MWe) are built. The ground elevation is T.P. 5 m (Tokyo Peil: sea-level of Tokyo Bay) at the north side (Units 1–5) and T.P. 12 m at the south side (Units 5–7).
Слайд 5
Effectiveness Evaluation About the Tsunami
Measures Taken at Kashiwazaki-Kariwa NPS
Слайд 6
Effectiveness Evaluation About the Tsunami
Measures Taken at Kashiwazaki-Kariwa NPS
In Japan, from
the lesson of the Fukushima Daiichi accident, development of tsunami PRA method was accelerated immediately after the accident, and Atomic Energy Society of Japan (AESJ) issued tsunami PRA guideline in February 2012 [1]. Then, TEPCO started to perform tsunami PRA to evaluate the effectiveness of tsunami countermeasures. In the state before the implementation of tsunami countermeasures, since there is no means to prevent flooding to building and function failure of important equipment assuming generation of tsunami exceeding the 1st floor height of the building, each flooding propagation evaluation and fragility evaluation is done with a simple method, and the core damage frequency (CDF) for each accident sequence is calculated.
Слайд 7
Effectiveness Evaluation About the Tsunami
Measures Taken at Kashiwazaki-Kariwa NPS
Tsunami hazard for
the Kashiwazaki-Kariwa NPS is evaluated based on the “method of probabilistic tsunami hazard analysis” [2] issued in 2009 by the Japan Society of Civil Engineers (JSCE). However, the occurrence frequency and the scale of earthquake, assuming multi-segment rupture of the faults which is the latest knowledge acquired in the 2011 off the Pacific coast of Tohoku Earthquake, are also taken into consideration.
Regarding the tsunami-induced source area, the tsunami induced by earthquake, originated by faults which exist in the area, is determined in terms of whether they have significant influence on the tsunami hazard of the Kashiwazaki-Kariwa NPS. As a result, the following areas are selected:
1. The fault which is considered in seismic design and is identified by geological survey, etc.
2. The fault which is unidentified by investigation, but indicated by an external organization (epicenter at coast of the Niigata southwest earthquake).
3. The east edge of Japan Sea; Kashiwazaki-Kariwa NPS is considered to be affected significantly when tsunami occurs there.
Слайд 8
Effectiveness Evaluation About the Tsunami
Measures Taken at Kashiwazaki-Kariwa NPS
Regarding these tsunami
occurrence areas, the tsunami occurrence scenario is created by setting up the magnitude range and the earthquake recurrence interval.
Random uncertainty in a numerical computation model and epistemic uncertainty regarding some issues such as the existence of active fault and magnitude range, etc., are considered in tsunami hazard evaluation. Epistemic uncertainty is dealt with as number of branch of tsunami occurrence scenario, and given weighting to each scenario. Weights of discrete branches that represent alternative hypotheses and interpretations were determined by the JSCE guideline basically. In this evaluation, the magnitude range, earthquake occurrence probability, probability of multi-segment rupture of the faults, and probability distributions of random uncertainty are taken into consideration.
Слайд 9
Effectiveness Evaluation About the Tsunami
Measures Taken at Kashiwazaki-Kariwa NPS
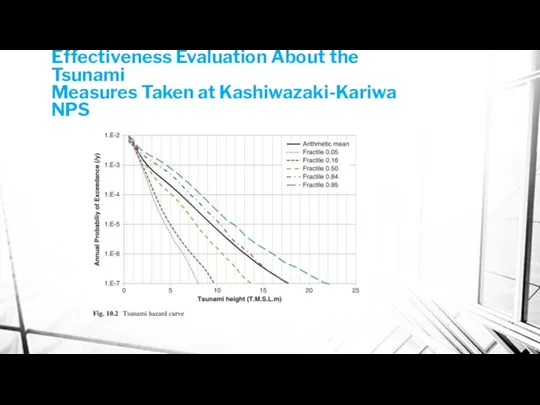
The annual probability
of exceedance of tsunami wave height is created for each tsunami occurrence scenario defined in Sects. 11.3.1.1 and 11.3.1.2. Next, for each curve, with consideration for the weighting corresponding to each scenario, statistical processing is performed, and hazard curve is created for weighted average as arithmetic average for weighted accumulation sum as fractal curve. As mentioned above, the tsunami hazard curve (tsunami run-up area at the north side) is shown in Fig. 10.2. In evaluation of the state before the implementation of tsunami countermeasures, when tsunami exceeds height of the 1st floor of building, it is simply assumed that flooding in the building occurs and equipment function is lost, and it causes core damage. For example, in the evaluation of Unit 7, since the 1st floor height is T.P.12.3 m, when the tsunami beyond this height strikes, it is evaluated as core damage occurs.
Слайд 10
Effectiveness Evaluation About the Tsunami
Measures Taken at Kashiwazaki-Kariwa NPS
Слайд 11
Effectiveness Evaluation About the Tsunami
Measures Taken at Kashiwazaki-Kariwa NPS
Regarding influence of
tsunami on equipment, damage by flooding and by tsunami wave force is considered. Regarding equipment on yard and door on outer wall of the buildings such as yard tank, yard watertight door, etc., the failure probability against tsunami wave force is set by flooding depth based on tsunami run-up analysis result.
Regarding equipment and door inside building, the damage probability is set by flooding propagation analysis result for building. Regarding tsunami run-up analysis, it is performed for multi-case of tsunami height. For each case, fragility curve is evaluated from the equipment damage probability with consideration for the uncertainty in the flooding depth of the installation location for each equipment.
Слайд 12
Effectiveness Evaluation About the Tsunami
Measures Taken at Kashiwazaki-Kariwa NPS
The main assumptions
in the fragility evaluation are shown below:
1. Embankment, tidal wall When tsunami exceeds the height of the embankment or tidal wall, these failures are assumed.
2. Watertight door, general door Regarding protection doors installed on building outer wall, fragility evaluation is conservatively performed with consideration for tsunami wave force.
3. Yard tanks (light oil tank, pure water storage tank) Since these tanks are on the ground, damage evaluation by tsunami wave force is performed, but evaluation for flooding and function affected by water level by submersion is also performed.
4. Fire protection system piping Fracture evaluation is performed for bending load of piping changed by tsunami wave force. Branch piping which has high failure possibility is also taken into consideration.
5. Equipment in building (reactor core isolation cooling system (RCIC), power panel, etc.) Flooding propagation evaluation in building is performed, and when the concerned equipment and required support system are inundated, the function failures are assumed.
Слайд 13
Effectiveness Evaluation About the Tsunami
Measures Taken at Kashiwazaki-Kariwa NPS
However, in evaluation
of the state before the implementation of tsunami countermeasures, fragility evaluation with consideration for uncertainty is not performed, but method that the events induced by the tsunami of a certain height are deterministically evaluated is adopted.
At the state before the implementation of tsunami countermeasures, it is assumed accident scenarios considering flooding according to the tsunami wave height. In addition, if the tsunami height is below the site level (T.P. 12 m), it is assumed that inundation starts via maintenance hatch (T.P. 3.5 m) in the heat exchanger area in the turbine building when tsunami height exceeds T.P. 3.5 m. Also, it is conservatively assumed that all the buildings connected to turbine building are flooded to the tsunami height.
Слайд 14
Effectiveness Evaluation About the Tsunami
Measures Taken at Kashiwazaki-Kariwa NPS
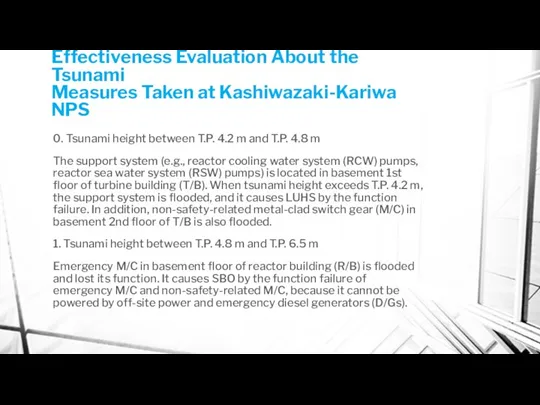
0. Tsunami height
between T.P. 4.2 m and T.P. 4.8 m
The support system (e.g., reactor cooling water system (RCW) pumps, reactor sea water system (RSW) pumps) is located in basement 1st floor of turbine building (T/B). When tsunami height exceeds T.P. 4.2 m, the support system is flooded, and it causes LUHS by the function failure. In addition, non-safety-related metal-clad switch gear (M/C) in basement 2nd floor of T/B is also flooded.
1. Tsunami height between T.P. 4.8 m and T.P. 6.5 m
Emergency M/C in basement floor of reactor building (R/B) is flooded and lost its function. It causes SBO by the function failure of emergency M/C and non-safety-related M/C, because it cannot be powered by off-site power and emergency diesel generators (D/Gs).
Слайд 15
Effectiveness Evaluation About the Tsunami
Measures Taken at Kashiwazaki-Kariwa NPS
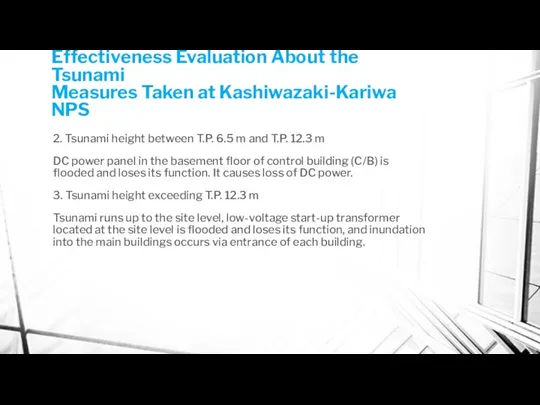
2. Tsunami height
between T.P. 6.5 m and T.P. 12.3 m
DC power panel in the basement floor of control building (C/B) is flooded and loses its function. It causes loss of DC power.
3. Tsunami height exceeding T.P. 12.3 m
Tsunami runs up to the site level, low-voltage start-up transformer located at the site level is flooded and loses its function, and inundation into the main buildings occurs via entrance of each building.
Слайд 16
Effectiveness Evaluation About the Tsunami
Measures Taken at Kashiwazaki-Kariwa NPS
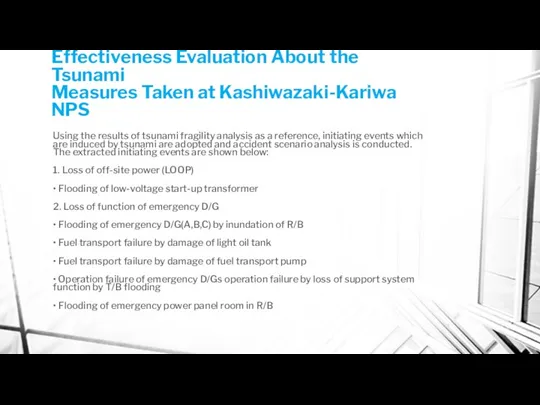
Using the results
of tsunami fragility analysis as a reference, initiating events which are induced by tsunami are adopted and accident scenario analysis is conducted. The extracted initiating events are shown below:
1. Loss of off-site power (LOOP)
• Flooding of low-voltage start-up transformer
2. Loss of function of emergency D/G
• Flooding of emergency D/G(A,B,C) by inundation of R/B
• Fuel transport failure by damage of light oil tank
• Fuel transport failure by damage of fuel transport pump
• Operation failure of emergency D/Gs operation failure by loss of support system function by T/B flooding
• Flooding of emergency power panel room in R/B
Слайд 17
Effectiveness Evaluation About the Tsunami
Measures Taken at Kashiwazaki-Kariwa NPS
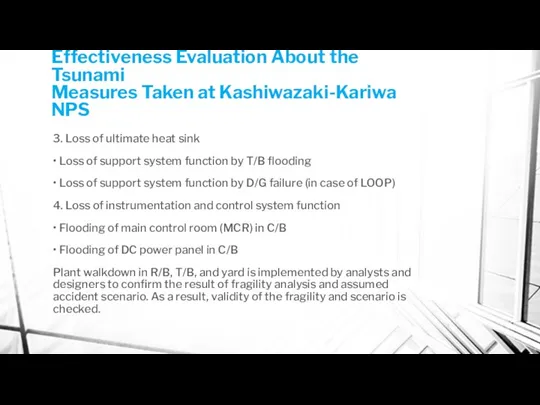
3. Loss of
ultimate heat sink
• Loss of support system function by T/B flooding
• Loss of support system function by D/G failure (in case of LOOP)
4. Loss of instrumentation and control system function
• Flooding of main control room (MCR) in C/B
• Flooding of DC power panel in C/B
Plant walkdown in R/B, T/B, and yard is implemented by analysts and designers to confirm the result of fragility analysis and assumed accident scenario. As a result, validity of the fragility and scenario is checked.
Слайд 18
Effectiveness Evaluation About the Tsunami
Measures Taken at Kashiwazaki-Kariwa NPS
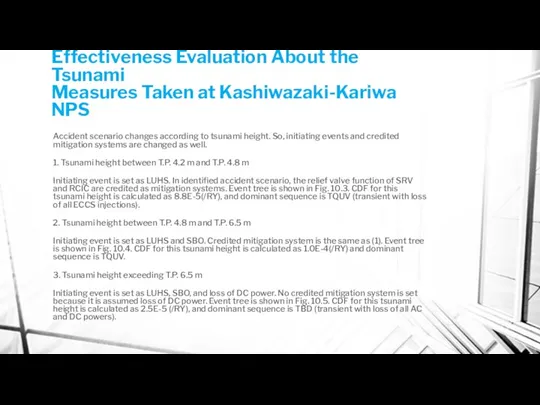
Accident scenario changes
according to tsunami height. So, initiating events and credited mitigation systems are changed as well.
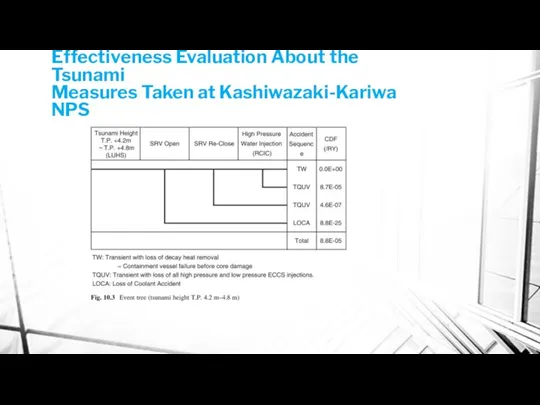
1. Tsunami height between T.P. 4.2 m and T.P. 4.8 m
Initiating event is set as LUHS. In identified accident scenario, the relief valve function of SRV and RCIC are credited as mitigation systems. Event tree is shown in Fig. 10.3. CDF for this tsunami height is calculated as 8.8E-5(/RY), and dominant sequence is TQUV (transient with loss of all ECCS injections).
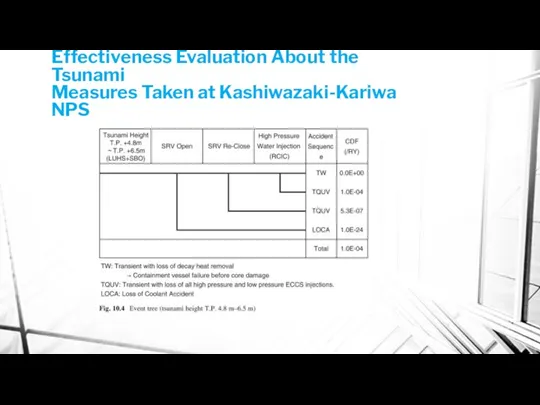
2. Tsunami height between T.P. 4.8 m and T.P. 6.5 m
Initiating event is set as LUHS and SBO. Credited mitigation system is the same as (1). Event tree is shown in Fig. 10.4. CDF for this tsunami height is calculated as 1.0E-4(/RY) and dominant sequence is TQUV.
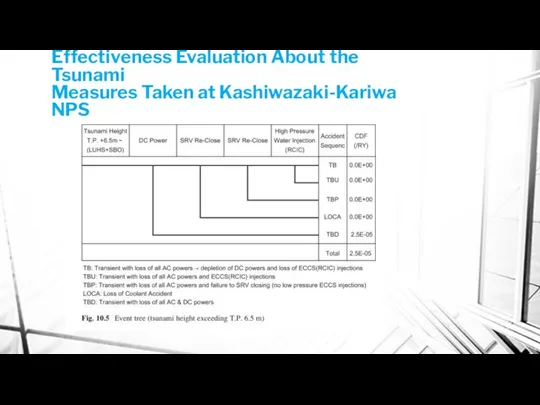
3. Tsunami height exceeding T.P. 6.5 m
Initiating event is set as LUHS, SBO, and loss of DC power. No credited mitigation system is set because it is assumed loss of DC power. Event tree is shown in Fig. 10.5. CDF for this tsunami height is calculated as 2.5E-5 (/RY), and dominant sequence is TBD (transient with loss of all AC and DC powers).
Слайд 19
Effectiveness Evaluation About the Tsunami
Measures Taken at Kashiwazaki-Kariwa NPS
Слайд 20
Effectiveness Evaluation About the Tsunami
Measures Taken at Kashiwazaki-Kariwa NPS
Слайд 21
Effectiveness Evaluation About the Tsunami
Measures Taken at Kashiwazaki-Kariwa NPS
Слайд 22
Effectiveness Evaluation About the Tsunami
Measures Taken at Kashiwazaki-Kariwa NPS
Слайд 23
Effectiveness Evaluation About the Tsunami
Measures Taken at Kashiwazaki-Kariwa NPS
Based on the
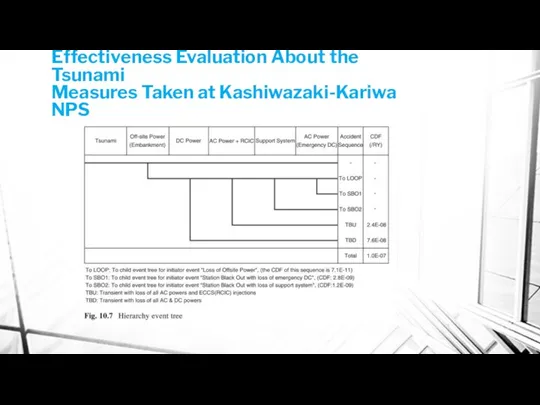
result of tsunami fragility analysis, in the accident sequence analysis, failure rate which is relevant to initiating events or equipment relevant to credited mitigation system is calculated, and combination of tsunami height and damaged equipment is considered. Regarding the accident sequence analysis, tsunami initiating hierarchy event tree is constructed. In this event tree, yard equipment whose failure is directly connected to the initiating event is set as heading. The hierarchy event tree is shown in Fig. 10.7. In event tree for each initiating event which is expanded from the hierarchy event tree, yard equipment which is not considered as heading is set as mitigation systems.
The outline of accident sequence analysis is described below:
1. Tsunami height between T.P. 15 m and T.P. 17 m
Because, as shown by the fragility analysis result, the watertight doors of each building are not broken by tsunami of this height, inundation into the buildings does not occur, but the fuel transport pumps on yard are destroyed by tsunami. In this state, random failure of temporary oil transport pump which is installed thereafter is assumed. Because of this, all emergency D/Gs lose their function,and it causes the SBO.
Слайд 24
Effectiveness Evaluation About the Tsunami
Measures Taken at Kashiwazaki-Kariwa NPS
2. Tsunami height
between T.P. 17 m and T.P. 18 m
Because, as shown by the fragility analysis result, the watertight doors of T/B and R/B are broken by tsunami of this height, inundation into the T/B and R /B occurs. Inundation into the T/B causes the flooding of support systems (e.g., RCW and RSW pumps) and the loss of its function, and then LUHS occurs.
Also, inundation into the R/B causes the flooding of RCIC control panel and the loss of RCIC function. Then all of the water injection function failure is occurred.
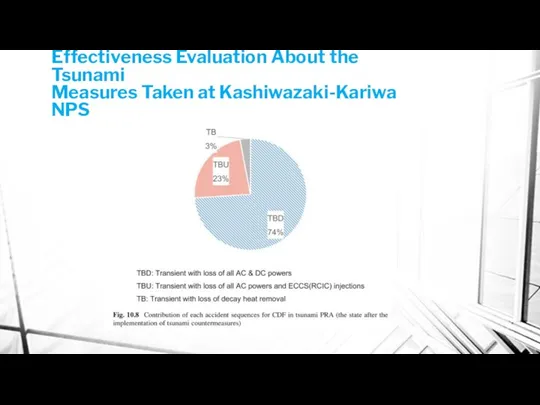
3. Tsunami height exceeding T.P. 18 m
Because, as shown by the fragility analysis result, the watertight door of C/B is broken by tsunami of this height, inundation into the C/B occurs, and it causes the loss of DC power (TBD).
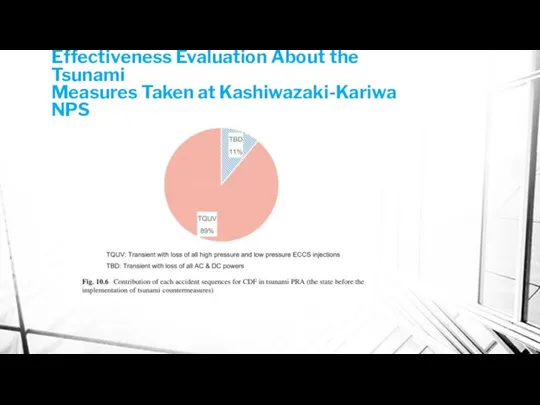
Tsunami PRA result at the state after the implementation of countermeasures is shown in Fig. 10.8. Total CDF is calculated as 1.0E-7(/RY) in average value. As for accident sequence rate, TBD is dominant sequence accounting for 74 percentages in total CDF.
Слайд 25
Effectiveness Evaluation About the Tsunami
Measures Taken at Kashiwazaki-Kariwa NPS
Слайд 26
Effectiveness Evaluation About the Tsunami
Measures Taken at Kashiwazaki-Kariwa NPS

 Правила поведения в лесу. Викторина
 Терроризм – глобальная проблема современности
 Основы профилактики спортивного травматизма
 Мастер-класс для родителей по правилам дорожного движения
 Средства индивидуальной защиты (СИЗ)
 Гидрологиялық қауіпті құбылыстар
 Two ways of life
 Правила дорожного движения. Движение велосипедов и мопедов
 Пожарная безопасность
 Польза и вред мобильного телефона
 Разработка 7 уроков по теме Автономное существование 6 класс
 Честь и достоинство военнослужащего Вооружённых Сил Российской Федерации
 Пожар и его развитие, прекращение горения на пожаре
 Наубайханалық ашытқы. Ашытқы клеткаларын өсіру жағдайы мен құрылысы
 Тесты для проверки знаний учащихся
 Поисково-спасательный отряд
 Пособие по ПДД
 Обеспечение защиты населения от последствий аварий на взрывопожароопасных объектах
 Что делать если провалился под лёд?
 Энергетики - польза или вред
 Окружающая среда и безопасность
 ПЕРВАЯ ДОВРАЧЕБНАЯ ПОМОЩЬ ПРИ ДТП
 Всероссийский проект-конкурс Лига юных пожарных. Пожарный биатлон
 Причина многих бед - алкоголь
 Правила поведения на природе летом
 Чрезвычайные ситуации техногенного характера
 Техника безопасности и правила поведения на уроках Технология. 5 класс
 Действия работников организации при угрозе террористического акта на территории организации и в случае его совершения