- Monitoring of air temperature, humidity, and CO2 concentration

Содержание
- 2. Monitoring excercise; instructions Aim: To learn to design, perform, and report a monitoring activity Physical quantities
- 3. Optional We will study air flow rates and CO2 concentarions later in this course You could
- 4. Example of monitoring in an office room * Think what kind of variation you could expect
- 5. Memory capacity of the EBI 20 data loggers 8000 measured data (temperature and humidity takes two)
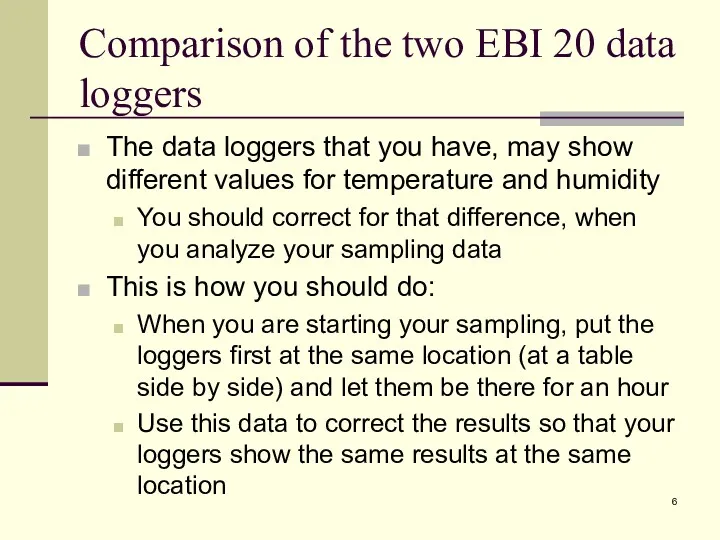
- 6. Comparison of the two EBI 20 data loggers The data loggers that you have, may show
- 7. Grant squirrel multichannel data logger Each sensor has a long cabel Suggestions for measuring activities: Do
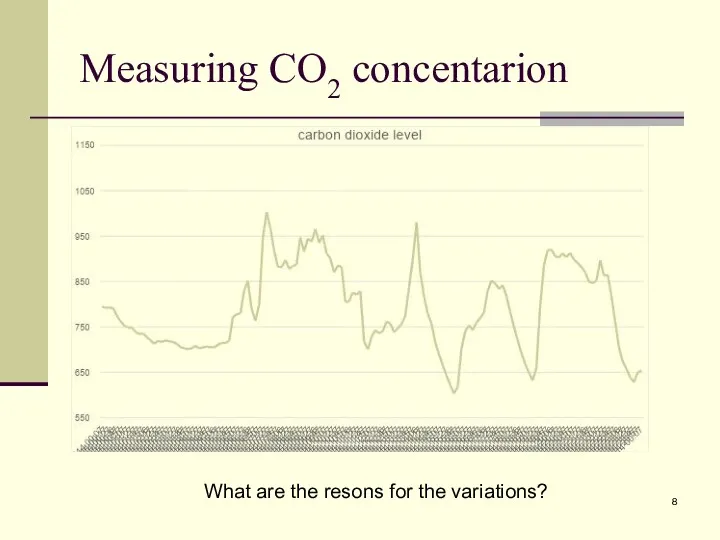
- 8. Measuring CO2 concentarion What are the resons for the variations?
- 9. Selecting the topics and reserving the instruments Tuesday 7th of February: Each group tells, what and
- 10. Oral presentations Presentations should be in a PowerPoint file Oral presentations are held on Tuesday the
- 11. Suggestions for monitoring Residence, indoor and outdoor conditions Residence, conditions in different rooms Residence, conditions at
- 13. Скачать презентацию
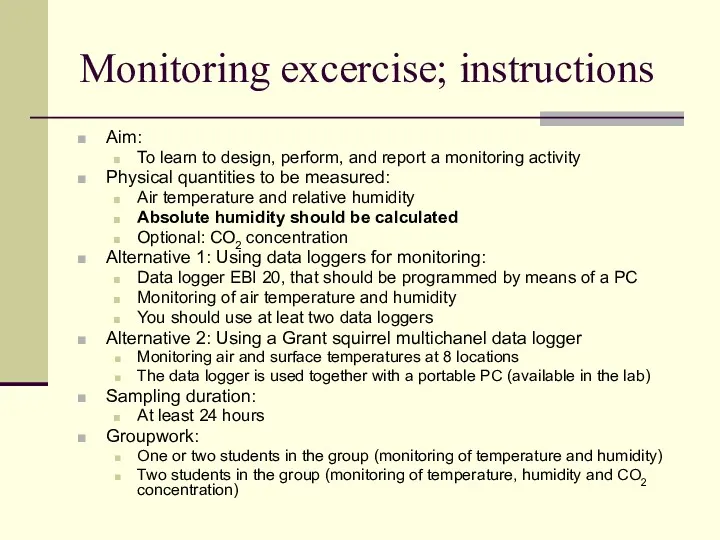
Monitoring excercise; instructions
Aim:
To learn to design, perform, and report a monitoring
Monitoring excercise; instructions
Aim:
To learn to design, perform, and report a monitoring
Optional
We will study air flow rates and CO2 concentarions later in
Optional
We will study air flow rates and CO2 concentarions later in
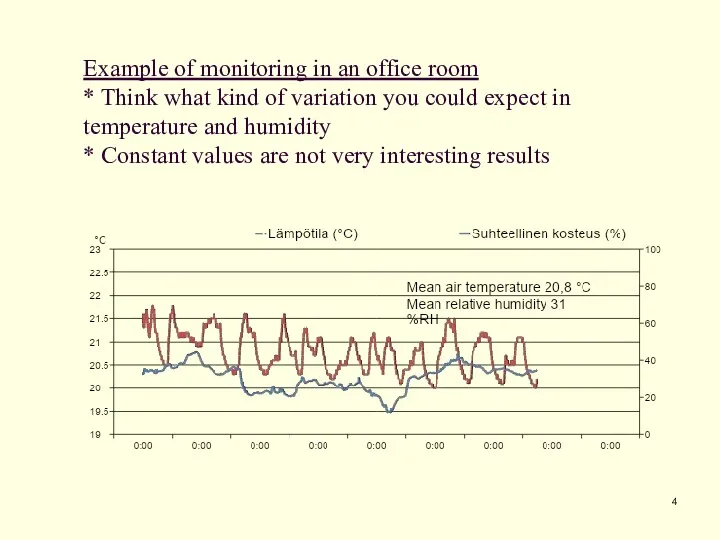
Example of monitoring in an office room
* Think what kind of
Example of monitoring in an office room * Think what kind of
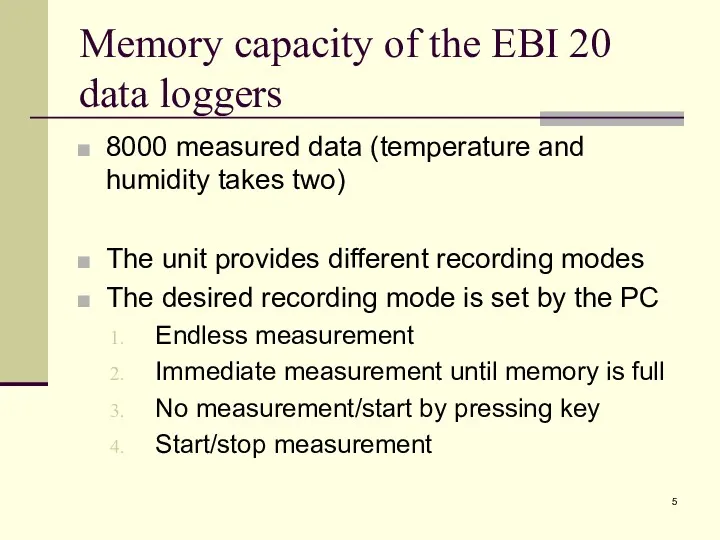
Memory capacity of the EBI 20 data loggers
8000 measured data (temperature
Memory capacity of the EBI 20 data loggers
8000 measured data (temperature
Comparison of the two EBI 20 data loggers
The data loggers that
Comparison of the two EBI 20 data loggers
The data loggers that
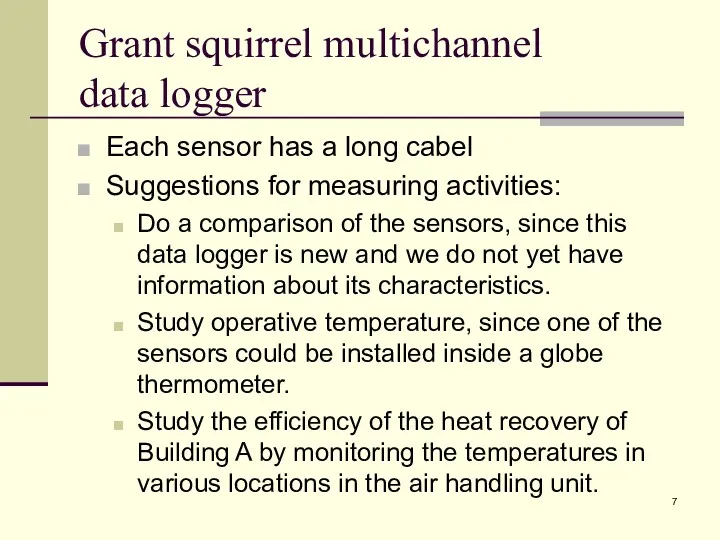
Grant squirrel multichannel
data logger
Each sensor has a long cabel
Suggestions for
Grant squirrel multichannel
data logger
Each sensor has a long cabel
Suggestions for
Measuring CO2 concentarion
What are the resons for the variations?
Measuring CO2 concentarion
What are the resons for the variations?

Selecting the topics and reserving the instruments
Tuesday 7th of February:
Each group
Selecting the topics and reserving the instruments
Tuesday 7th of February:
Each group
Oral presentations
Presentations should be in a PowerPoint file
Oral presentations are held
Oral presentations
Presentations should be in a PowerPoint file
Oral presentations are held
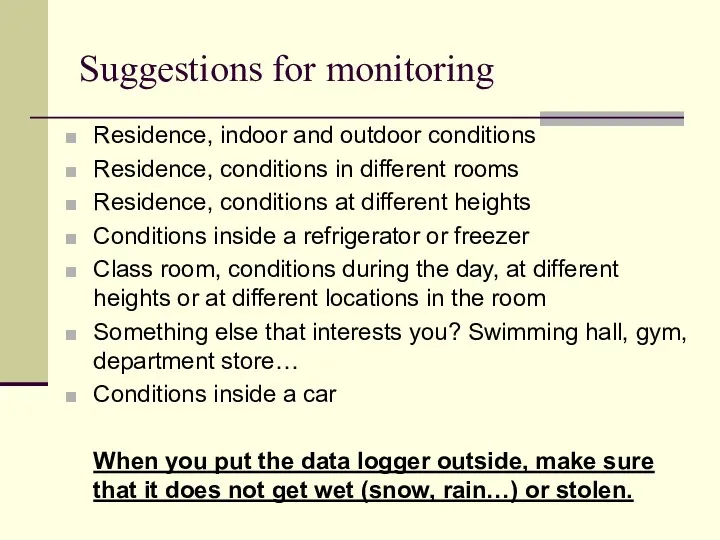
Suggestions for monitoring
Residence, indoor and outdoor conditions
Residence, conditions in different rooms
Residence,
Suggestions for monitoring
Residence, indoor and outdoor conditions
Residence, conditions in different rooms
Residence,
 Безопасность в доме
 Чтобы выжить игра для учащихся по теме: Безопасность и защита человека в опасных и чрезвычайных ситуациях
 Правило посадки за партой
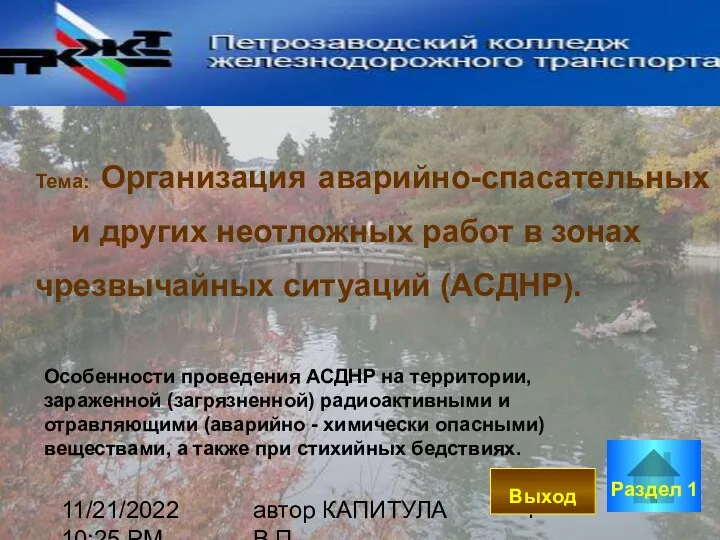 Организация аварийно-спасательных и других неотложных работ в зонах чрезвычайных ситуаций (АСДНР)
 Здоровое питание
 Влияние алкоголя на организм человека
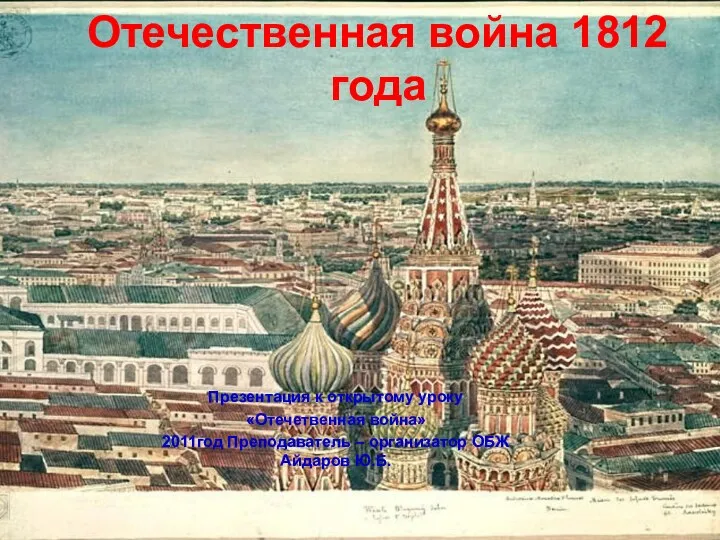 Отечественная война 1812 года
 Условия труда. Термины. Классификация. Оценка
 Проведение Единого дня ПДД в рамках профилактической акции Внимание – дети!
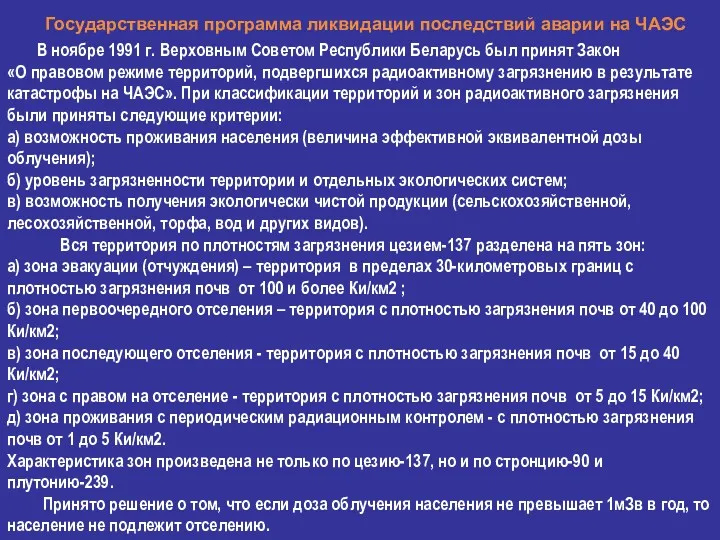 Лекция №9 РБ. Государственная программа ликвидации последствий аварии на ЧАЭС
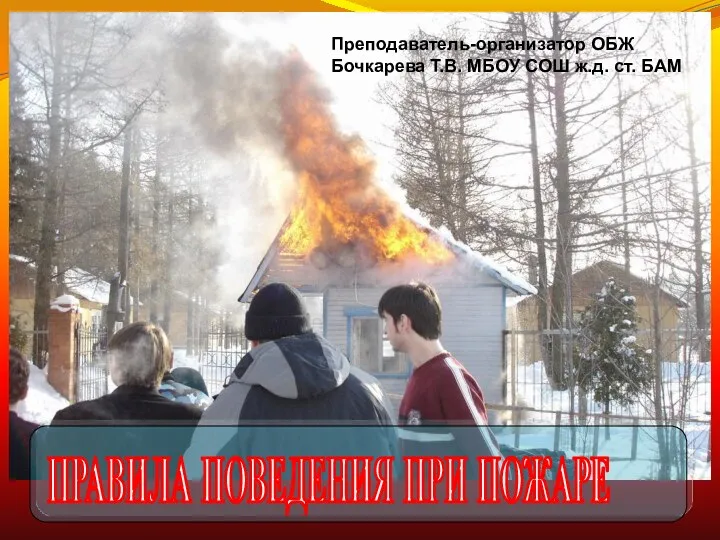 Правила поведения при пожаре
 Показатели безопасности. Статус-отчет ООО Точмаш-авто
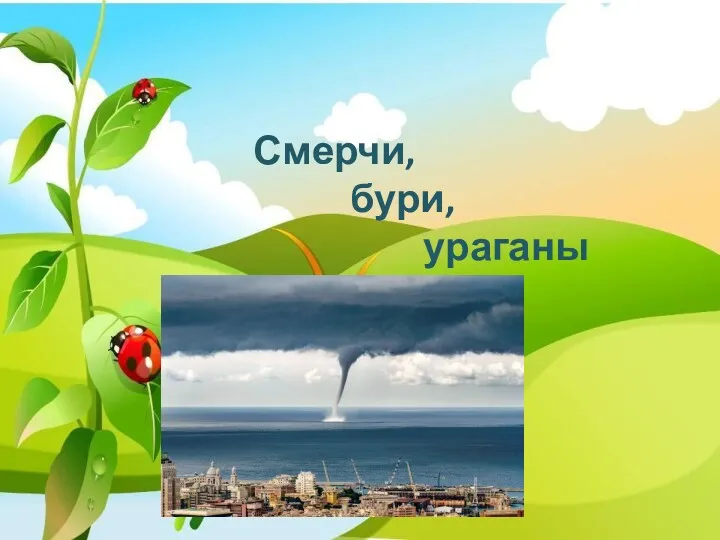 Смерчи, бури, ураганы
 Профилактика травматизма дошкольников на занятиях по физической культуре
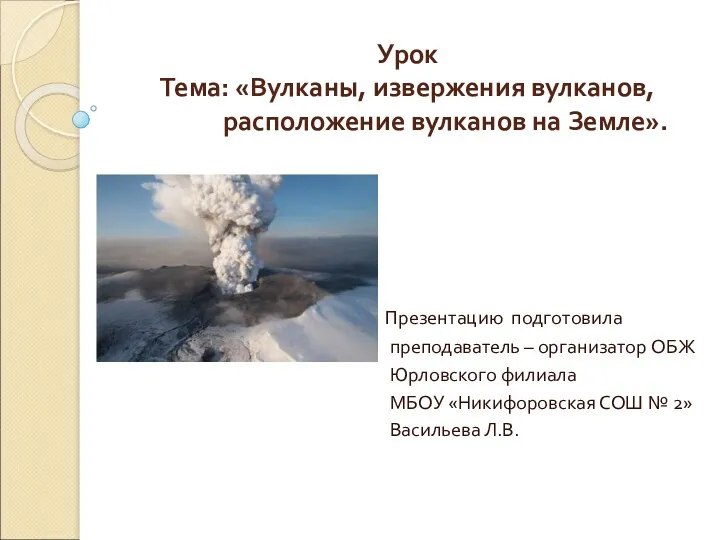 Разработка урока ОБЖ для 7 класса Вулканы, извержения вулканов, расположение вулканов на Земле
 Обеспечение безопасности производства
 Первая помощь при попадании инородных тел в верхние дыхательные пути
 Рекомендации родителям по укреплению здоровья детей
 Пожарная безопасность объектов транспорта (СТО, автосервис)
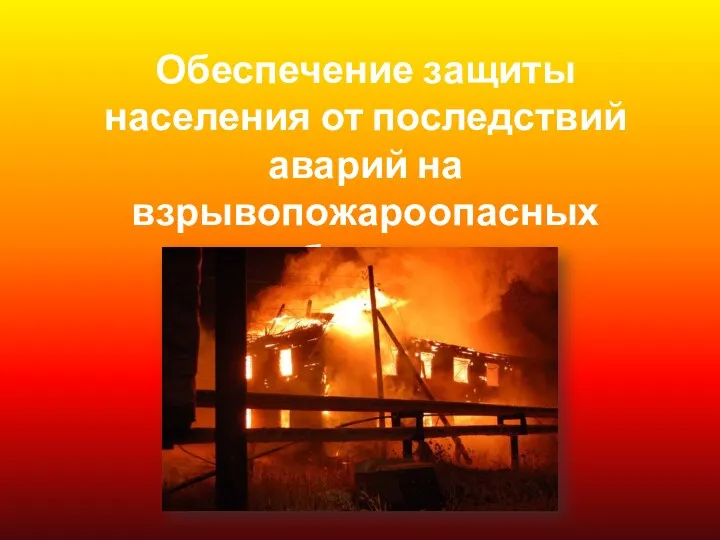 Обеспечение защиты населения от последствий аварий на взрывопожароопасных объектах
 Лазерное излучение
 Техніка безпеки при роботі з комп’ютером
 Характеристика радиационноопасных объектов
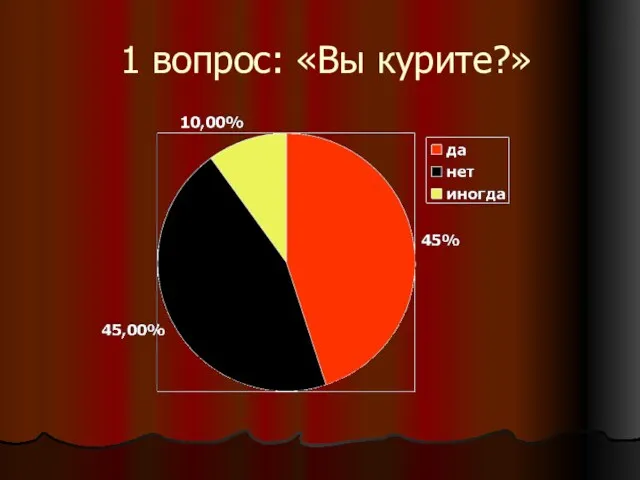 Дань сигарете - здоровье на ветер
 Курсы гражданской обороны городского округа Серпухов
 Образ жизни и здоровье
 История допинга
 Первая помощь при утоплении