- Armenian Energy Sector Overview and Development Outlook

Содержание
- 2. Armenia: Country Overview
- 3. Armenia: Regional Location
- 4. Territory – 29.8 thousand km2 ~40 % – 2 500 m above the sea level Population
- 5. Main macroeconomic indicators (2015 / 2014) GDP, million $ 10 530/ 10 893 GDP per capita,
- 6. Armenia: Energy System Overview
- 7. Main TPES Indicators (as of 31.12.2015) 1000 ktoe 1 toe = 11.63 megawatt-hour (MWh) mln kWh
- 8. Tons of oil equivalent 1 toe = 41.868 Gigajoules = 11.63 MWh 1 toe = 1.429
- 9. RA gasification level ~95% Length of the pipelines 16 088 km Number of gasified communities 611
- 10. Natural Gas Supply System: Main Indicators (as of 31.12.2015) Gas consumption per sector
- 11. Natural Gas Supply System: Main Pipelines
- 12. Customers Gas Supply Tariffs: (effective from 1st of July, 2016) 1 $ = 478 AMD (average
- 13. Installed / available capacities (MW) Total installed/available capacity 3 152/2695 Armenian NPP (VVER-440) 440 / 385
- 14. 7 798 – annual production 365 (4.7%) – power plants own use (self-consumption) 816 (11.0%) –
- 15. Shares of electricity production (total) Armenian Power System: Main Indicators (as of 31.12.2015)
- 16. Shares of electricity production (domestic) Armenian Power System: Main Indicators (as of 31.12.2014)
- 17. Armenian Power System: Main Indicators (as of 31.12.2015)
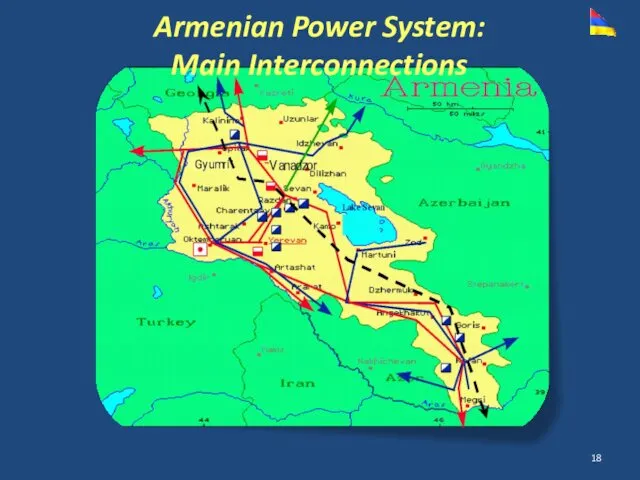
- 18. Armenian Power System: Main Interconnections
- 19. Customers Electricity Tariffs: (effective from 1st of August, 2016) 1 $ = 478 AMD (average for
- 20. Electricity Generation Tariffs: Main Power Plants (without VAT – 20%, effective from 1st of August, 2016)
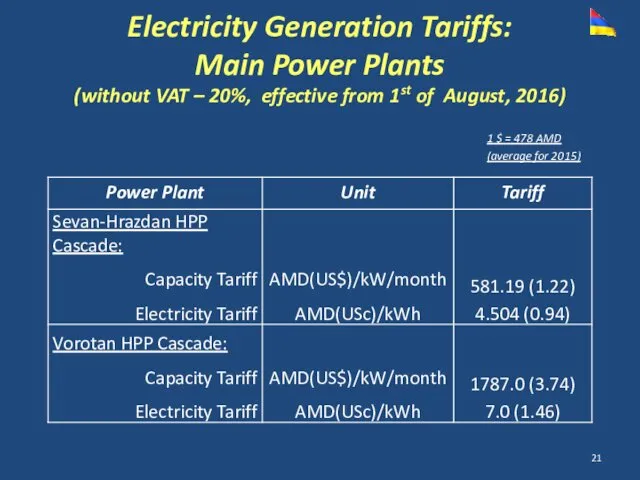
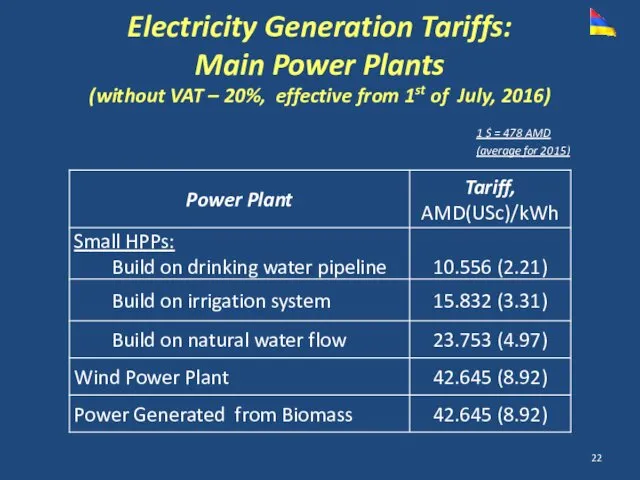
- 21. 1 $ = 478 AMD (average for 2015) Electricity Generation Tariffs: Main Power Plants (without VAT
- 22. 1 $ = 478 AMD (average for 2015) Electricity Generation Tariffs: Main Power Plants (without VAT
- 23. HOMEWORK Which is the percentage of the reject heat (energy loss) in Armenian electric power generation
- 25. Скачать презентацию
Armenia:
Country Overview
Armenia:
Country Overview
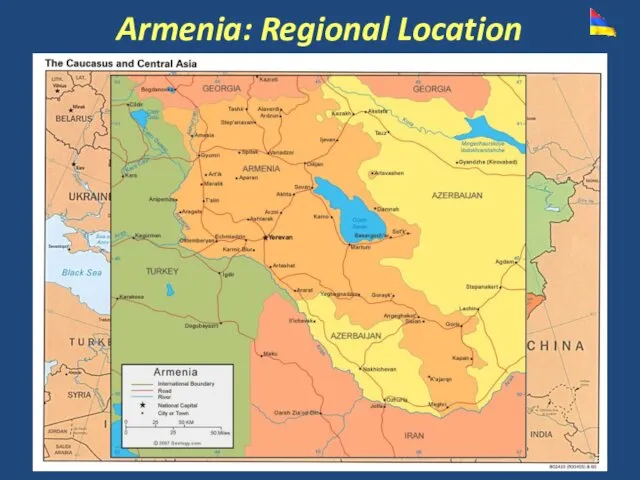
Armenia: Regional Location
Armenia: Regional Location
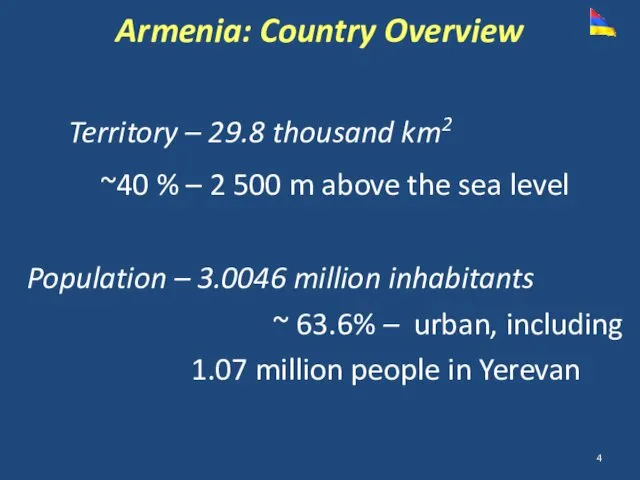
Territory – 29.8 thousand km2
~40 % – 2 500 m above
Territory – 29.8 thousand km2
~40 % – 2 500 m above
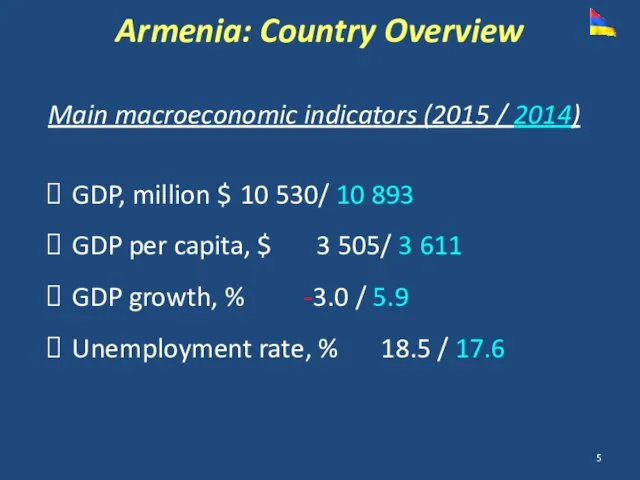
Main macroeconomic indicators (2015 / 2014)
GDP, million $ 10 530/ 10
Main macroeconomic indicators (2015 / 2014)
GDP, million $ 10 530/ 10
Armenia:
Energy System Overview
Armenia:
Energy System Overview
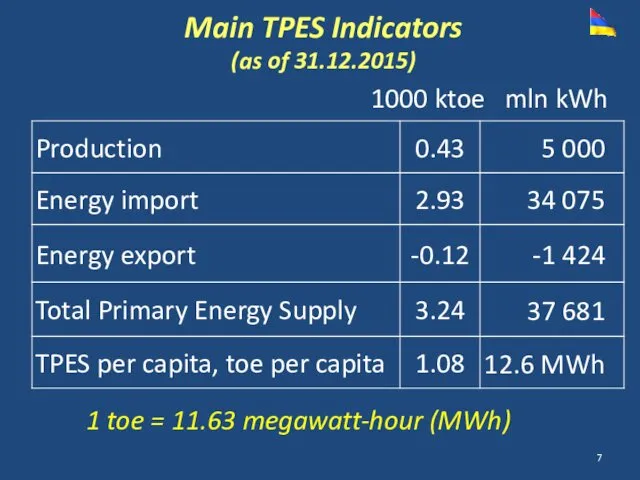
Main TPES Indicators
(as of 31.12.2015)
1000 ktoe
1 toe = 11.63 megawatt-hour (MWh)
mln
Main TPES Indicators
(as of 31.12.2015)
1000 ktoe
1 toe = 11.63 megawatt-hour (MWh)
mln
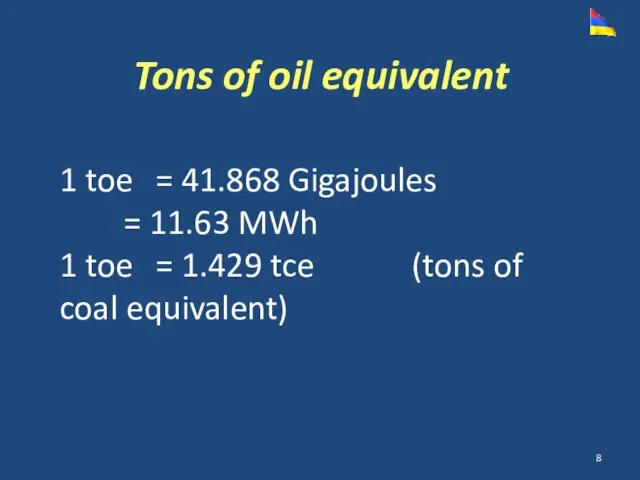
Tons of oil equivalent
1 toe = 41.868 Gigajoules
= 11.63 MWh
1
Tons of oil equivalent
1 toe = 41.868 Gigajoules
= 11.63 MWh
1
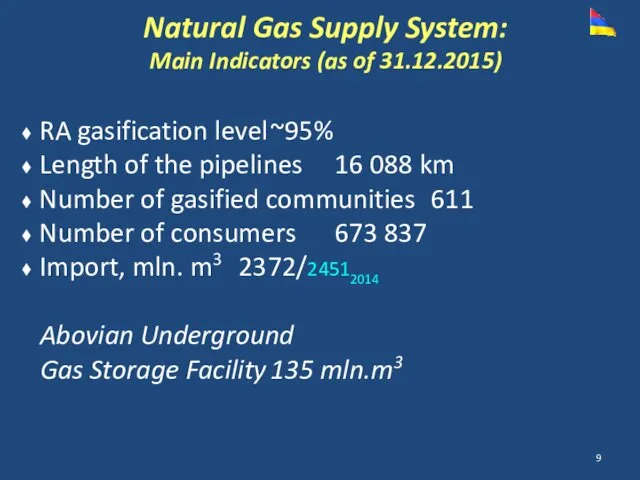
RA gasification level ~95%
Length of the pipelines 16 088 km
Number of gasified communities 611
Number
RA gasification level ~95%
Length of the pipelines 16 088 km
Number of gasified communities 611
Number
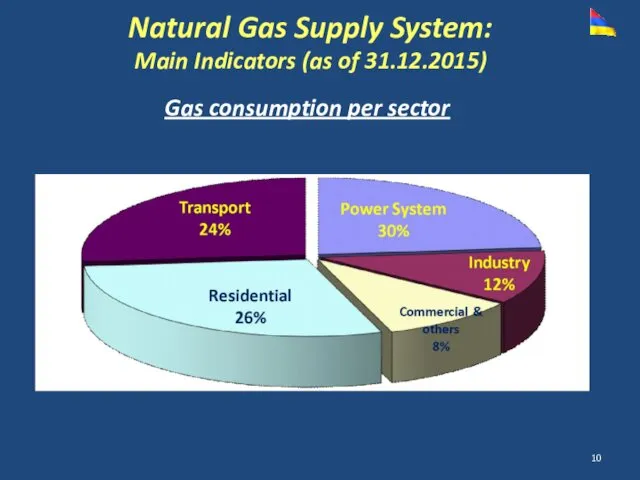
Natural Gas Supply System:
Main Indicators (as of 31.12.2015)
Gas consumption per
Natural Gas Supply System:
Main Indicators (as of 31.12.2015)
Gas consumption per
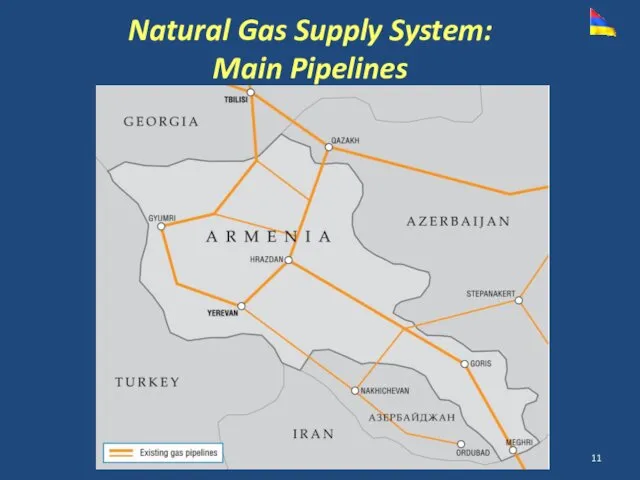
Natural Gas Supply System:
Main Pipelines
Natural Gas Supply System:
Main Pipelines
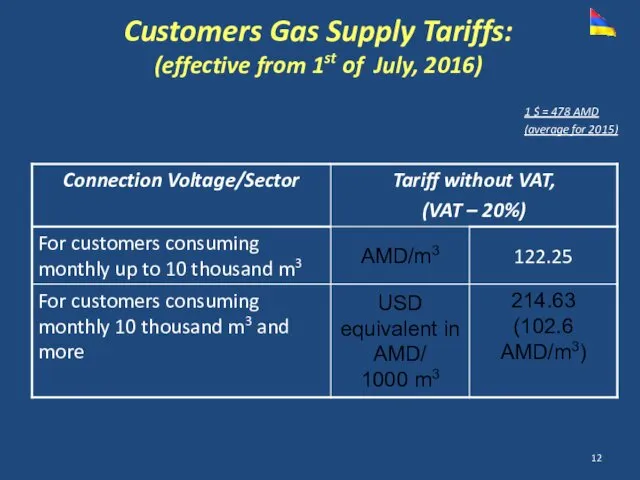
Customers Gas Supply Tariffs:
(effective from 1st of July, 2016)
1 $ =
Customers Gas Supply Tariffs:
(effective from 1st of July, 2016)
1 $ =
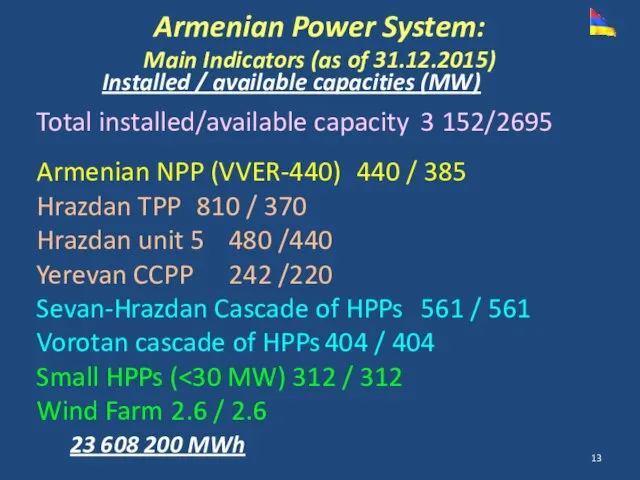
Installed / available capacities (MW)
Total installed/available capacity 3 152/2695
Armenian NPP (VVER-440) 440 /
Installed / available capacities (MW)
Total installed/available capacity 3 152/2695
Armenian NPP (VVER-440) 440 /
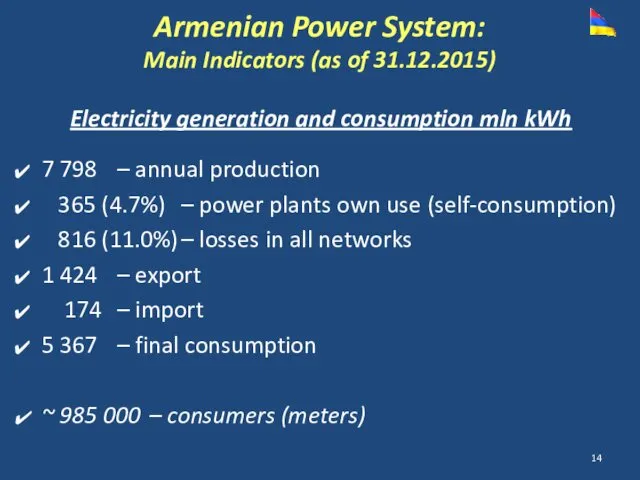
7 798 – annual production
365 (4.7%) – power plants own use (self-consumption)
7 798 – annual production
365 (4.7%) – power plants own use (self-consumption)
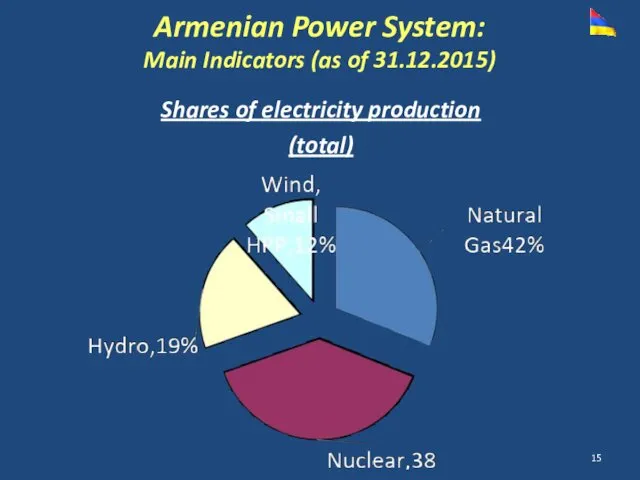
Shares of electricity production
(total)
Armenian Power System:
Main Indicators (as of 31.12.2015)
Shares of electricity production
(total)
Armenian Power System:
Main Indicators (as of 31.12.2015)
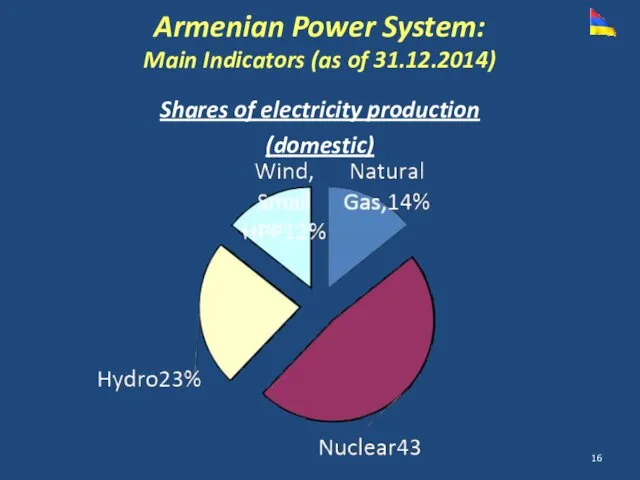
Shares of electricity production
(domestic)
Armenian Power System:
Main Indicators (as of 31.12.2014)
Shares of electricity production
(domestic)
Armenian Power System:
Main Indicators (as of 31.12.2014)
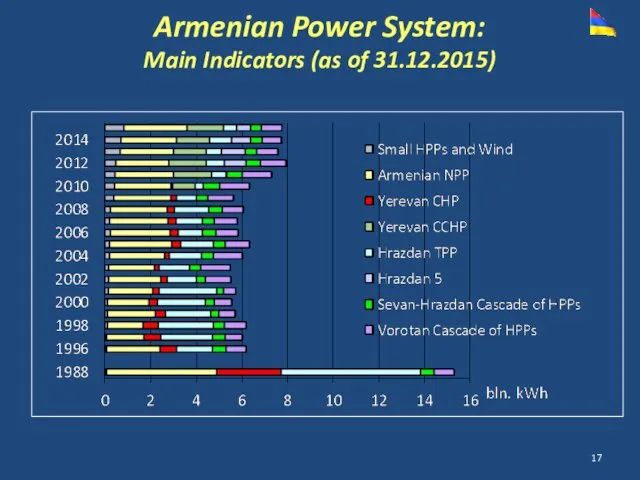
Armenian Power System:
Main Indicators (as of 31.12.2015)
Armenian Power System:
Main Indicators (as of 31.12.2015)
Armenian Power System:
Main Interconnections
Armenian Power System:
Main Interconnections
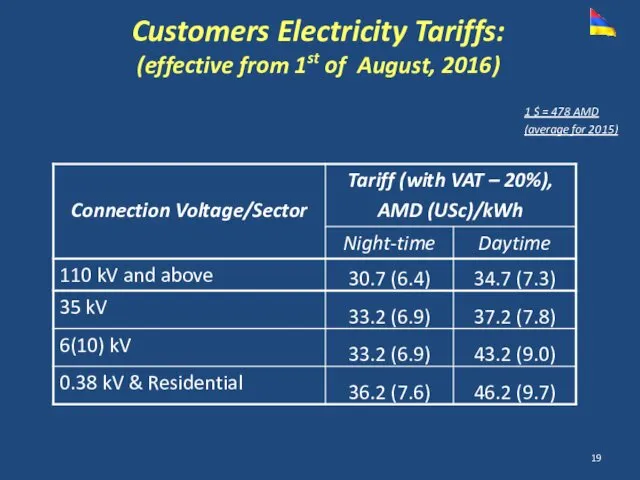
Customers Electricity Tariffs:
(effective from 1st of August, 2016)
1 $ = 478
Customers Electricity Tariffs:
(effective from 1st of August, 2016)
1 $ = 478
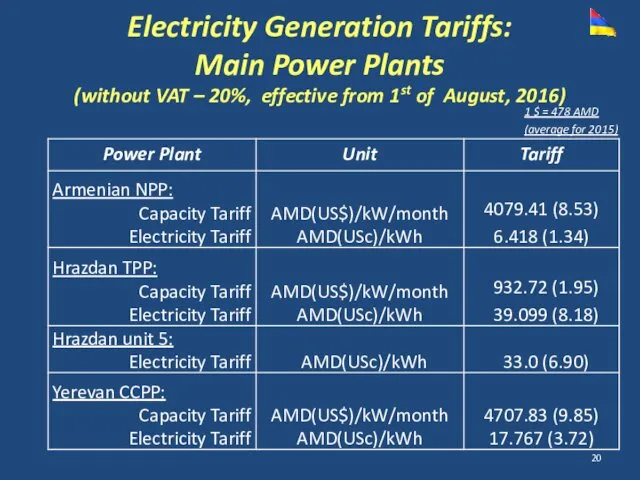
Electricity Generation Tariffs:
Main Power Plants
(without VAT – 20%, effective from 1st
Electricity Generation Tariffs: Main Power Plants (without VAT – 20%, effective from 1st
1 $ = 478 AMD
(average for 2015)
Electricity Generation Tariffs:
Main Power
1 $ = 478 AMD
(average for 2015)
Electricity Generation Tariffs: Main Power
1 $ = 478 AMD
(average for 2015)
Electricity Generation Tariffs:
Main Power
1 $ = 478 AMD
(average for 2015)
Electricity Generation Tariffs: Main Power
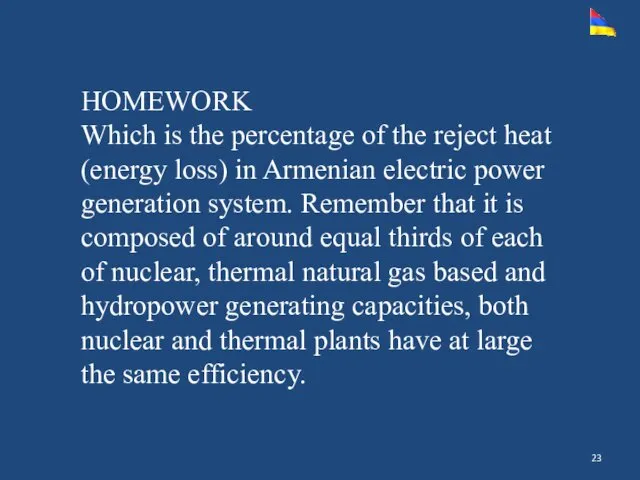
HOMEWORK
Which is the percentage of the reject heat (energy loss) in
HOMEWORK
Which is the percentage of the reject heat (energy loss) in
 классный час посвящённый здоровому образу жизни 1 класс
 Пора к неврологу
 О проведении Всероссийской олимпиады школьников по вопросам избирательного права и избирательного процесса
 ДЕНЬ НАРОДНОГО ЕДИНСТВА
 Физминутка Зарядка
 Экономика: наука и хозяйство
 Презентация1
 Круговая интерполяция. Программирование сдвига нулевой точки. Программирование подачи и скорости главного движения
 Работа телеметриста
 Презентация Своя игра
 Язык программирования Pascal. Повторение (циклы)
 использование интерактивных форм обучения для развития позновательной деятельности учащихся.
 Организация обслуживания ресторана высшего класса на 120 мест
 Географический диктант по теме Население Европы
 Презентация Весна. Цветы. Улыбки. 8 Марта…
 Источники Земельного права
 Презентация Веселый обруч
 Рак шейки и тела матки
 Болезни органов дыхания
 Состав, порядок разработки, согласования и утверждения проектно-сметной документации
 Военно - промышленный комплекс (ВПК)
 Базовые концепции финансового менеджмента
 Мал сою технологиясы мен гигиенасы
 Стационарные антенны
 Терроризм - угроза обществу
 СМИ Норвегии, Швеции и Дании о выборах 2018 в России
 Культура України 1960-х – 1980-х років ХХ ст
 ИНДИВИДУАЛЬНОЕ ЗАНЯТИЕ КЛАСС ГУО ТЕМА: ЗВУК [ Л ] ЭТАП : Постановка звука ( л)