- Другие методы исследования структуры белков

Содержание
- 2. Small-angle X-ray scattering (SAXS) + Small-angle neutron scattering (SANS) II Small-angle scattering (SAS)
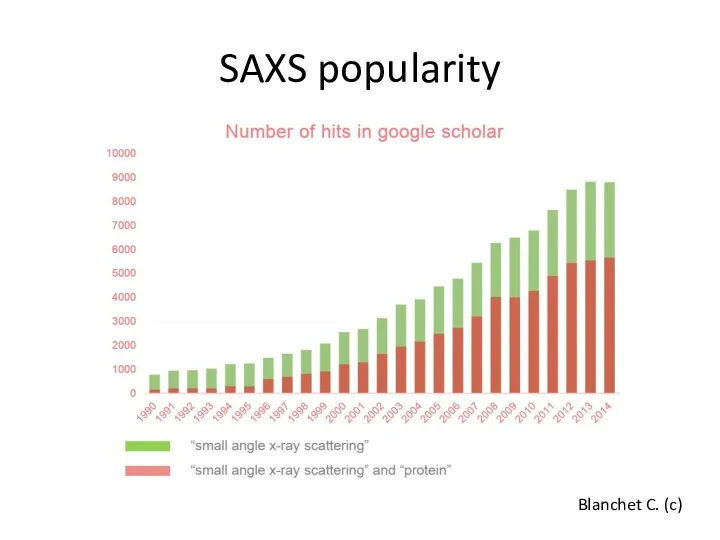
- 3. SAXS popularity Blanchet C. (c)
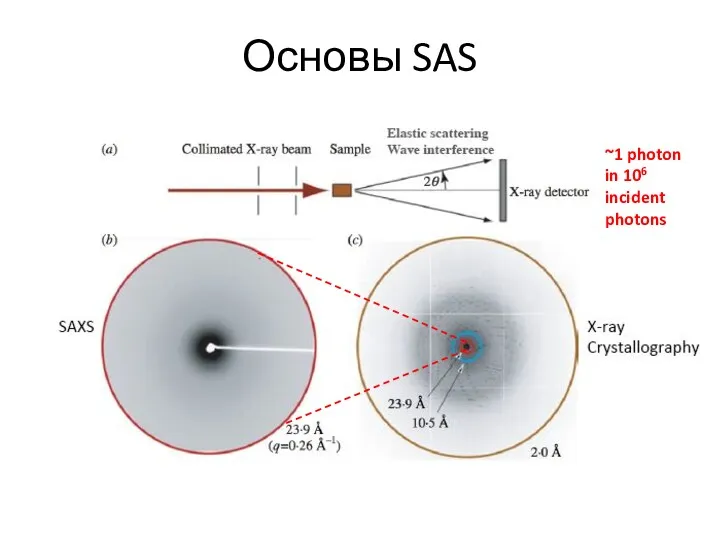
- 4. Основы SAS ~1 photon in 106 incident photons
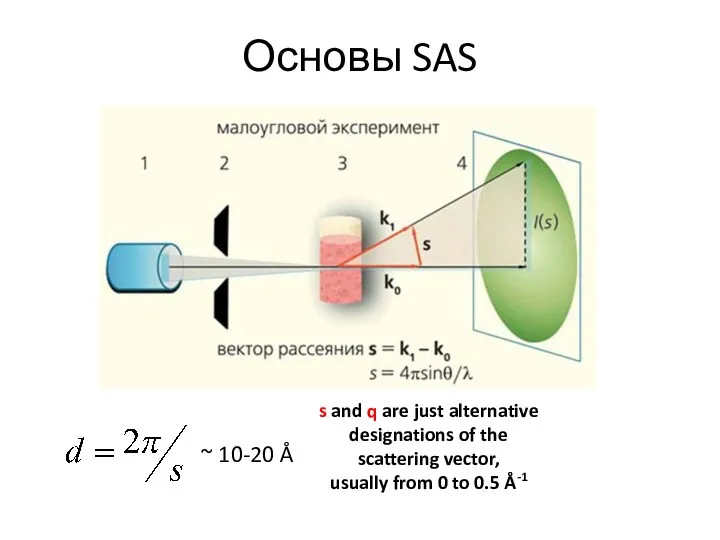
- 5. Основы SAS s and q are just alternative designations of the scattering vector, usually from 0
- 6. Contrast and careful buffer subtraction Measured in the same cell, buffer exactly matches Difference in the
- 7. Kikhney A (c) Processed final curve !
- 8. Особенности Макромолекулы свободно вращаются, не ориентированы строго при падающем пучке X-ray Может быть несколько конформаций одновременно
- 10. https://www.embl-hamburg.de/biosaxs/software.html
- 11. Форма кривой SAXS сильно зависит от размера и формы частиц
- 12. What does the curve already tell us about the size of the particles? What is the
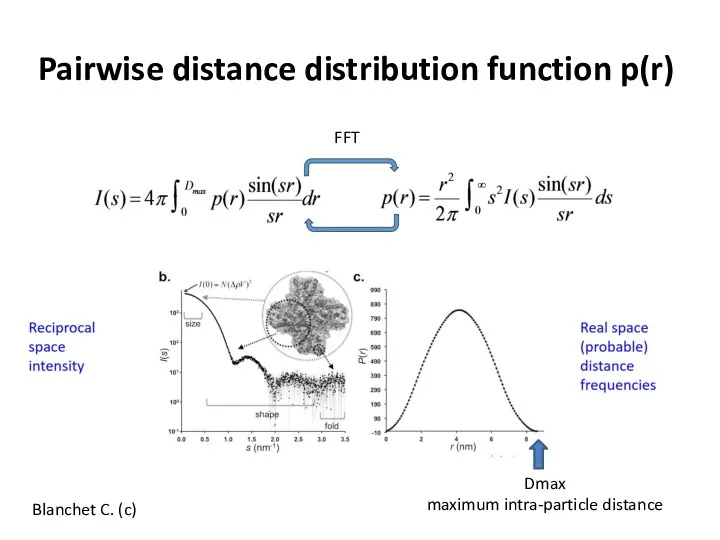
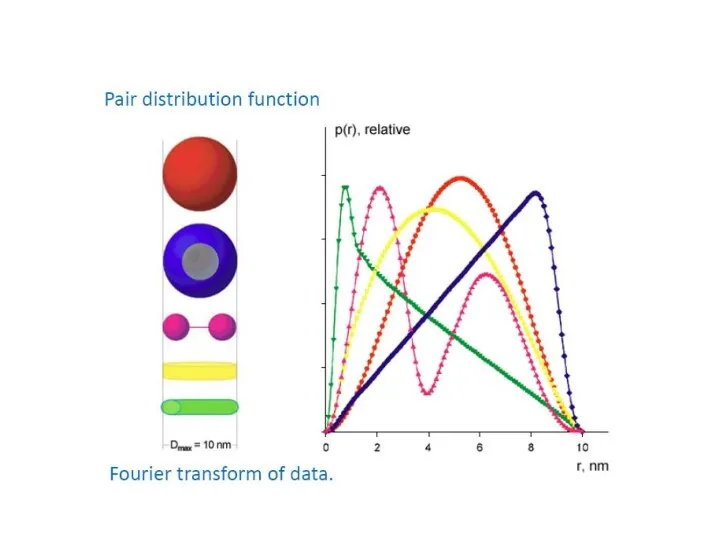
- 13. Pairwise distance distribution function p(r) Blanchet C. (c) FFT
- 14. Pairwise distance distribution function p(r) Blanchet C. (c) FFT Dmax maximum intra-particle distance
- 16. Kikhney A (c) DAMMIF program https://www.embl-hamburg.de/biosaxs/dammif.html
- 20. Linear ≠ monodisperse (also for mixed systems)
- 21. Guinier plot and Rg Average of square center-of-mass distances in the molecule Measure of the overall
- 22. Kratky plot and flexibility Identification of unfolded samples Globular proteins have bell-shaped curves (parabola)
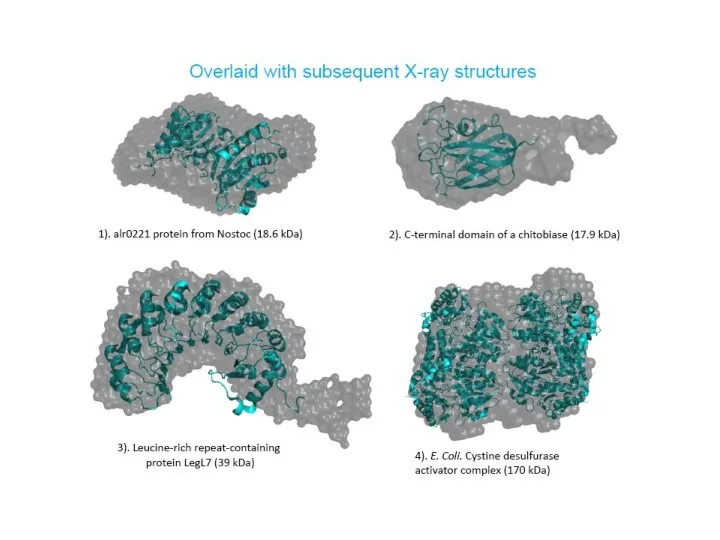
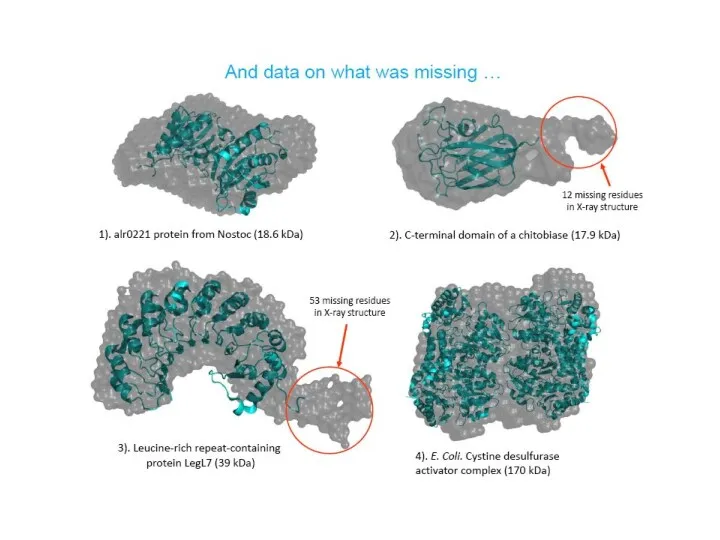
- 23. If X-ray structures are available… Atomistic modeling: Validation of the crystal structure against solution situation Rigid-body
- 24. Validation of the crystal structure in solution situation 1.75A
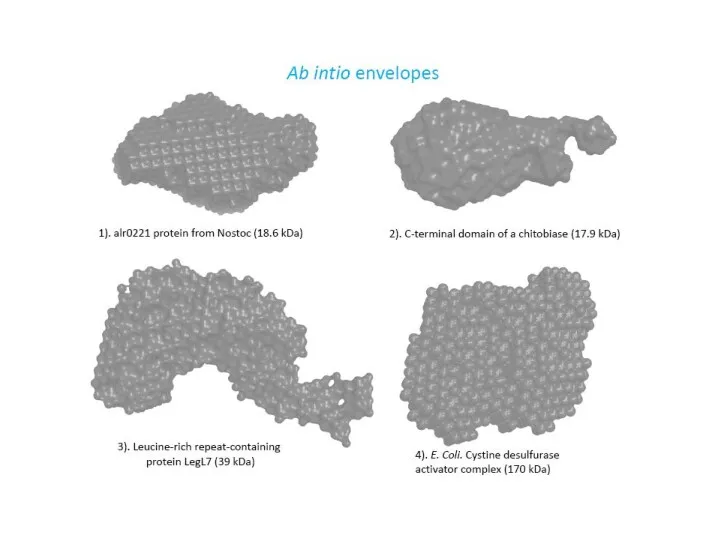
- 25. Comparison of the crystal structures and ab initio envelopes
- 26. Conformational change
- 27. Conformational change FRP dimer
- 28. SEC-SAXS for contaminated samples M. Graewert (c)
- 29. SASBDB https://www.sasbdb.org/aboutSASBDB/
- 30. Трезвый взгляд на SAXS Дает хорошую информацию о гидродинамических свойствах частиц (структурных свойствах) в растворе Хорош
- 31. SANS Neutron source (rare) Non-ionizing radiation Coherent scattering (=elastic) Incoherent scattering (1H affects) Contrast is very
- 32. Samples for SAXS and SANS
- 33. CryoEM https://www.nature.com/news/the-revolution-will-not-be-crystallized-a-new-method-sweeps-through-structural-biology-1.18335 https://www.youtube.com/watch?v=aHhmnxD6RCI
- 34. Resolution revolution появление прямых детекторов электронов развитие софта для обработки огромного количества картинок совершенствование микроскопов, адаптация
- 35. The recipe includes https://www.youtube.com/watch?v=BJKkC0W-6Qk
- 36. The process of Cryo-EM single particle analysis technique by cross-correlation
- 37. Features, 2D->3D Biological samples – low doses and dehydration (high vacuum) Freezing allows to avoid these,
- 38. Contrast transfer function and defocus At perfect focus, biological specimens produce little contrast in vitreous ice.
- 39. Contrast transfer function and defocus At perfect focus, biological specimens produce little contrast in vitreous ice.
- 40. Contrast transfer function and defocus DOI: 10.1142/9781848164666_0001
- 41. Single particle cryoEM requires tons of images Particle orientations are classified by cross-correlation Each class should
- 42. Signal and noise 5:1 1:1 S/N = 1:1 (0 dB) Improving S/N by repetition and averaging
- 43. Einstein from noise An image of Einstein appears from averaged 1000 images of pure white noise
- 44. Обучение криоЭМ https://ru.coursera.org/learn/cryo-em https://em-learning.com https://www.youtube.com/watch?v=Bk5lBvwSe-s Prof. Yifan Cheng
- 46. Cryo-electrotomography (Cryo-ET)
- 47. Cryo-electrotomography (Cryo-ET) https://doi.org/10.1371/journal.pbio.3000050
- 48. NMR – nuclear magnetic resonance https://www.youtube.com/watch?v=0s7Cbl8bZLM https://www.youtube.com/watch?v=eY0NyE0SQjE ☺ NMR made super easy:
- 49. The output of the (successful) multidimensional NMR experiment A set of structural models that satisfy the
- 50. NMR Spin up Or Spin down https://www.youtube.com/watch?v=PmYwYUQw-Rw
- 51. Properties of some nuclei Bonvin A (c)
- 52. NMR sample Bonvin A (c)
- 53. Bonvin A (c) Nuclear spin Частота прецессии (Ларморова частота)
- 54. Energy between α (+1/2) and β (-1/2) levels 1H
- 55. Transitions between levels are possible
- 56. NMR, a spectroscopy technique In a magnetic field magnetic nuclei will resonate with a specific frequency
- 57. Bonvin A (c)
- 58. Magnetization (M) gets back to the B0-oriented position after being affected by external field B0 Exponential
- 59. Chemical shift due to the local environment changing frequency of the nuclei Expressed as part per
- 60. The local electronic environment of the nucleus may change the frequency: shielding effect resonances deshielding shielding
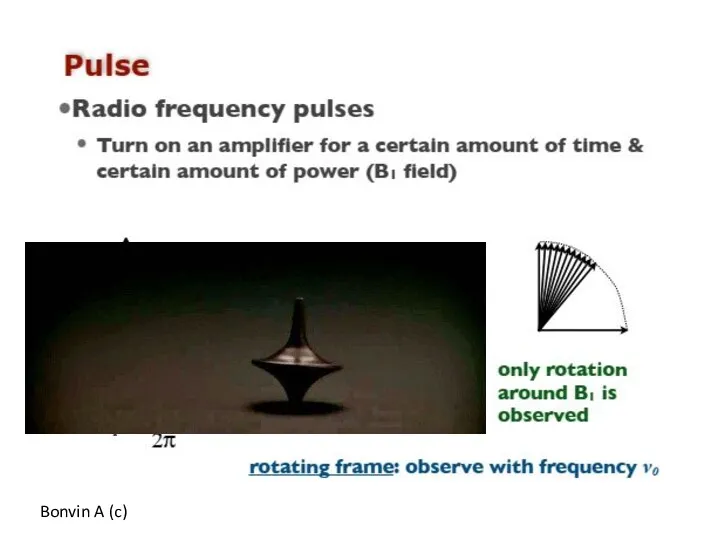
- 61. Pulse method to deliver a set of ν and then do … Good old Fourier !
- 62. 1D 1H-spectrum of ethanol CH3–CH2–OH (CH3)4Si Chemical shift Several peaks due to spin-spin interaction
- 63. 2D spectra Series of pulses to cause transitions 2D Fourier transformation Proximal functional groups affect the
- 64. Спектр 15N-1H HSQC apo-CTDH (0.5 mM), при 800 MHz и 35°С. Отнесены сигналы амидных групп белковой
- 65. Resolution of the peaks is increased upon increasing dimensionality
- 66. Structural models of small proteins Distances between neighboring atoms Angles ψ and φ of the polypeptide
- 67. NMR tackles both structured proteins and IDPs
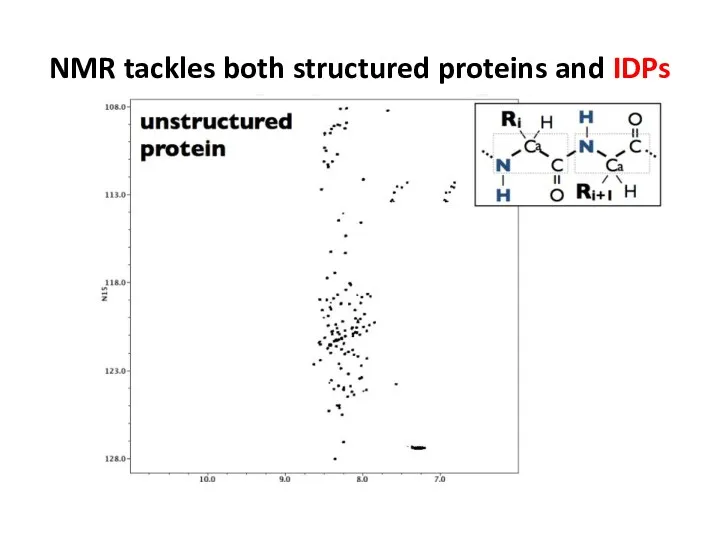
- 68. NMR tackles both structured proteins and IDPs
- 69. i-Tasser. Protein structure prediction FASTA format of sequence https://zhanglab.ccmb.med.umich.edu/I-TASSER/
- 70. Comparison of different structural techniques
- 71. Integrated approaches in structural biology X-ray crystallography SAXS NMR CryoEM Auxillary techniques: fluorescence resonanse energy transfer
- 72. Native-MS https://doi.org/10.3389/fmicb.2018.01397
- 73. Native-MS https://doi.org/10.1007/s13361-018-2061-4 highly charged complexes no additional charges https://www.nature.com/articles/nmeth.1265 https://www.pnas.org/content/116/4/1116 DOI: 10.1007/978-1-4939-7151-0_11
- 74. Hydrogen/deuterium exchange mass-spectrometry Yoshitomo Hamuro © 0°C, H+ https://doi.org/10.1016/j.sbi.2019.06.007 https://onlinelibrary.wiley.com/doi/abs/10.1002/pro.3790 amide protons
- 75. Pseudoatomic models built by a combination of: Single particle Cryo-EM Crosslinking MS HDX MS Modelling
- 76. Cryo-EM micrograph of human alphaA-crystallin 12-mer 16-mer 20-mer
- 77. Cryo-EM 3D reconstructions of human αA-crystallin (reduced) oligomers Scale bar, 10 nm 239 kDa 319 kDa
- 78. Crosslinking by BS3 and MS Fragmentation spectrum of a cross-linked peptide with an intramolecular link between
- 79. Pseudoatomic model of the 16-mer Modelling by molecular dynamics flexible fitting was based on: -shape, symmetry
- 80. Effect of alphaA-crystallin oxidation Far-UV CD Near-UV CD anSEC AUC-SV 14S 25S 50nm 50nm Negative stain
- 82. Скачать презентацию
Small-angle X-ray scattering (SAXS)
+
Small-angle neutron scattering (SANS)
II
Small-angle scattering (SAS)
Small-angle X-ray scattering (SAXS)
+
Small-angle neutron scattering (SANS)
II
Small-angle scattering (SAS)
SAXS popularity
Blanchet C. (c)
SAXS popularity
Blanchet C. (c)
Основы SAS
~1 photon in 106 incident photons
Основы SAS
~1 photon in 106 incident photons
Основы SAS
s and q are just alternative designations of the scattering
Основы SAS
s and q are just alternative designations of the scattering
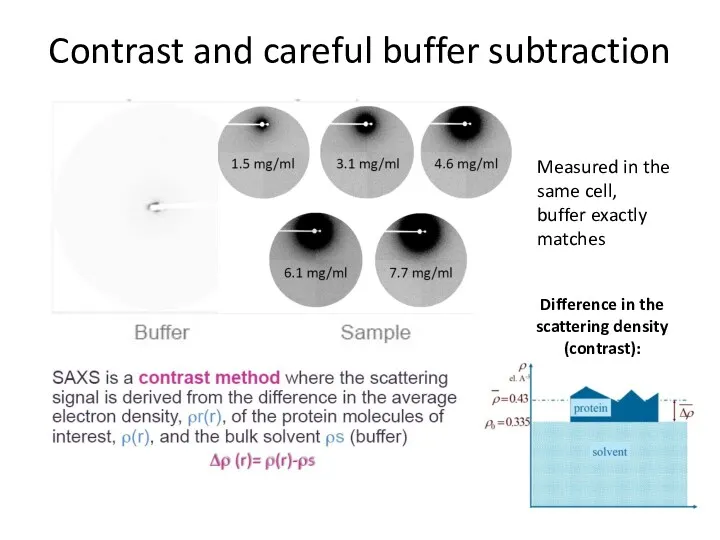
Contrast and careful buffer subtraction
Measured in the same cell, buffer exactly
Contrast and careful buffer subtraction
Measured in the same cell, buffer exactly
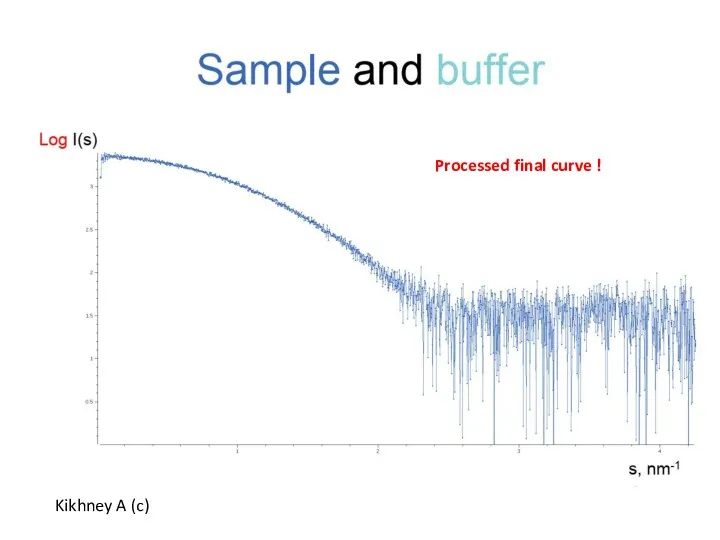
Kikhney A (c)
Processed final curve !
Kikhney A (c)
Processed final curve !
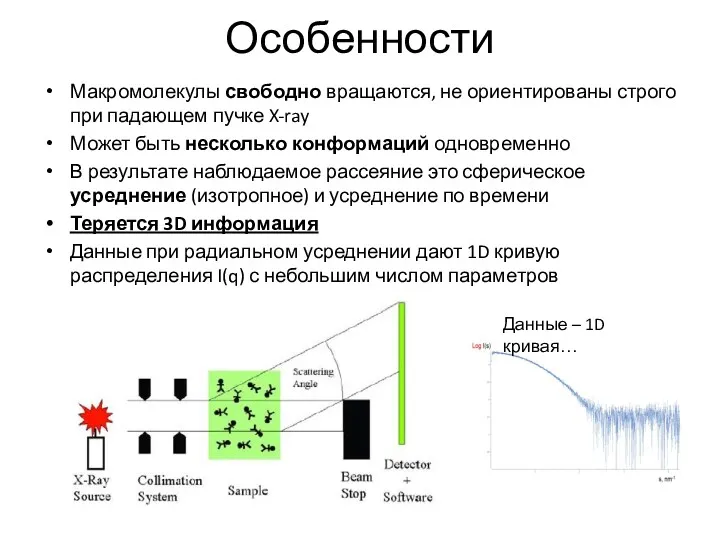
Особенности
Макромолекулы свободно вращаются, не ориентированы строго при падающем пучке X-ray
Может быть
Особенности
Макромолекулы свободно вращаются, не ориентированы строго при падающем пучке X-ray
Может быть
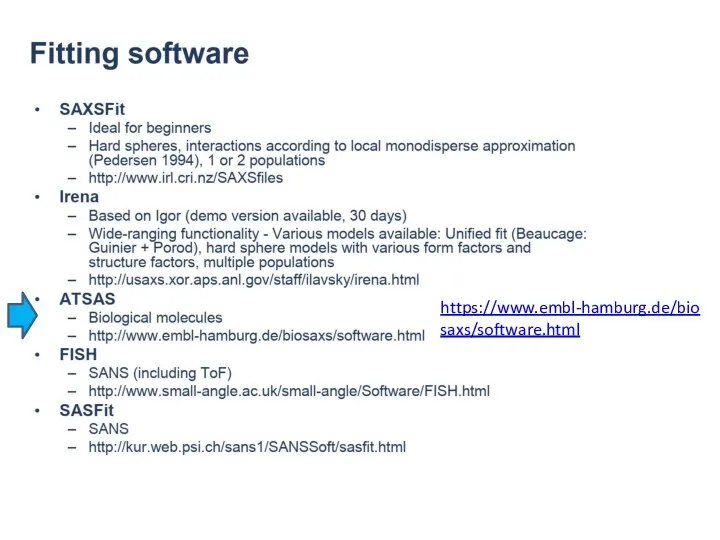
https://www.embl-hamburg.de/biosaxs/software.html
https://www.embl-hamburg.de/biosaxs/software.html
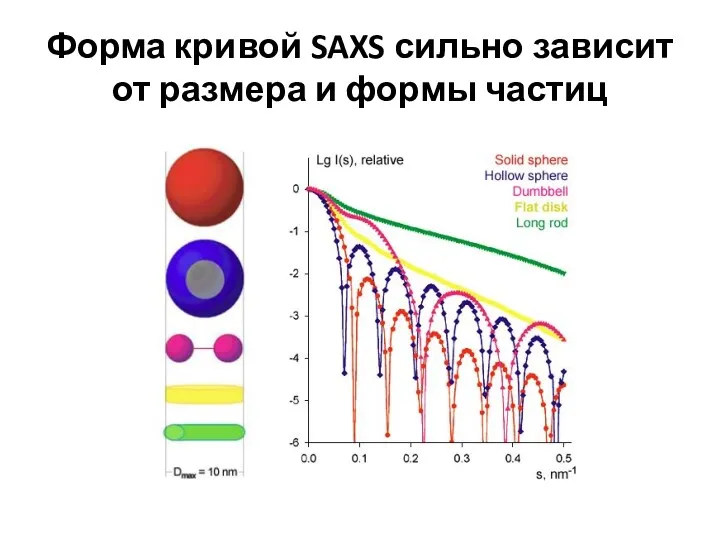
Форма кривой SAXS сильно зависит от размера и формы частиц
Форма кривой SAXS сильно зависит от размера и формы частиц
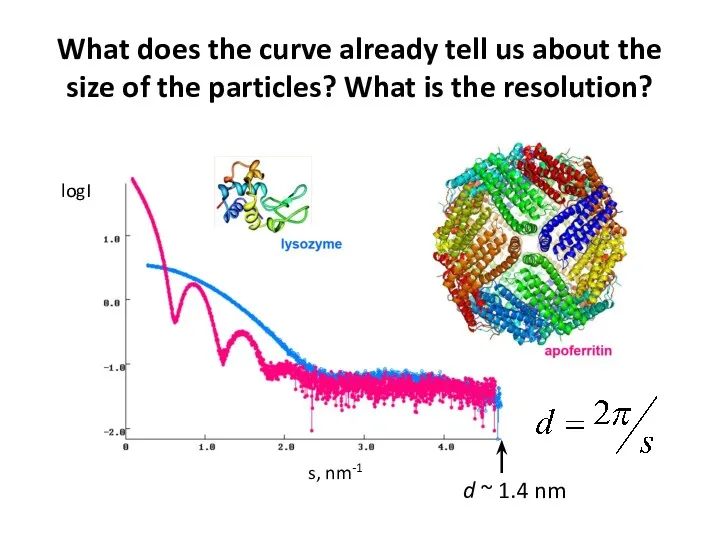
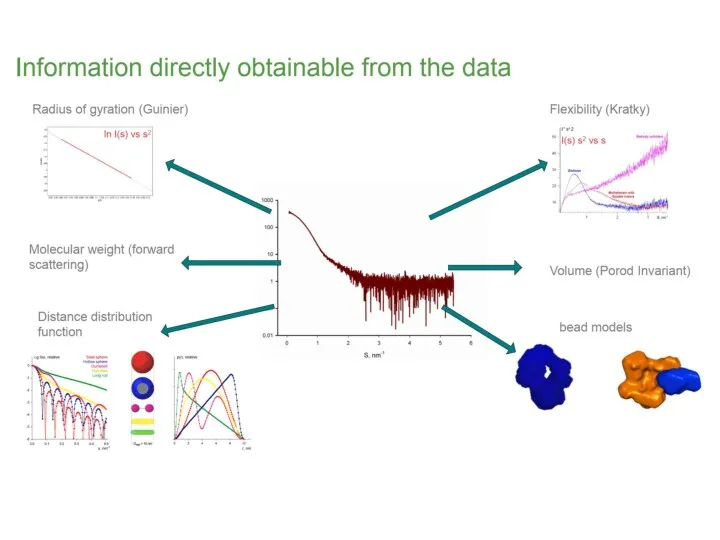
What does the curve already tell us about the size of
What does the curve already tell us about the size of
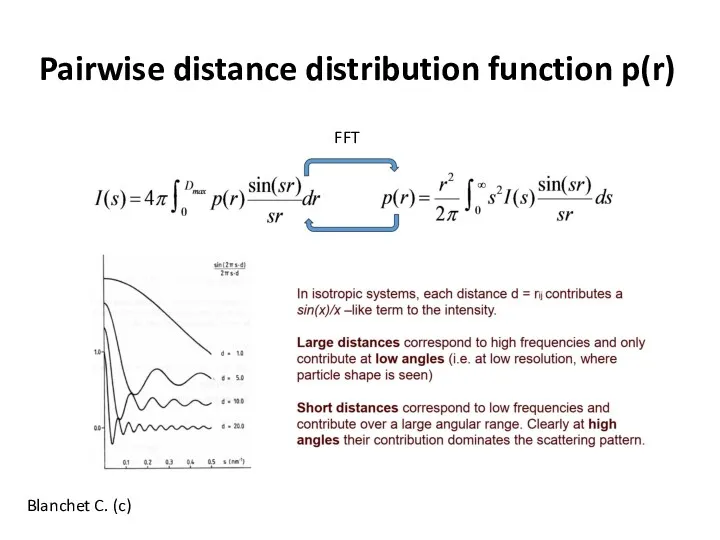
Pairwise distance distribution function p(r)
Blanchet C. (c)
FFT
Pairwise distance distribution function p(r)
Blanchet C. (c)
FFT
Pairwise distance distribution function p(r)
Blanchet C. (c)
FFT
Dmax
maximum intra-particle distance
Pairwise distance distribution function p(r)
Blanchet C. (c)
FFT
Dmax
maximum intra-particle distance
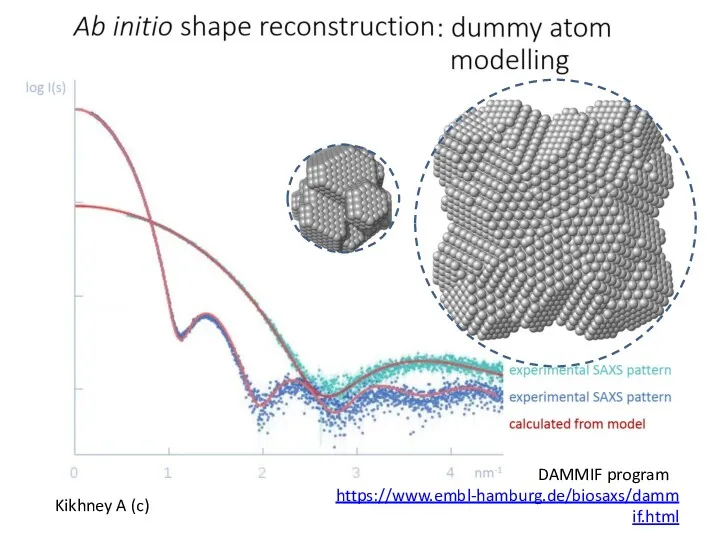
Kikhney A (c)
DAMMIF program
https://www.embl-hamburg.de/biosaxs/dammif.html
Kikhney A (c)
DAMMIF program
https://www.embl-hamburg.de/biosaxs/dammif.html
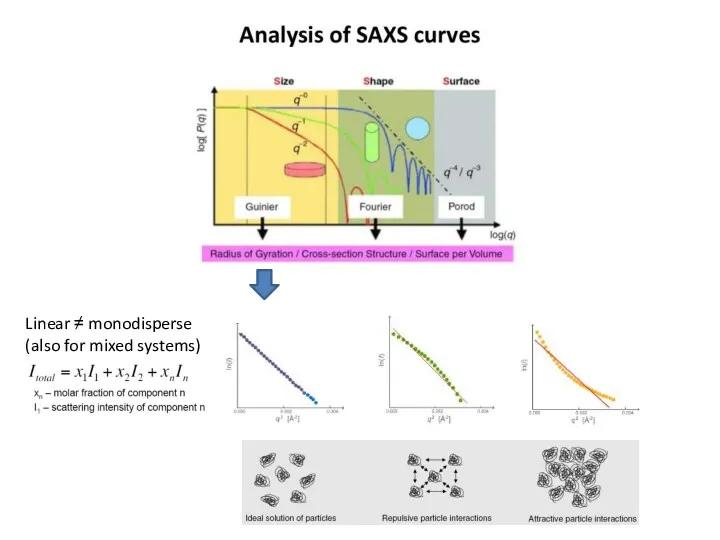
Linear ≠ monodisperse
(also for mixed systems)
Linear ≠ monodisperse
(also for mixed systems)
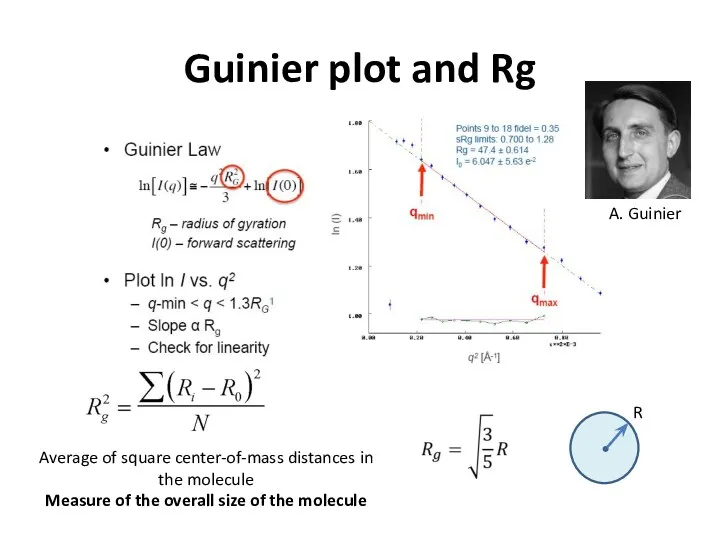
Guinier plot and Rg
Average of square center-of-mass distances in the molecule
Measure
Guinier plot and Rg
Average of square center-of-mass distances in the molecule
Measure
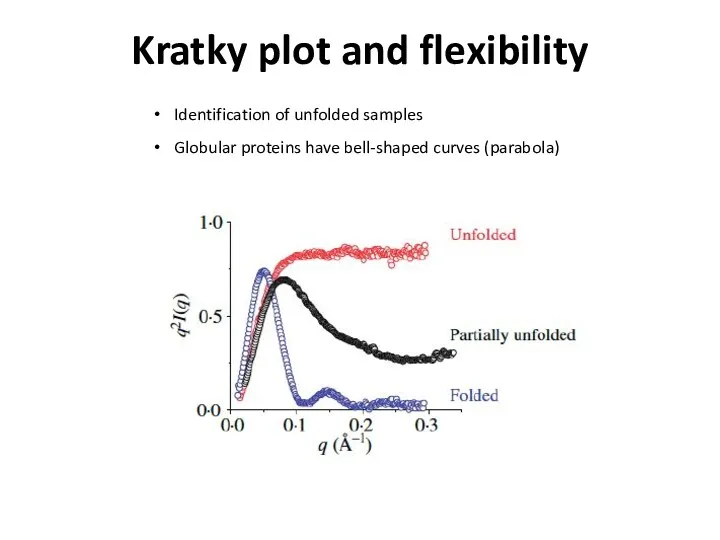
Kratky plot and flexibility
Identification of unfolded samples
Globular proteins have bell-shaped curves
Kratky plot and flexibility
Identification of unfolded samples
Globular proteins have bell-shaped curves
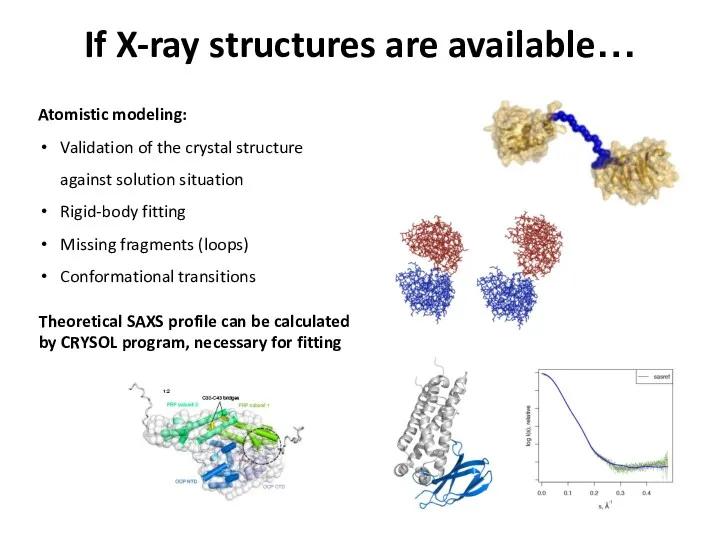
If X-ray structures are available…
Atomistic modeling:
Validation of the crystal structure against
If X-ray structures are available…
Atomistic modeling:
Validation of the crystal structure against
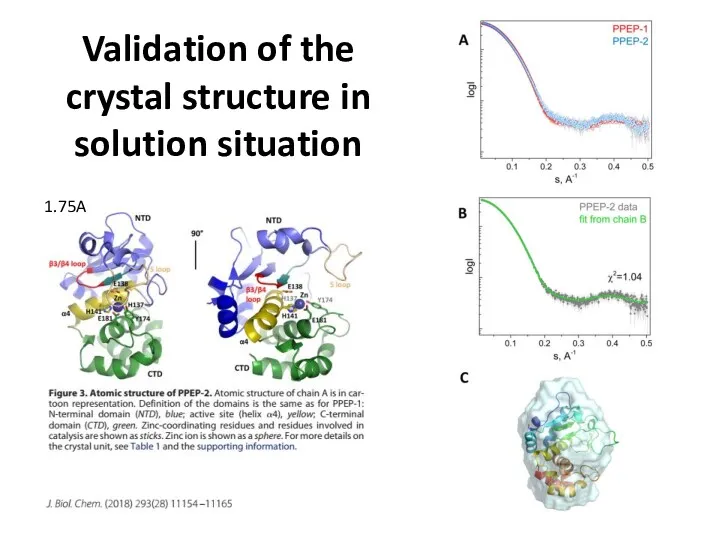
Validation of the crystal structure in solution situation
1.75A
Validation of the crystal structure in solution situation
1.75A
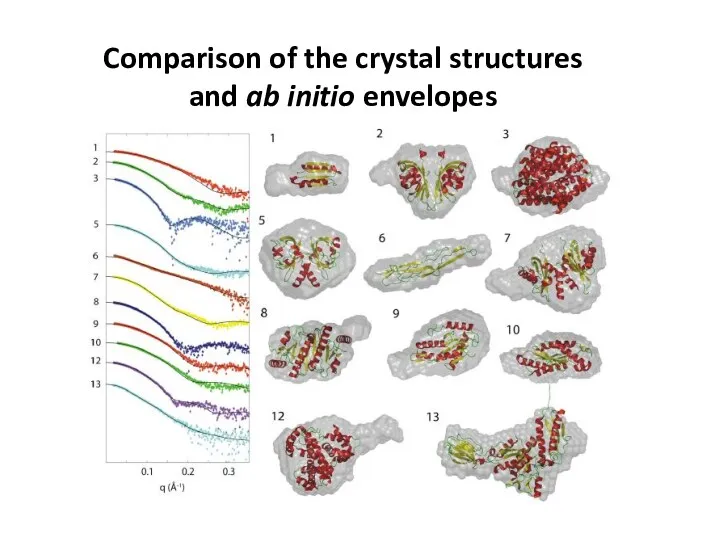
Comparison of the crystal structures and ab initio envelopes
Comparison of the crystal structures and ab initio envelopes
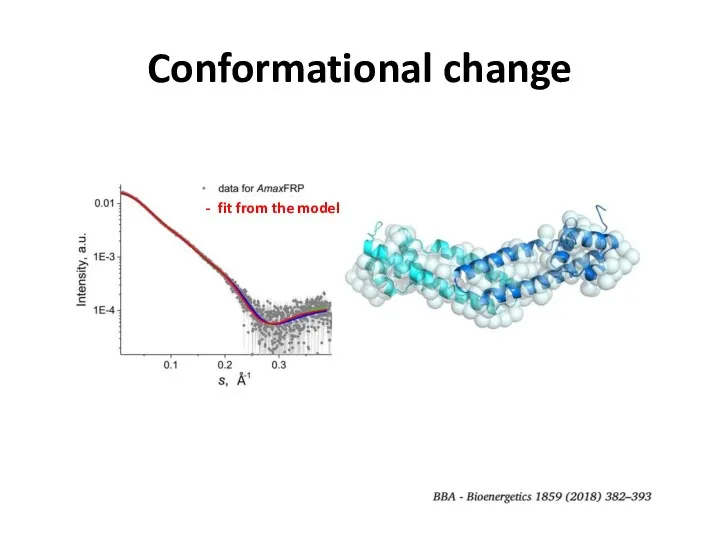
Conformational change
Conformational change
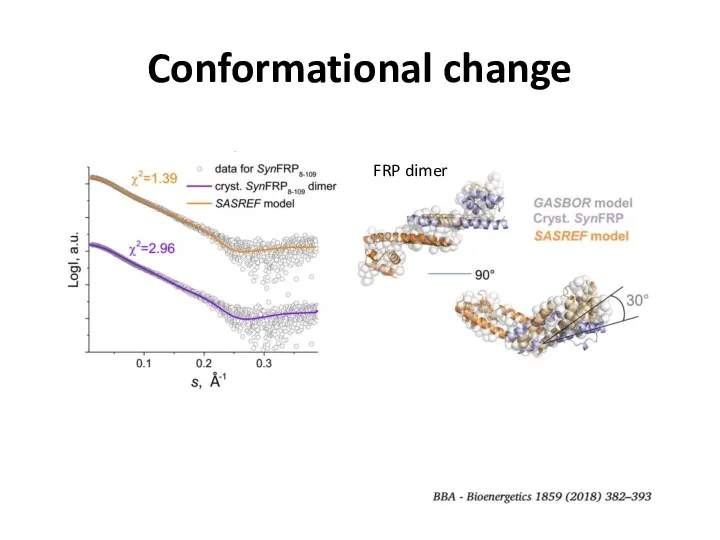
Conformational change
FRP dimer
Conformational change
FRP dimer
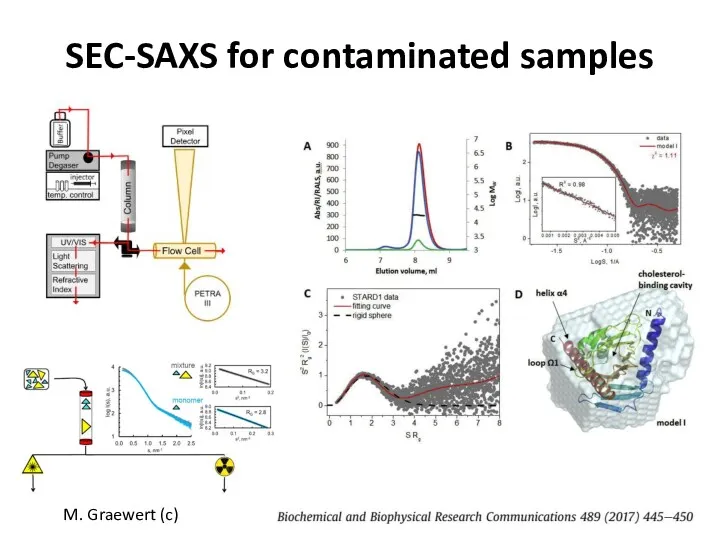
SEC-SAXS for contaminated samples
M. Graewert (c)
SEC-SAXS for contaminated samples
M. Graewert (c)
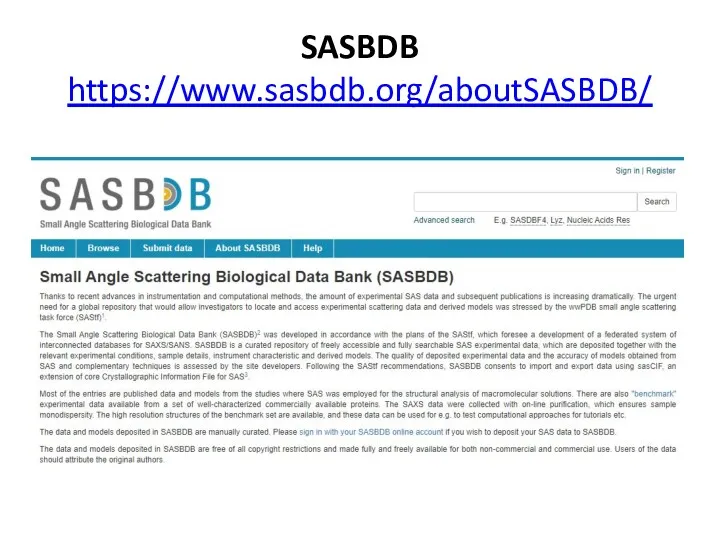
SASBDB https://www.sasbdb.org/aboutSASBDB/
SASBDB https://www.sasbdb.org/aboutSASBDB/
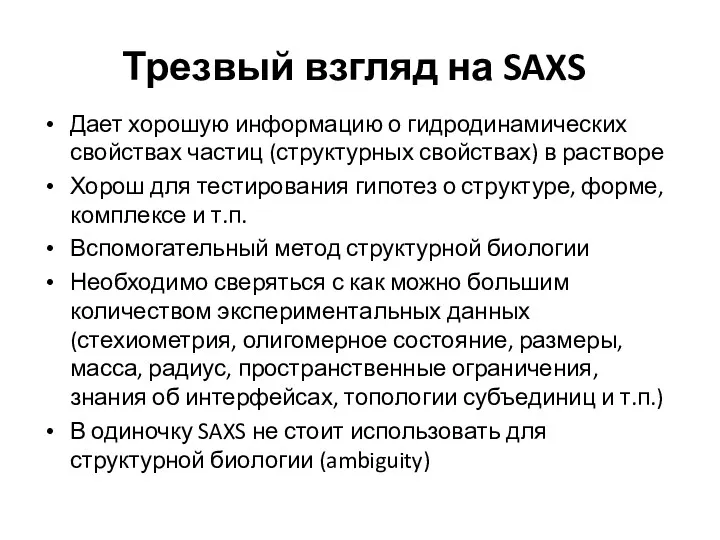
Трезвый взгляд на SAXS
Дает хорошую информацию о гидродинамических свойствах частиц
Трезвый взгляд на SAXS
Дает хорошую информацию о гидродинамических свойствах частиц
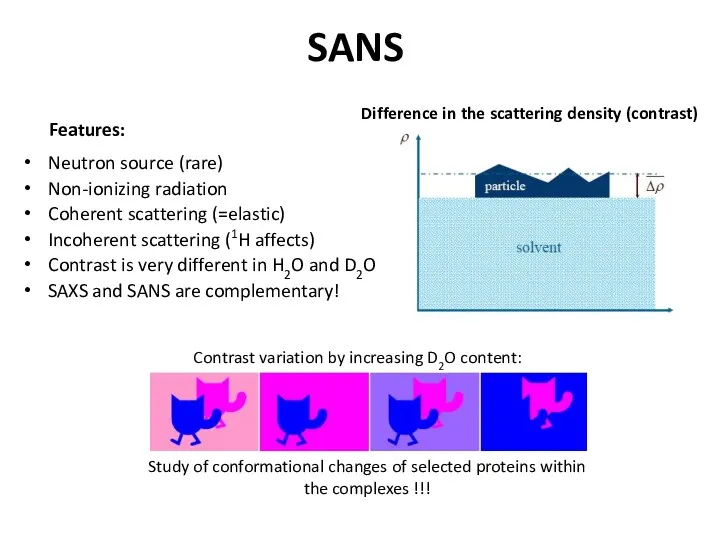
SANS
Neutron source (rare)
Non-ionizing radiation
Coherent scattering (=elastic)
Incoherent scattering (1H affects)
Contrast is very
SANS
Neutron source (rare)
Non-ionizing radiation
Coherent scattering (=elastic)
Incoherent scattering (1H affects)
Contrast is very
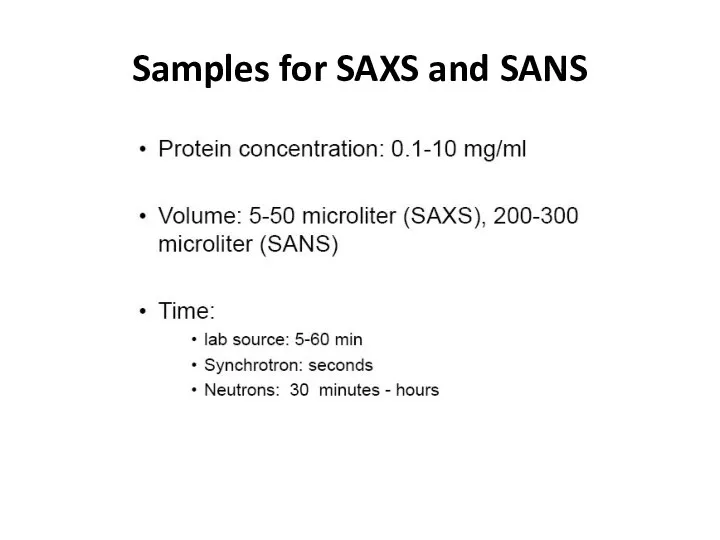
Samples for SAXS and SANS
Samples for SAXS and SANS
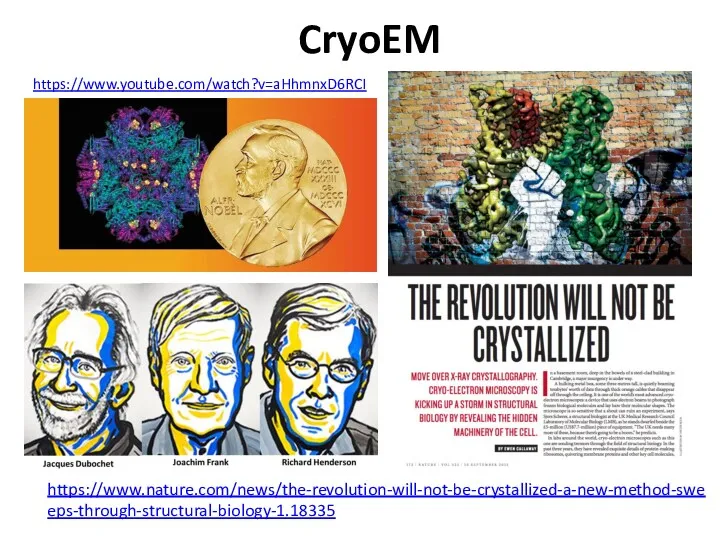
CryoEM
https://www.nature.com/news/the-revolution-will-not-be-crystallized-a-new-method-sweeps-through-structural-biology-1.18335
https://www.youtube.com/watch?v=aHhmnxD6RCI
CryoEM
https://www.nature.com/news/the-revolution-will-not-be-crystallized-a-new-method-sweeps-through-structural-biology-1.18335
https://www.youtube.com/watch?v=aHhmnxD6RCI
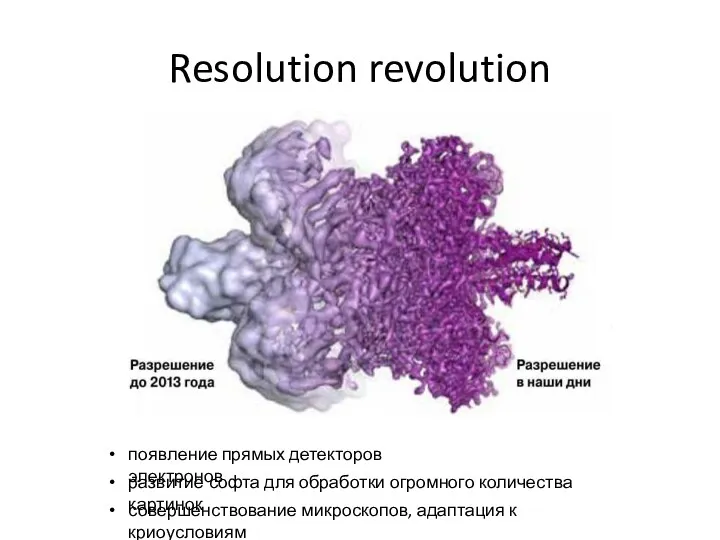
Resolution revolution
появление прямых детекторов электронов
развитие софта для обработки огромного количества картинок
совершенствование
Resolution revolution
появление прямых детекторов электронов
развитие софта для обработки огромного количества картинок
совершенствование
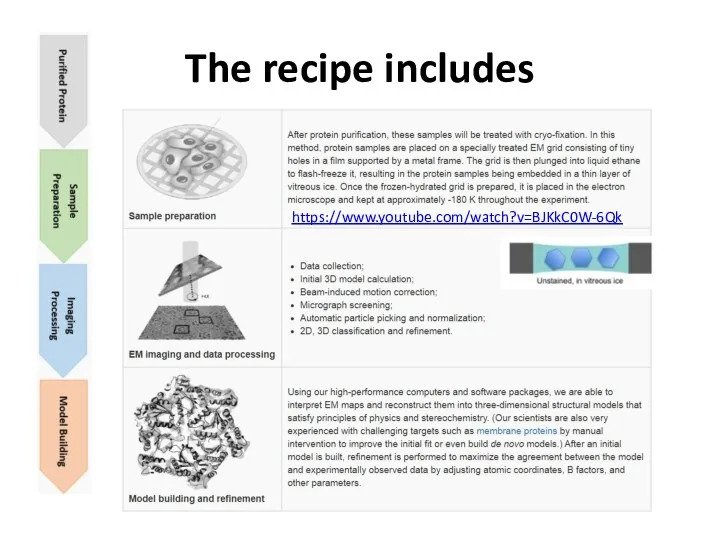
The recipe includes
https://www.youtube.com/watch?v=BJKkC0W-6Qk
The recipe includes
https://www.youtube.com/watch?v=BJKkC0W-6Qk
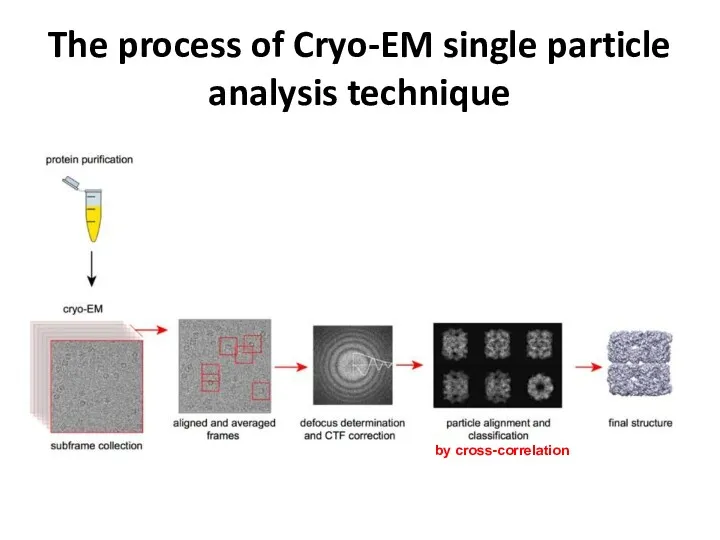
The process of Cryo-EM single particle analysis technique
by cross-correlation
The process of Cryo-EM single particle analysis technique
by cross-correlation
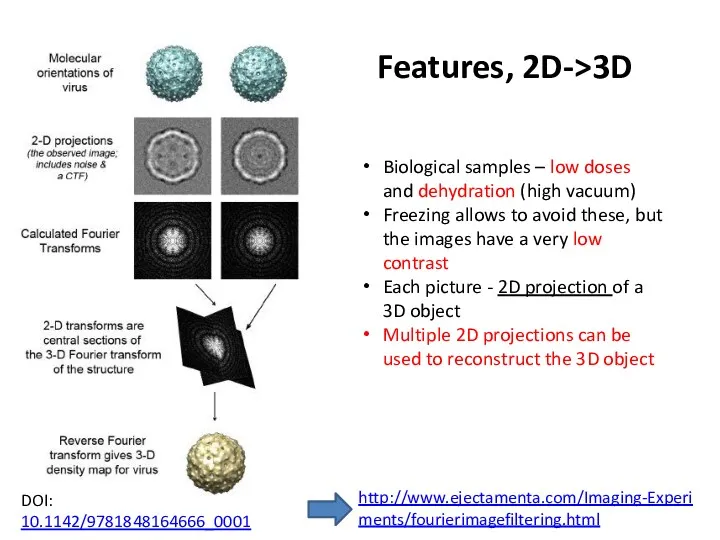
Features, 2D->3D
Biological samples – low doses and dehydration (high vacuum)
Freezing allows
Features, 2D->3D
Biological samples – low doses and dehydration (high vacuum)
Freezing allows
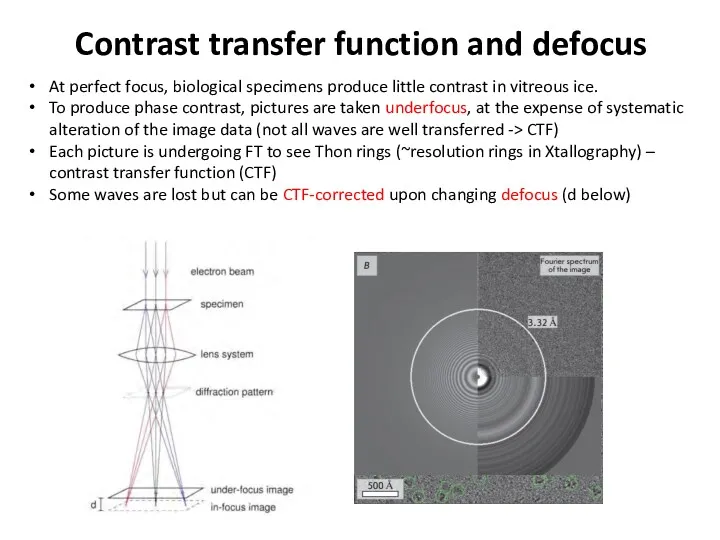
Contrast transfer function and defocus
At perfect focus, biological specimens produce little
Contrast transfer function and defocus
At perfect focus, biological specimens produce little
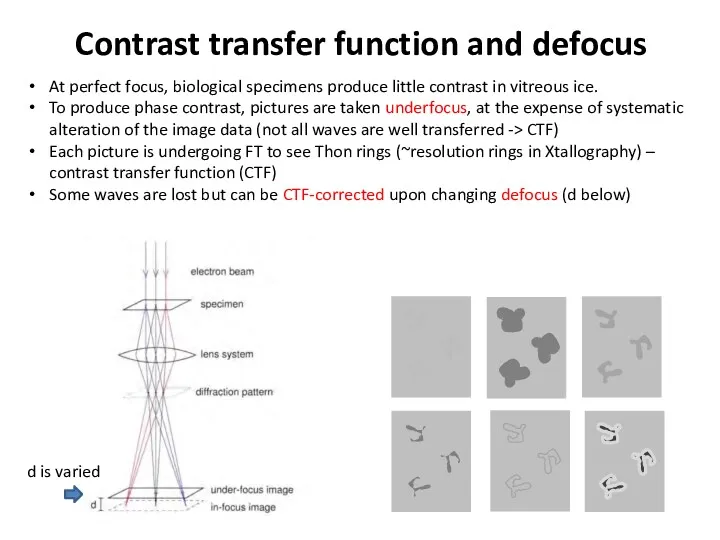
Contrast transfer function and defocus
At perfect focus, biological specimens produce little
Contrast transfer function and defocus
At perfect focus, biological specimens produce little
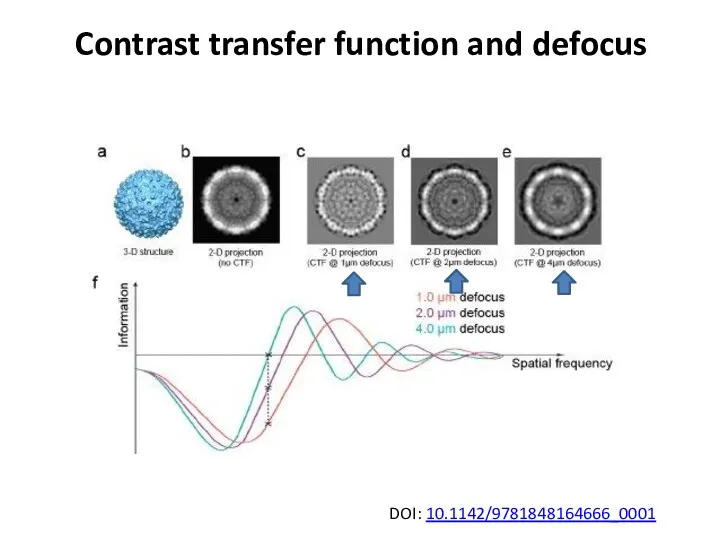
Contrast transfer function and defocus
DOI: 10.1142/9781848164666_0001
Contrast transfer function and defocus
DOI: 10.1142/9781848164666_0001
Single particle cryoEM requires tons of images
Particle orientations are classified by
Single particle cryoEM requires tons of images
Particle orientations are classified by
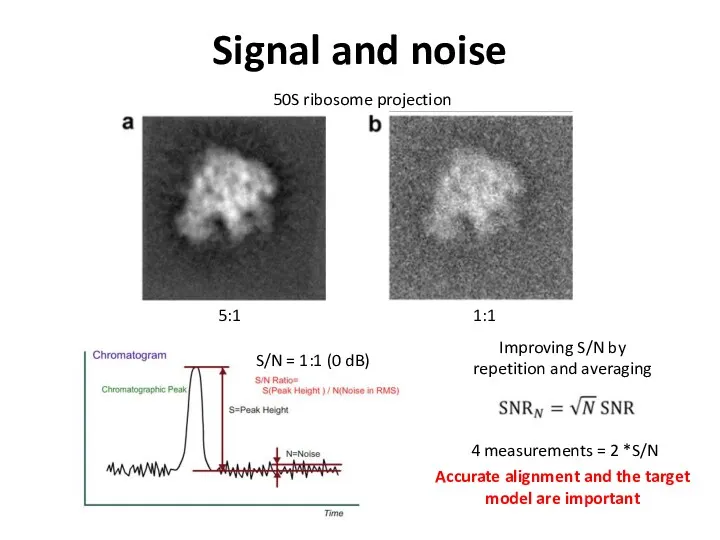
Signal and noise
5:1
1:1
S/N = 1:1 (0 dB)
Improving S/N by repetition and
Signal and noise
5:1
1:1
S/N = 1:1 (0 dB)
Improving S/N by repetition and
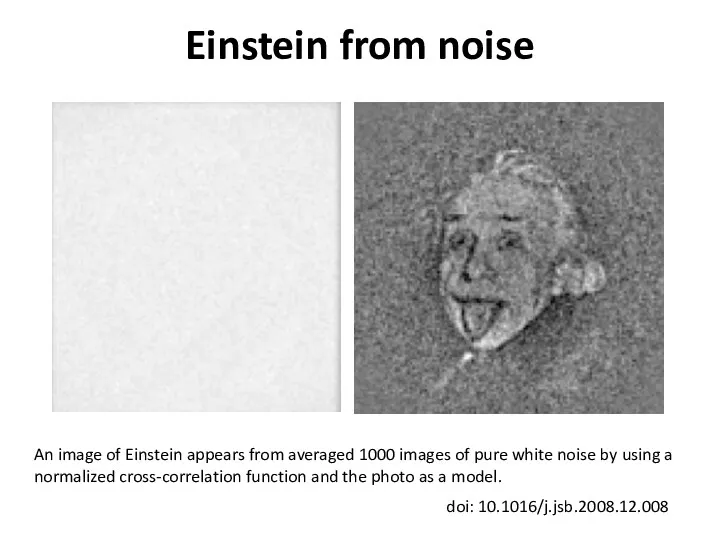
Einstein from noise
An image of Einstein appears from averaged 1000 images
Einstein from noise
An image of Einstein appears from averaged 1000 images
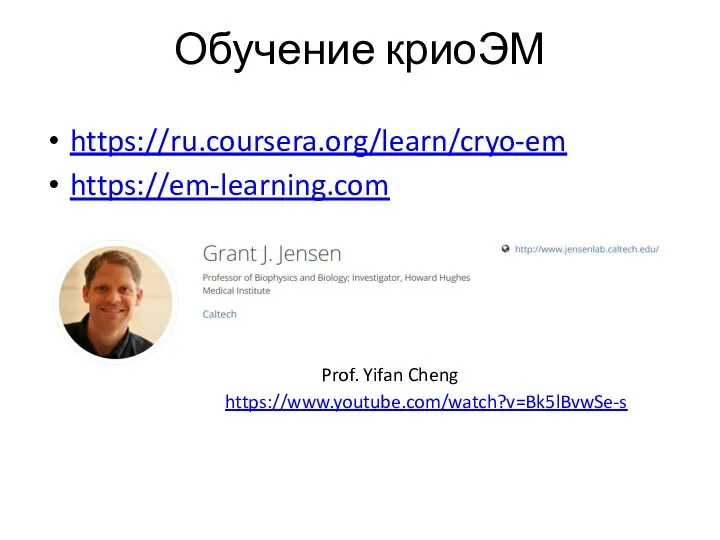
Обучение криоЭМ
https://ru.coursera.org/learn/cryo-em
https://em-learning.com
https://www.youtube.com/watch?v=Bk5lBvwSe-s
Prof. Yifan Cheng
Обучение криоЭМ
https://ru.coursera.org/learn/cryo-em
https://em-learning.com
https://www.youtube.com/watch?v=Bk5lBvwSe-s
Prof. Yifan Cheng
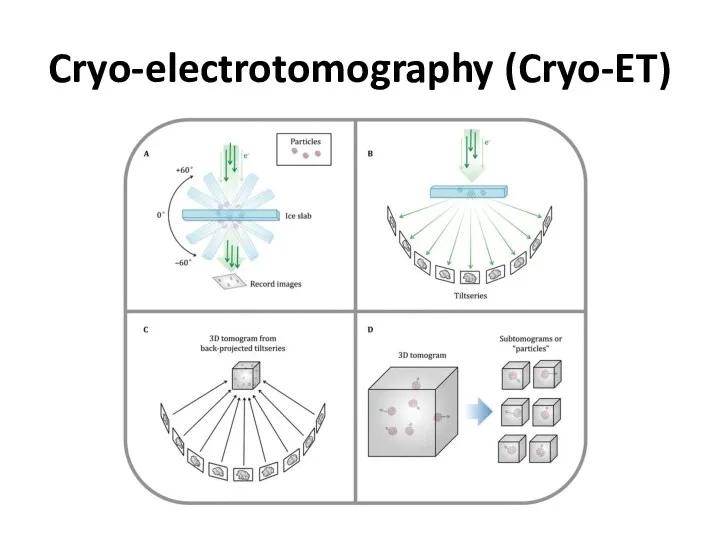
Cryo-electrotomography (Cryo-ET)
Cryo-electrotomography (Cryo-ET)
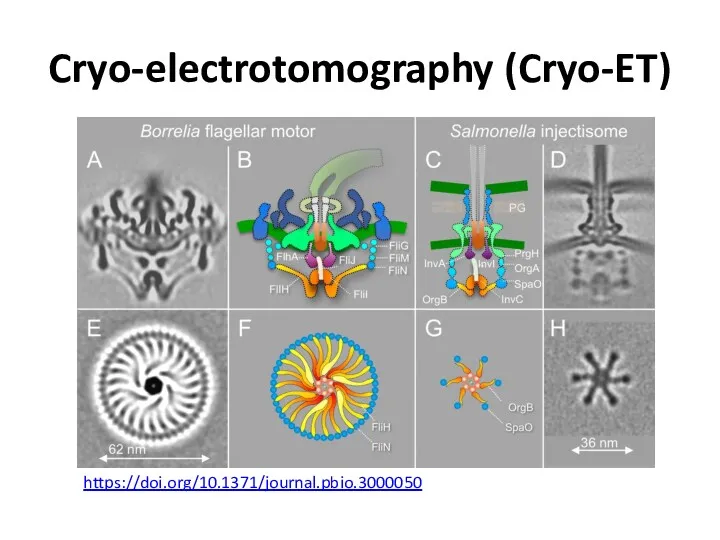
Cryo-electrotomography (Cryo-ET)
https://doi.org/10.1371/journal.pbio.3000050
Cryo-electrotomography (Cryo-ET)
https://doi.org/10.1371/journal.pbio.3000050
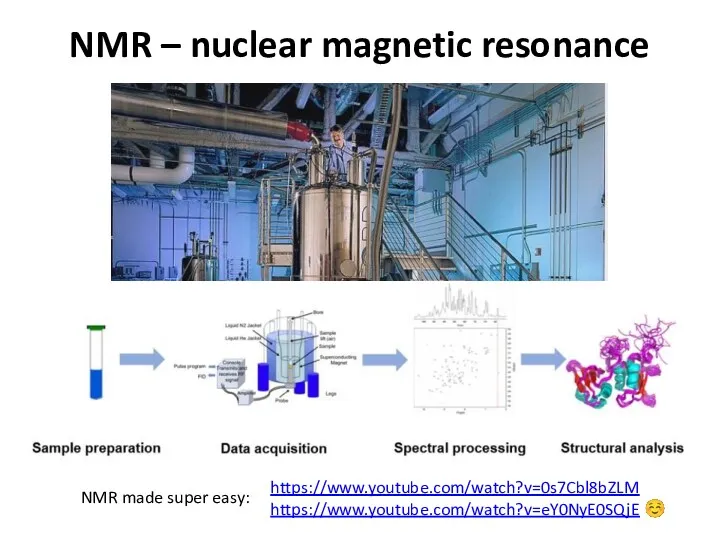
NMR – nuclear magnetic resonance
https://www.youtube.com/watch?v=0s7Cbl8bZLM
https://www.youtube.com/watch?v=eY0NyE0SQjE ☺
NMR made super easy:
NMR – nuclear magnetic resonance
https://www.youtube.com/watch?v=0s7Cbl8bZLM
https://www.youtube.com/watch?v=eY0NyE0SQjE ☺
NMR made super easy:
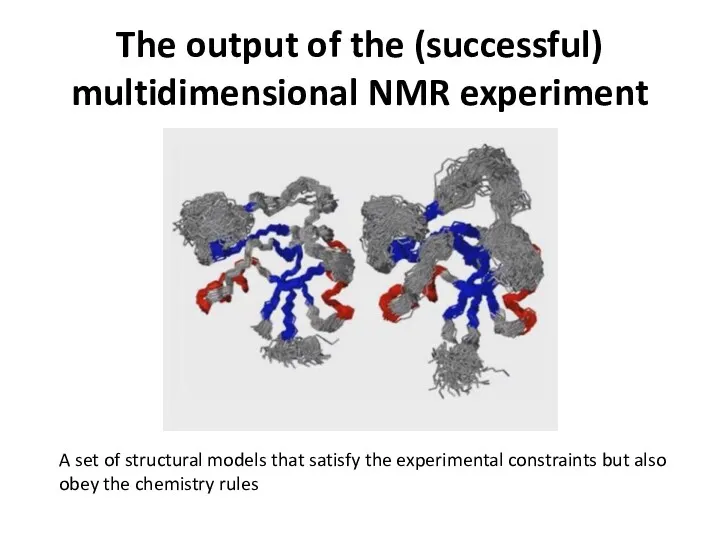
The output of the (successful) multidimensional NMR experiment
A set of structural
The output of the (successful) multidimensional NMR experiment
A set of structural
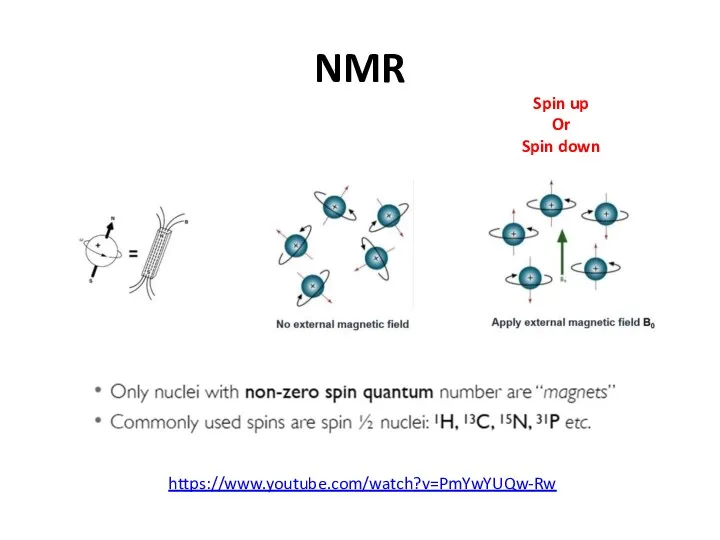
NMR
Spin up
Or
Spin down
https://www.youtube.com/watch?v=PmYwYUQw-Rw
NMR
Spin up
Or
Spin down
https://www.youtube.com/watch?v=PmYwYUQw-Rw
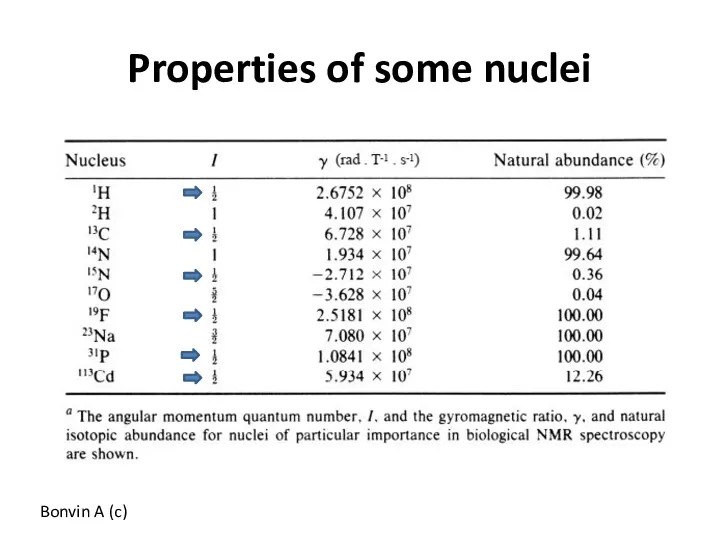
Properties of some nuclei
Bonvin A (c)
Properties of some nuclei
Bonvin A (c)
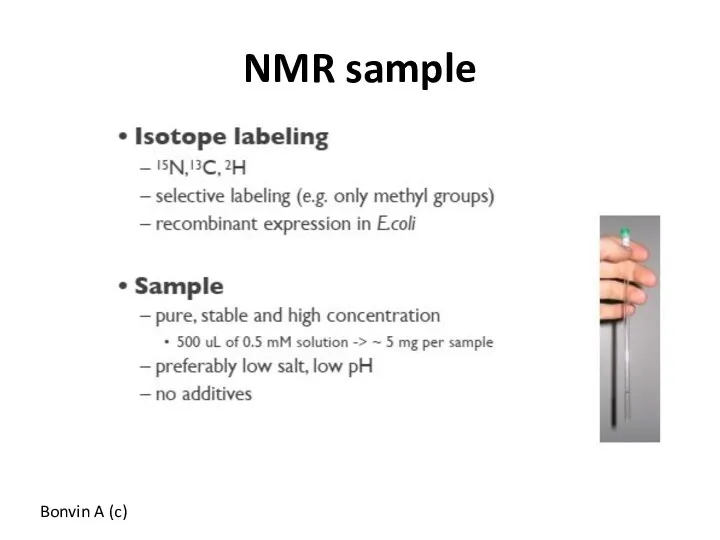
NMR sample
Bonvin A (c)
NMR sample
Bonvin A (c)
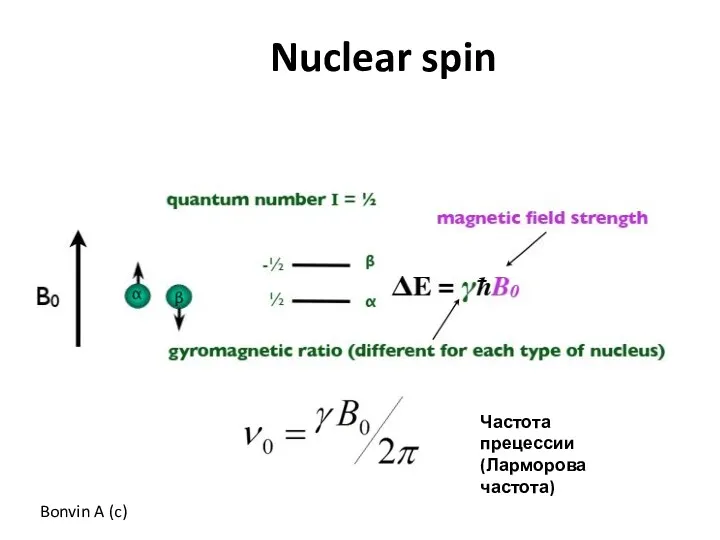
Bonvin A (c)
Nuclear spin
Частота прецессии (Ларморова частота)
Bonvin A (c)
Nuclear spin
Частота прецессии (Ларморова частота)
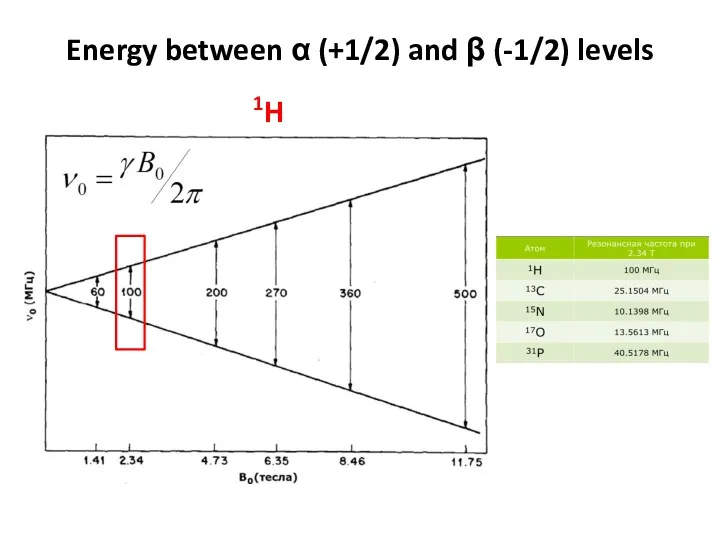
Energy between α (+1/2) and β (-1/2) levels
1H
Energy between α (+1/2) and β (-1/2) levels
1H
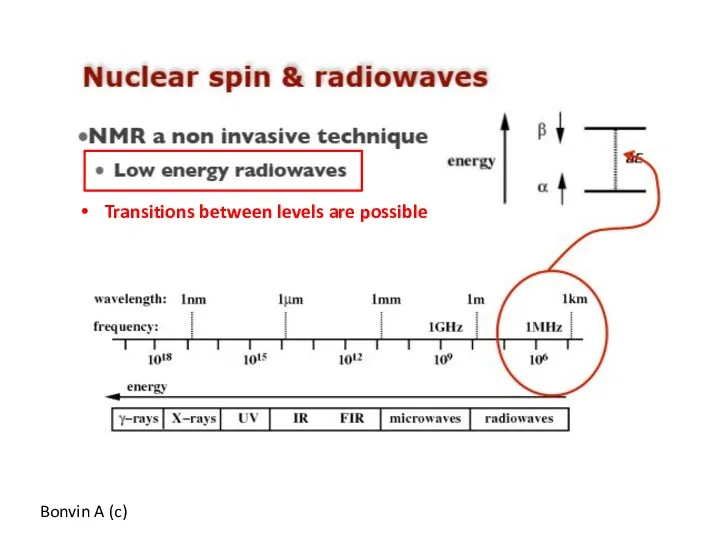
Transitions between levels are possible
Transitions between levels are possible
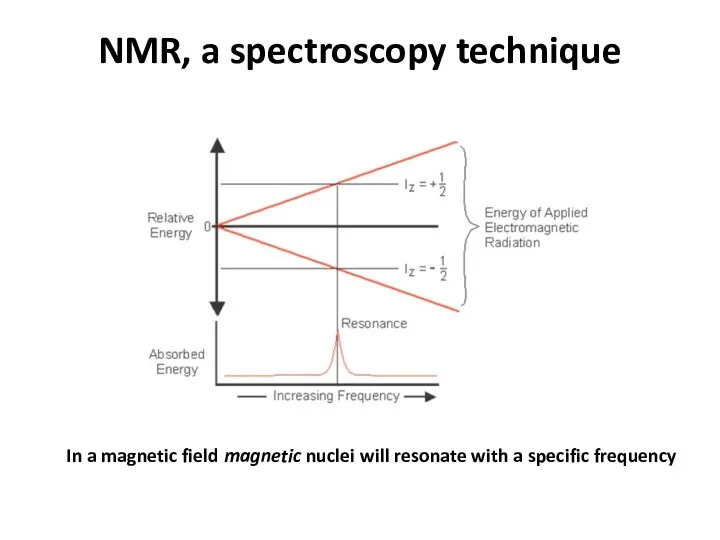
NMR, a spectroscopy technique
In a magnetic field magnetic nuclei will resonate
NMR, a spectroscopy technique
In a magnetic field magnetic nuclei will resonate
Bonvin A (c)
Bonvin A (c)
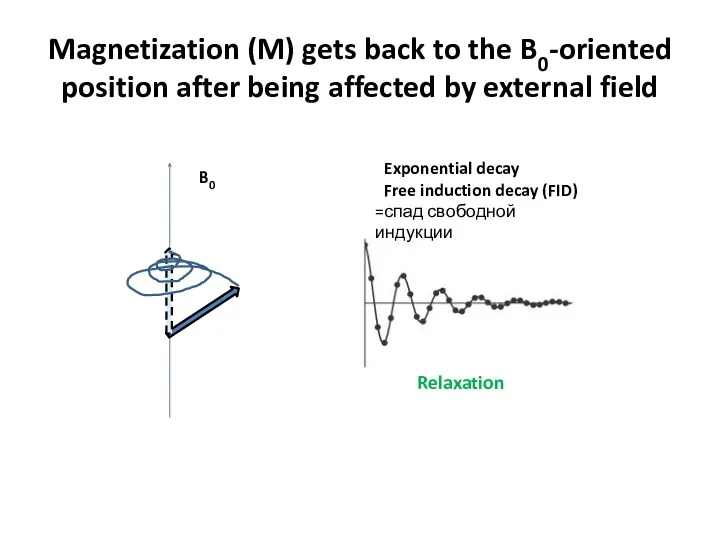
Magnetization (M) gets back to the B0-oriented position after being affected
Magnetization (M) gets back to the B0-oriented position after being affected
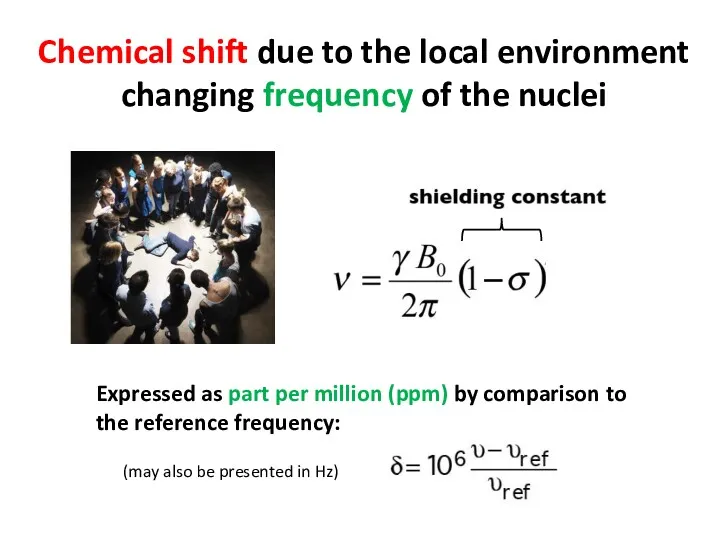
Chemical shift due to the local environment changing frequency of the
Chemical shift due to the local environment changing frequency of the
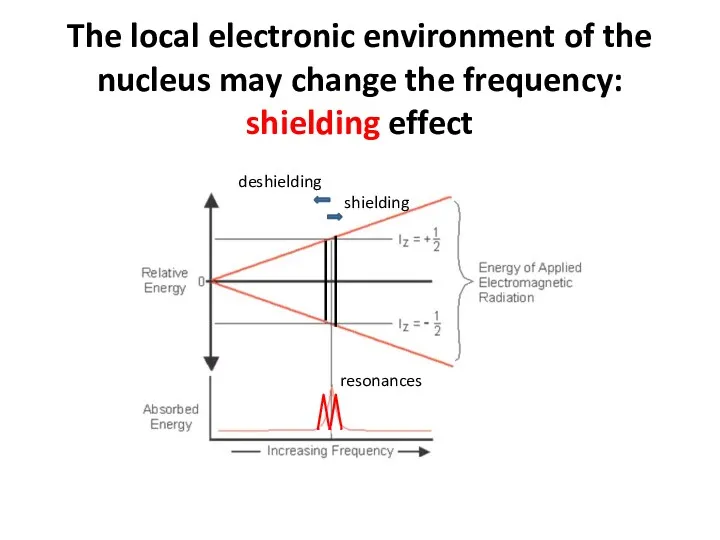
The local electronic environment of the nucleus may change the frequency:
The local electronic environment of the nucleus may change the frequency:
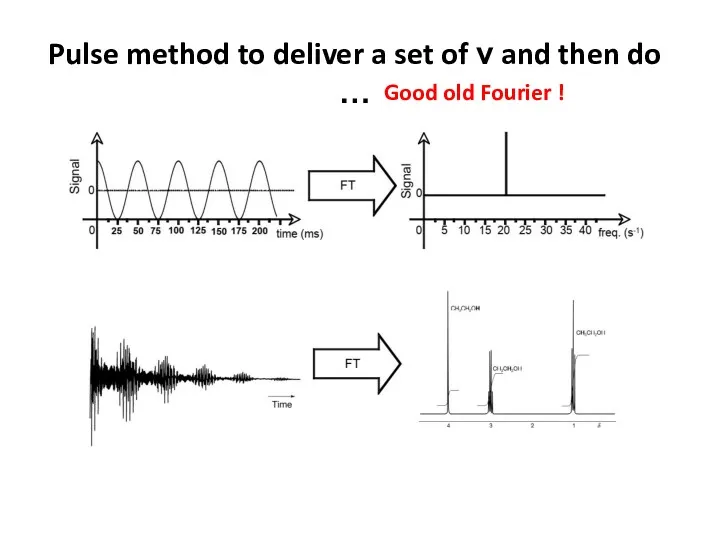
Pulse method to deliver a set of ν and then do
Pulse method to deliver a set of ν and then do
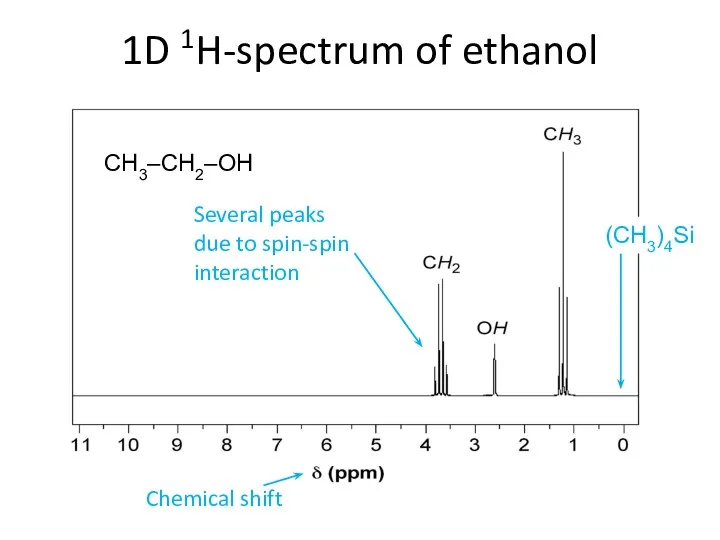
1D 1H-spectrum of ethanol
CH3–CH2–OH
(CH3)4Si
Chemical shift
Several peaks due to spin-spin interaction
1D 1H-spectrum of ethanol
CH3–CH2–OH
(CH3)4Si
Chemical shift
Several peaks due to spin-spin interaction
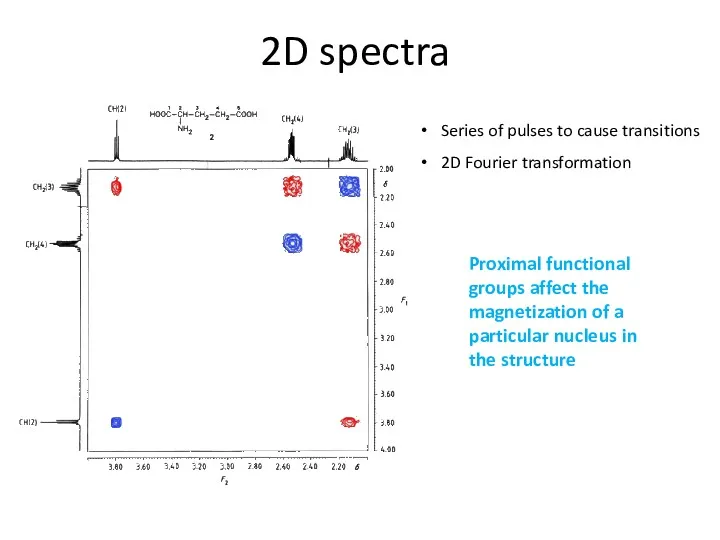
2D spectra
Series of pulses to cause transitions
2D Fourier transformation
Proximal functional groups
2D spectra
Series of pulses to cause transitions
2D Fourier transformation
Proximal functional groups
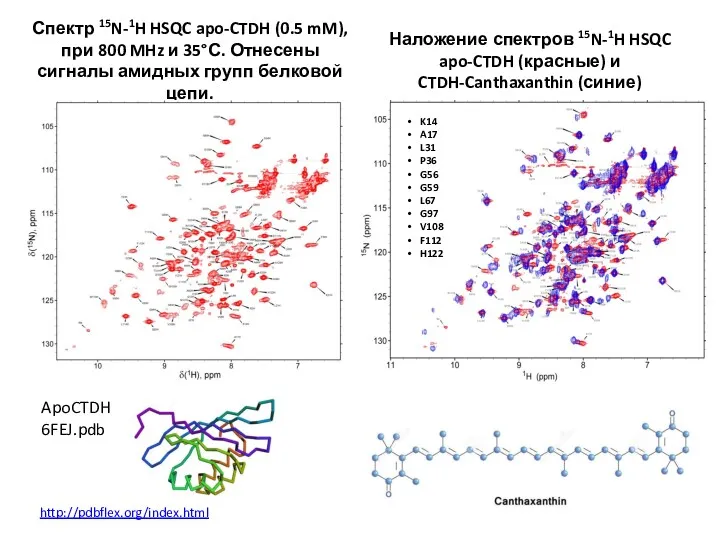
Спектр 15N-1H HSQC apo-CTDH (0.5 mM), при 800 MHz и 35°С.
Спектр 15N-1H HSQC apo-CTDH (0.5 mM), при 800 MHz и 35°С.
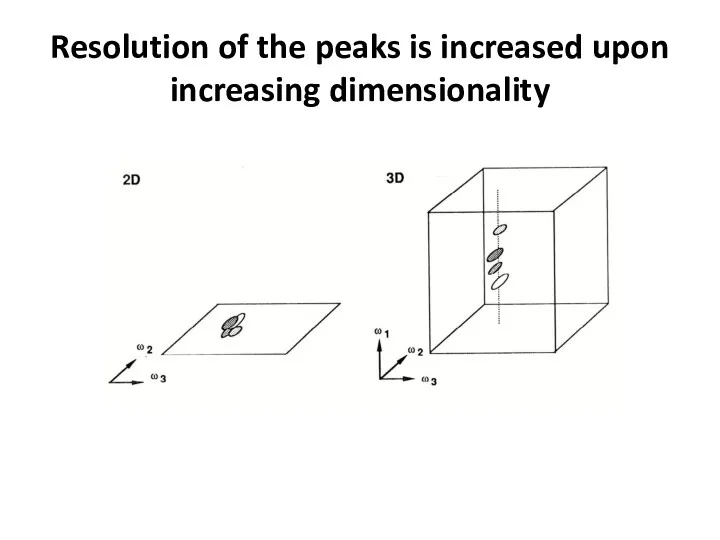
Resolution of the peaks is increased upon increasing dimensionality
Resolution of the peaks is increased upon increasing dimensionality
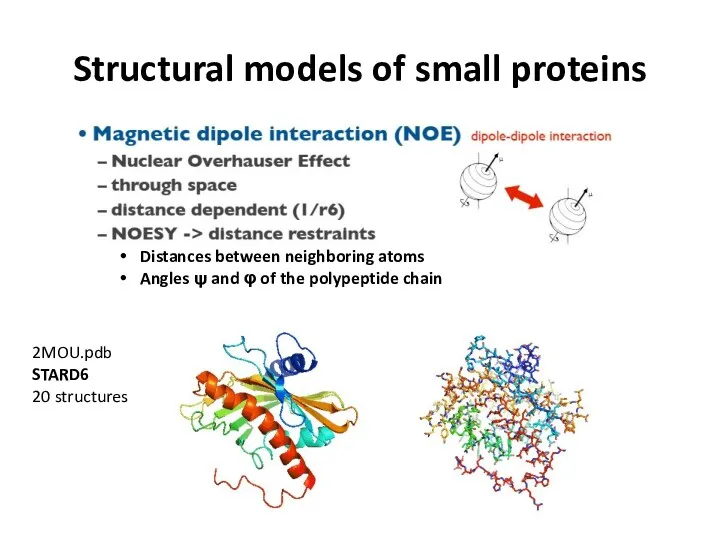
Structural models of small proteins
Distances between neighboring atoms
Angles ψ and φ
Structural models of small proteins
Distances between neighboring atoms
Angles ψ and φ
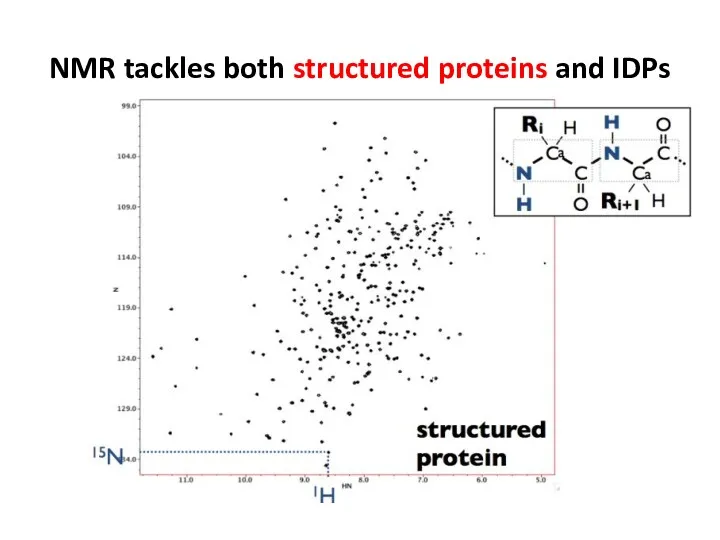
NMR tackles both structured proteins and IDPs
NMR tackles both structured proteins and IDPs
NMR tackles both structured proteins and IDPs
NMR tackles both structured proteins and IDPs
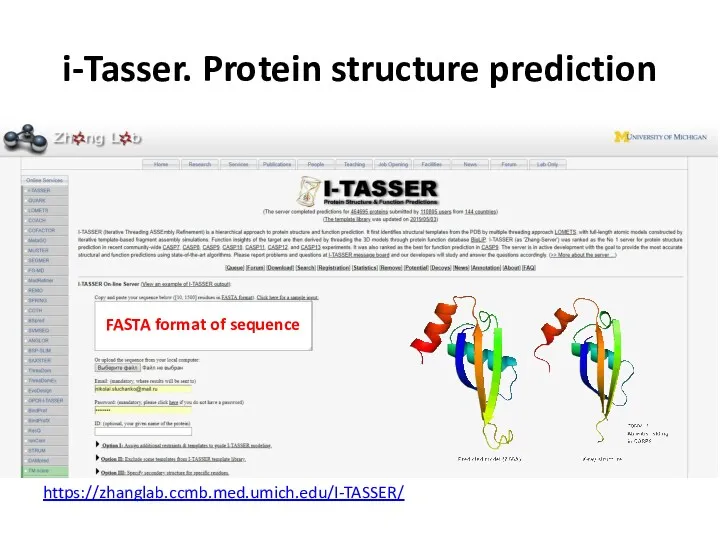
i-Tasser. Protein structure prediction
FASTA format of sequence
https://zhanglab.ccmb.med.umich.edu/I-TASSER/
i-Tasser. Protein structure prediction
FASTA format of sequence
https://zhanglab.ccmb.med.umich.edu/I-TASSER/
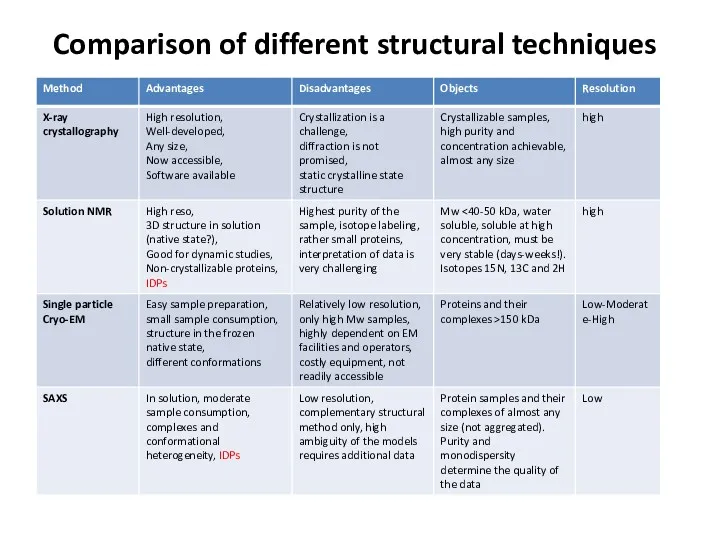
Comparison of different structural techniques
Comparison of different structural techniques
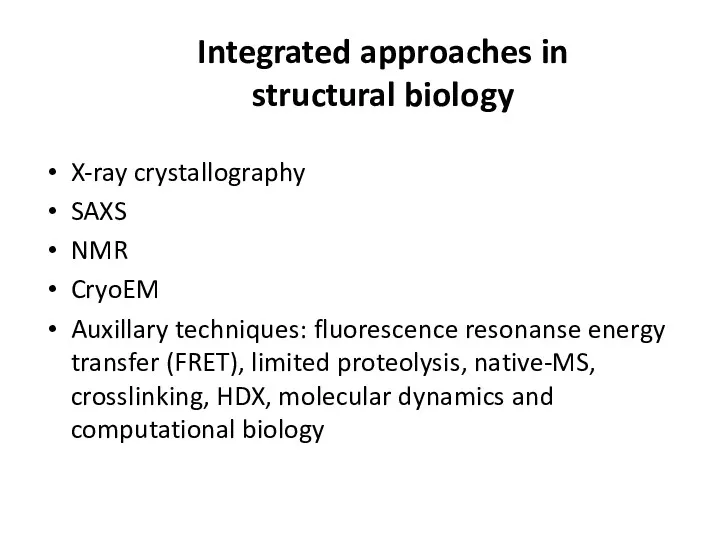
Integrated approaches in structural biology
X-ray crystallography
SAXS
NMR
CryoEM
Auxillary techniques: fluorescence resonanse energy transfer
Integrated approaches in structural biology
X-ray crystallography
SAXS
NMR
CryoEM
Auxillary techniques: fluorescence resonanse energy transfer
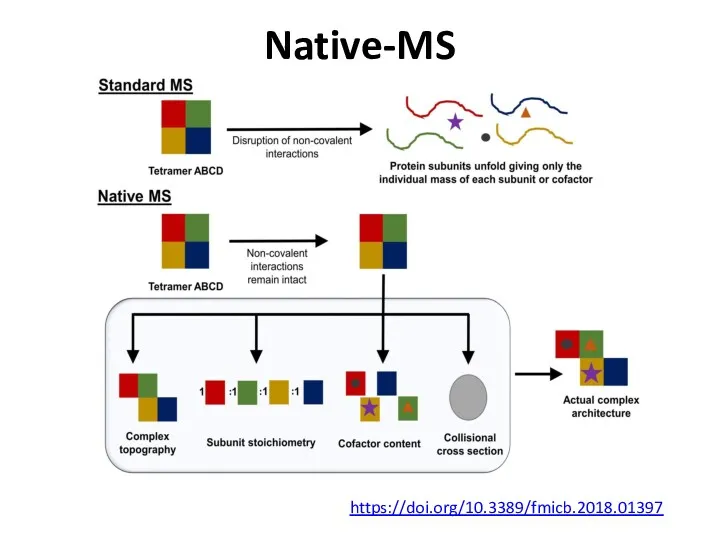
Native-MS
https://doi.org/10.3389/fmicb.2018.01397
Native-MS
https://doi.org/10.3389/fmicb.2018.01397
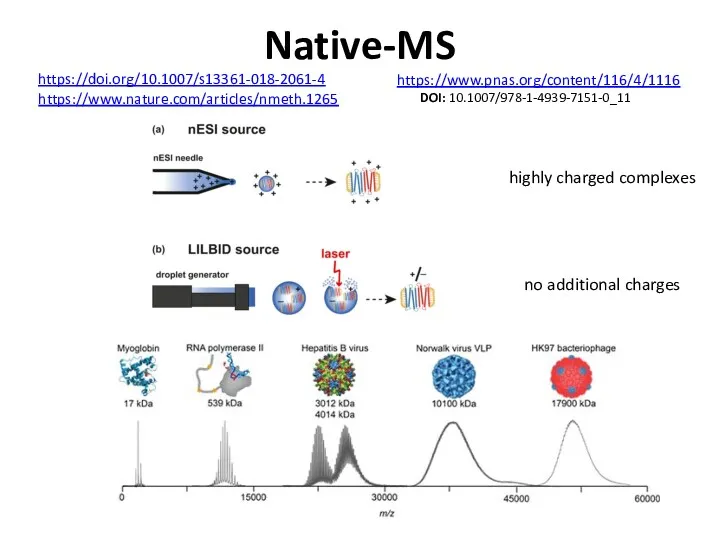
Native-MS
https://doi.org/10.1007/s13361-018-2061-4
highly charged complexes
no additional charges
https://www.nature.com/articles/nmeth.1265
https://www.pnas.org/content/116/4/1116
DOI: 10.1007/978-1-4939-7151-0_11
Native-MS
https://doi.org/10.1007/s13361-018-2061-4
highly charged complexes
no additional charges
https://www.nature.com/articles/nmeth.1265
https://www.pnas.org/content/116/4/1116
DOI: 10.1007/978-1-4939-7151-0_11
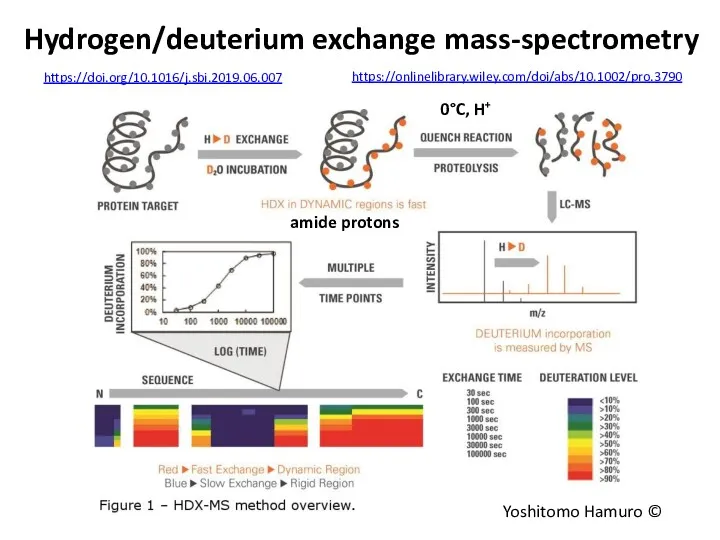
Hydrogen/deuterium exchange mass-spectrometry
Yoshitomo Hamuro ©
0°C, H+
https://doi.org/10.1016/j.sbi.2019.06.007
https://onlinelibrary.wiley.com/doi/abs/10.1002/pro.3790
amide protons
Hydrogen/deuterium exchange mass-spectrometry
Yoshitomo Hamuro ©
0°C, H+
https://doi.org/10.1016/j.sbi.2019.06.007
https://onlinelibrary.wiley.com/doi/abs/10.1002/pro.3790
amide protons
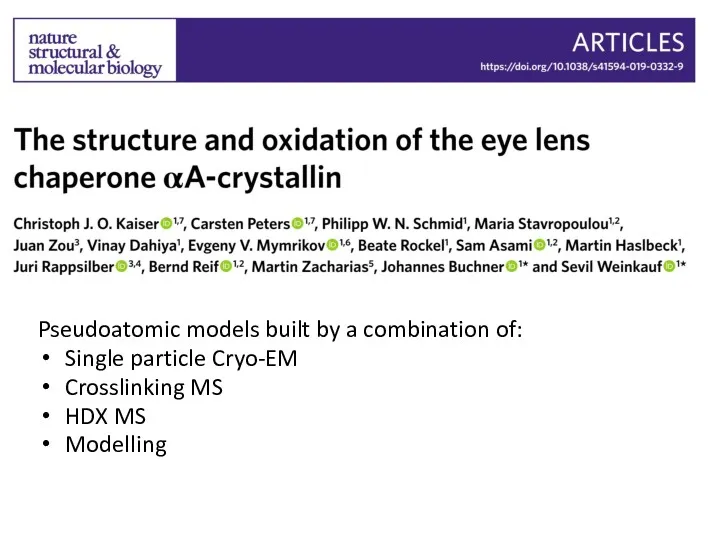
Pseudoatomic models built by a combination of:
Single particle Cryo-EM
Crosslinking MS
HDX MS
Modelling
Pseudoatomic models built by a combination of:
Single particle Cryo-EM
Crosslinking MS
HDX MS
Modelling
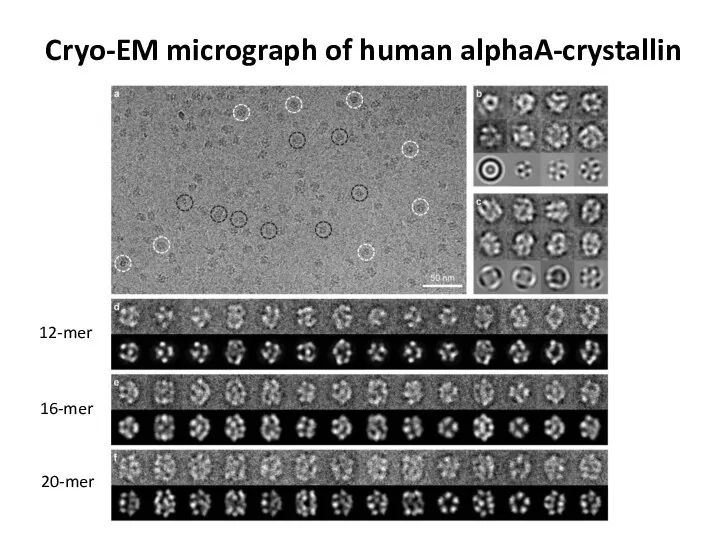
Cryo-EM micrograph of human alphaA-crystallin
12-mer
16-mer
20-mer
Cryo-EM micrograph of human alphaA-crystallin
12-mer
16-mer
20-mer
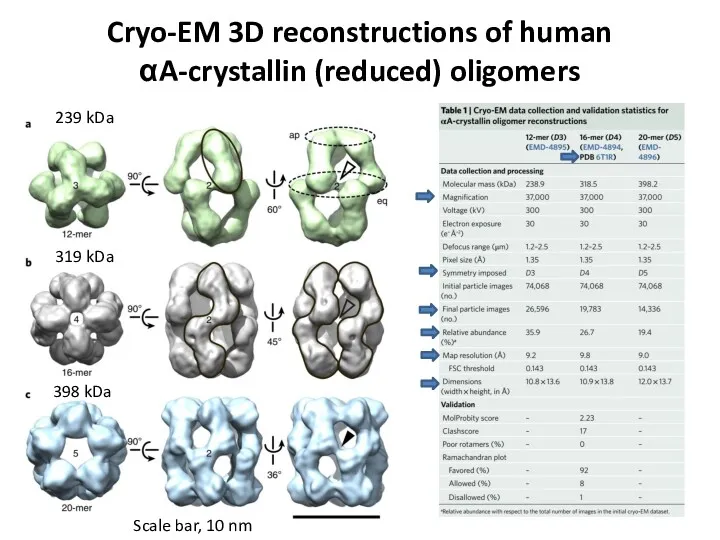
Cryo-EM 3D reconstructions of human αA-crystallin (reduced) oligomers
Scale bar, 10 nm
239
Cryo-EM 3D reconstructions of human αA-crystallin (reduced) oligomers
Scale bar, 10 nm
239
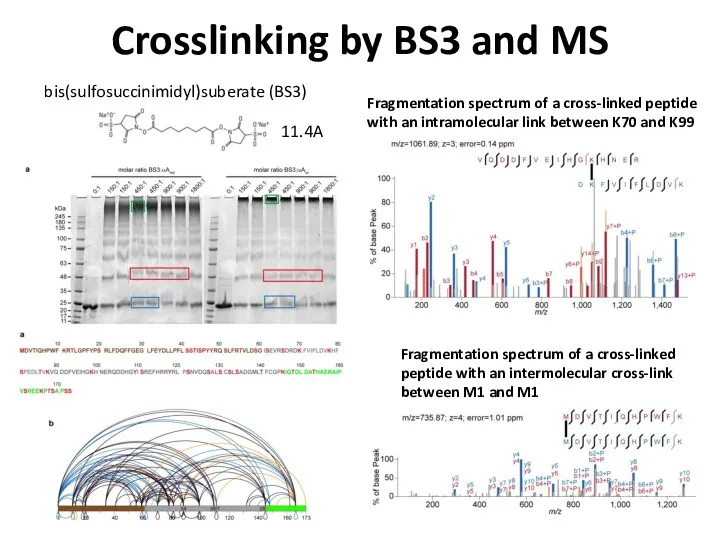
Crosslinking by BS3 and MS
Fragmentation spectrum of a cross-linked peptide with
Crosslinking by BS3 and MS
Fragmentation spectrum of a cross-linked peptide with
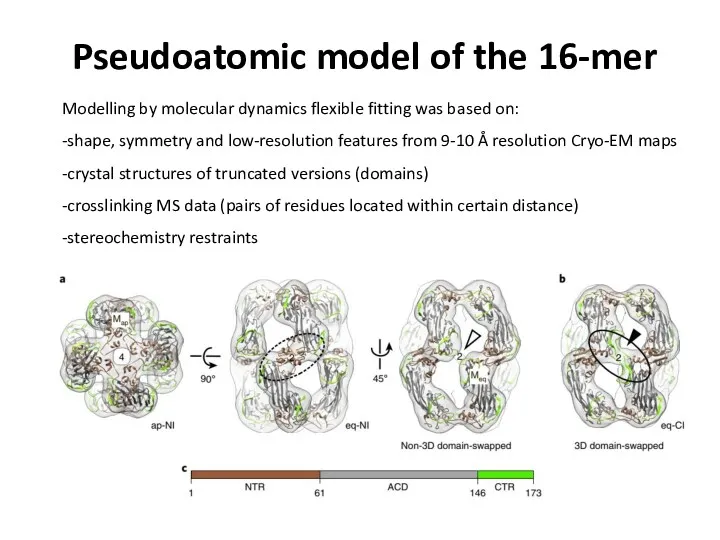
Pseudoatomic model of the 16-mer
Modelling by molecular dynamics flexible fitting was
Pseudoatomic model of the 16-mer
Modelling by molecular dynamics flexible fitting was
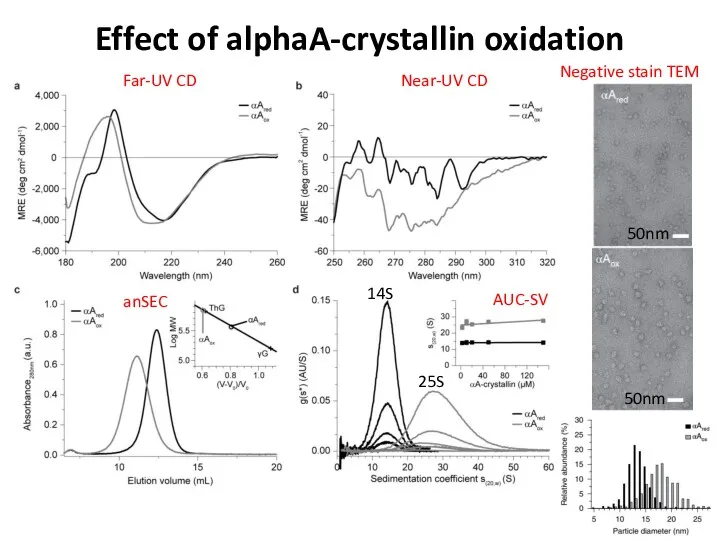
Effect of alphaA-crystallin oxidation
Far-UV CD
Near-UV CD
anSEC
AUC-SV
14S
25S
50nm
50nm
Negative stain TEM
Effect of alphaA-crystallin oxidation
Far-UV CD
Near-UV CD
anSEC
AUC-SV
14S
25S
50nm
50nm
Negative stain TEM
 Спутниковая связь
 Конструктор. Что мы знаем о нем? Виды детских конструкторов
 Lista de precios Rusia
 Дискалькулия специфическое нарушение обучения счету, проявляющееся в разных возрастах дошкольной и школьной популяции
 Наука первой половины XIX века
 Психологический подход к проблеме заикания
 Мақта матасы
 Пневмонии. Бронхиальная астма. Хроническая обструктивная болезнь легких. Основные клинические проявления. Диагностика
 Презентация портфолио учителя начальных классов
 Презентация День Конституции России
 Татар халык табышмаклары
 Геморрой. Факторы, способствующие развитию заболевания
 Dydd Gwyl Dewi
 Перелетные птицы. Ознакомление детей с окружающим миром
 Електронна біржа праці
 Эргономика спальной комнаты.Автоподъемник кровати
 Военные топографы
 Маркетинг территорий: маркетинговая среда
 Языки программирования
 Памятники Ижевска
 Квадратный корень из произведения
 Комментарии к предложенным высказываниям
 Презентация История школьной формы в России. Подготовительная группа.
 Хронический бронхит
 Экологические правила.
 Миф о Йиркапе
 Арнайы өндеу
 Артикуляционная гимнастика для звука Ш