- Innova & PDS-NT Overview

Содержание
- 2. Tabel of content Why Innova & PDS-NT Overview Innova Overview PDS-NT Equipment Monitoring Integration & customer
- 3. Innova and PDS-NT: Why? Maximize added value and reduce cost Process each bird into its most
- 6. Effective and efficient product allocation Deliver your customers Right products Right time Right volume In an
- 7. Supply versus Demand Growing product assortment Flock types, weight ranges, free range, GMO free, …
- 8. Supply ?? Demand
- 9. Tabel of content Why Innova & PDS-NT Overview Innova Overview PDS-NT Equipment Monitoring Integration & customer
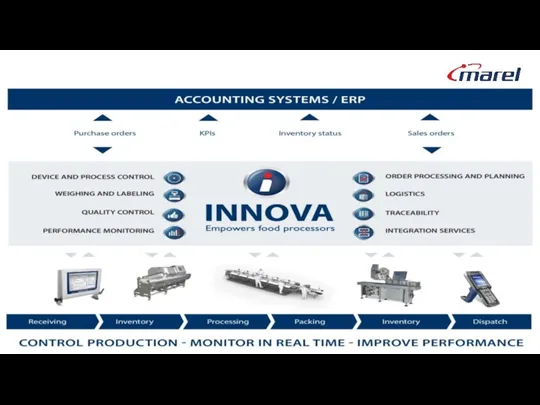
- 10. Empowers food processors Device & Process Control Weighing & Labeling Quality Control Performance Monitoring Order Processing
- 14. Dashboarding – Examples
- 15. Why Implement MES ? Specifically designed for Manufacturing Execution and Device Support Handling and processing hugh
- 16. Integrated solutions – horizontal integration Linking processing steps together Prevent sub optimization
- 17. Integrated solutions – vertical integration Link with equipment: Collecting data from equipment for monitoring and reporting
- 18. Innova – Modules & Processes Grading Sensor-X Inventory Control Trimming Packing Lite Final Goods Manager Portioning
- 20. Innova base
- 21. Innova Administration Kernel of the Innova system Latest technology from Microsoft & SQL Server database Development
- 22. Innova Packing
- 23. Innova Packing Innova offers simple as well as advanced packing and labeling solutions with full inventory,
- 24. Packing stations
- 25. Personal id-tags Logging in and out per station or department/line Employee Login/Logout
- 26. Yield and throughput Report
- 27. Innova Label management
- 28. Move away from preprinted labels X
- 29. Main features Labeling Easy to design labels with visual designer Full integration with the Innova production
- 30. Label designer – WYSIWYG and „drag & drop“
- 31. Printer support Intermec, Sato, Datamax & Zebra printers Native support, does not use Windows drivers Any
- 32. Innova Grading & Batching
- 33. Innova Grading Main Purpose Controls and monitors grading operation key benefits: Manages all types of graders
- 34. Innnova Grading - Real time monitoring
- 35. Innova Checkweighing
- 36. Key benefits Real-time monitoring allows for intervention if performance deviates from expectations. Centralized remote configuration of
- 37. E-weighing overview
- 38. Weight distribution chart, E-weighing job
- 39. Innova Weight Price Labeler
- 40. WPL Selection Screen Innova is then selected on the Weigh Price Labeller
- 41. WPL - Order Entry Orders are entered into the Innova system, And then made available to
- 42. Order Entry The production order is then selected through Innova on the Weigh Price Labeller (if
- 43. In Production Screen on WPL If no orders are running the product is selected directly on
- 44. Individual Pack Records Individual pack records are received into the Innova Database for recording and reporting
- 45. Innova Portioning
- 46. Main purpose Controls and monitors your portioning operation in real-time Enables easy-to-use remote programming, control, real-time
- 47. Portioning control panel overview
- 48. Innova Order Management
- 49. Innova Orders & shipment Order management: Purchase orders to receive goods against PO’s Production orders for
- 50. Innova orders & shipment Packing to orders - gives real-time status of orders and reliable order
- 51. Order Control – By Orders
- 52. Order Control – By Status
- 53. Innova Inventory Control Raw material Intermediate stocks End-products Locations Stock takings/countings
- 54. Innova Final Goods Management
- 55. Palletizing/Order Picking/Dispatch Innova makes the delivery of the final goods, with all the necessary information Goods
- 56. Order Picking/Assign to Order & Assign to Shipment PDA Overview PDA - Order Tasks PDA -
- 57. Innova Inventory Control
- 58. Innova Inventory Control Raw material Intermediate stocks End-products Locations Stock takings/countings
- 59. Raw material inventory Raw material stock levels are known at all times Items can be assigned
- 60. Finished Goods Inventory Finished goods are moved into inventory or produced directly to stock during the
- 61. Innova Quality Control
- 62. INNOVA Weight Price Labeler Allocation Checkweigher Gain paperless control and automation of your quality control from
- 64. INNOVA Gain quality control at all levels. Receiving live birds Slaughtering Processing Packaging Dispatch Also …..
- 65. Innova QC – the benefits Paperless inspections All inspections can be done without paper using fixed
- 66. Innova QC – the benefits Easy access and analyses of data All records are available in
- 67. INNOVA Customize inspection lists Specifications for inspection items Support material for inspections Register the data you
- 68. Innova Quality Control - Input devices
- 69. Innova Quality Control – PDA inspections
- 70. Traceability
- 71. Documentation system Documentation repository Document viewers, desktop and M6000. Attaching and accessing documents on the floor
- 72. Innova Dashboarding & Reporting
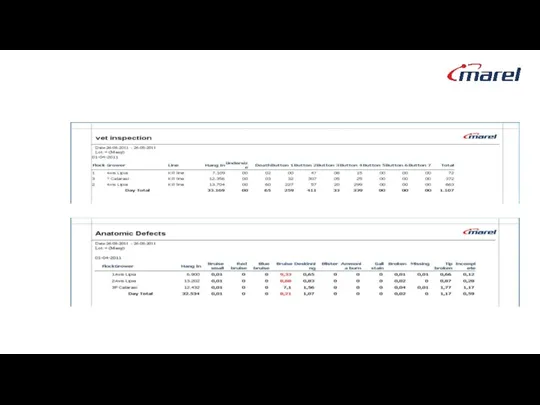
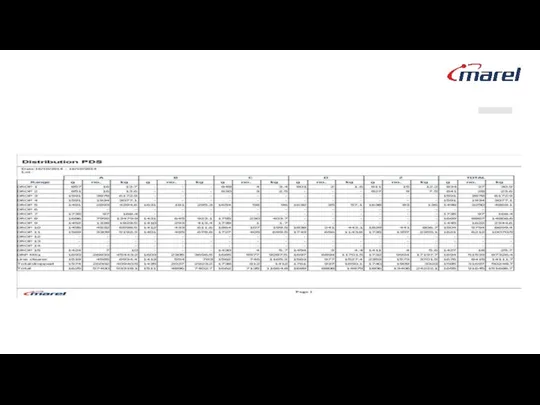
- 73. Reporting Examples
- 74. Dashboarding – Examples
- 75. IRIS Dashboarding/Real Time Monitoring
- 76. Innova Report designer Report surface Layout and formatting Toolbox Additions Explorer and fields list Selected item
- 77. Design mode
- 78. Innova Integration Services
- 79. Innova Integration Services Transfer product definition from an ERP system to Innova to ensure that a
- 80. Export Engine (Innova -> ERP) Configurable transfer of production data from Innova to ERP systems Exports
- 81. Import Engine (ERP -> Innova) Configurable transfer of master data from ERP systems to Innova Standard
- 82. Innova OEE
- 83. INNOVA How effectively are your production lines running? How many production stops do you have? Are
- 84. Potential production time Actual production time Availability loss Actual output Performance loss A-quality products Quality loss
- 85. Potential production time Actual production time Availability loss Actual output Performance loss A-quality products Quality loss
- 86. Overall Equipment Effectiveness X X Availability Performance Quality OEE is a general method for measuring the
- 87. Elements of OEE INNOVA Availability % = Actual Time / Potential time Availability is defined as
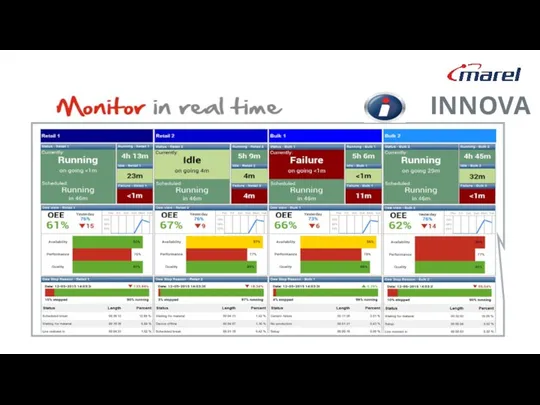
- 88. Improve Performance with Innova OEE Innova OEE will accurately calculate OEE figures, report on reasons for
- 89. Collection of reasons for shop floor stoppages Registers the reason when a stoppage occurs Does not
- 90. Innova OEE – Primary Processing OEE Primary Processing
- 91. INNOVA
- 92. Event status and stop reasons INNOVA
- 93. Fast and easy problem identification with a full report suite and analysis tool Quickly identify and
- 94. Track the effects of implemented process improvements and quickly spot whether they yield the expected outcome
- 95. Equipment monitoring - why and how? Maximise uptime! In case of downtime: reduce duration Uniform and
- 96. Equipment monitoring dashboard Level of attention: Yellow = attention, warning Orange = error Red = fatal
- 97. Actual alarms - LED plates
- 98. Actual alarms - PLC’s
- 99. Actual status equipment (eg ATC)
- 100. Actual status equipment (ATC: Dancer details)
- 101. Actual status equipment (ATC: Graph)
- 102. Actual status equipment (ATC: Select data for graph)
- 103. Overview history all alarms
- 104. All alarms grouped per module
- 105. Select columns you like to present
- 106. Report TOP 10 alarms
- 107. Report TOP all alarms
- 108. Export report to other programs
- 109. Manual infeed user comment
- 110. Equipment Monitoring Available for: GP CAS Transfers (TRDE-NT, TREC, TRCS, TR1G-NT) Chiller ATC CIP Department PLC’s
- 111. What do we measure? Availability
- 112. What do we measure? Quality Performance
- 113. OEE Example kill line
- 114. OEE – hang-in loss Hang-in loss per shift
- 115. OEE example ev line
- 116. OEE example – products on 1 leg in the shackle
- 117. OEE – event editor with scheduled breaks
- 118. OEE – giblet processing
- 119. Positioning OEE
- 120. The Benefits of OEE with Innova INNOVA
- 121. Innova Service Portfolio
- 122. Innova Service and Support Portfolio
- 123. Tabel of content Why Innova & PDS-NT Overview Innova Overview PDS-NT Equipment Monitoring Integration & customer
- 124. General introduction - What is PDS-NT PDS-NT: Product Distribution System – New Technology A plant-wide system
- 125. Positioning PDS-NT - Innova s
- 126. Data collection and control tools PDS-XL Floating Weight Control Recipe Control Combined Rate Limiting
- 127. Accurate and reliable data collectors Improved data for process optimization!
- 128. Data collection and control tools
- 129. PDS-NT – Standard modules PDS-NT: Logistic information system throughout the process PDS-NT Flock intake module PDS-NT
- 130. PDS-NT: Primary processing Flock switch - Traceability DOA pushbuttons Count products at several positions IRIS Camera
- 131. PDS-NT: PDS-XL Reliable shackle identification to follow individual products Minimize data loss in case of power-problems
- 132. PDS-XL information Individual flock histograms Position of flocks inside tunnel Average weight per 100 shackles Number
- 133. PDS-NT: Product distribution & portioning management Whole product distribution: Dropping in bins based on weight, quality
- 134. Recipe control (Pre-) define orders per processing step continuous batches Settings weight quality speed Priorities secure
- 135. Products physically divided over parallel lines, but the control system treats them as one combined group
- 136. No lightweight products in the line for heavyweight products and vice versa Approx. 30% of standard
- 137. Floating weight range making use of the ‘just as good’ 1730 1540 1420 1830 1520 1653
- 138. Control strategy Past Individual line control Raw material allocation Push: WB -> parts Manual adjustments to
- 144. PDS-NT in distribution line
- 145. Innova Traceability
- 146. Traceability in the supply chain Intake: link to farms – live birds Processing: tracking & tracing
- 147. Traceceability: Product in shackle - shackle identification table Shackle table
- 148. Traceability – Data forwarded to graders, packing scales, printers
- 150. “Build-In” Traceability Engine in INNOVA
- 151. Traceability in Innova - processes Same logic used if more than one supplier/vendor/flock is being used
- 152. Innova and PDS-NT - Benefits to our customers The ideal tool to increase added value by
- 153. Tabel of content Why Innova & PDS-NT Overview Innova Overview PDS-NT Equipment Monitoring Integration & customer
- 154. Equipment monitoring dashboard Maximal uptime! Uniform and clear real-time performance info Web based: available on every
- 155. Actual alarms
- 156. Actual status
- 157. Actual status equipment (ATC: Graph)
- 158. Equipment Monitoring - TOP 10 alarms
- 159. Tabel of content Why Innova & PDS-NT Overview Innova Overview PDS-NT Equipment Monitoring Integration & customer
- 160. How we cover the entire process Inbound Logistics Primary Processing Secondary Processing Outbound Logistics Order Picking
- 161. Innova – PDS-NT: integrated T&T New Innova application to define flock number for both Innova and
- 162. PDS-NT reporting in Innova
- 163. Label printing PDS-NT data – in development now
- 164. Robobatcher integration
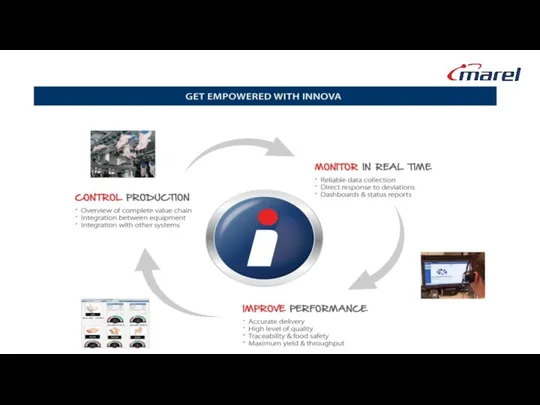
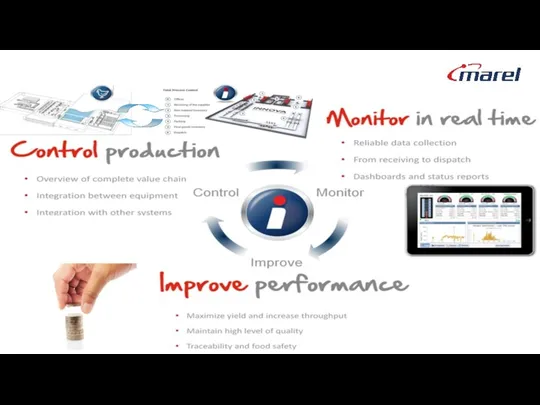
- 165. With Innova & PDS-NT you get… A tool to measure the health of your processes and
- 167. Скачать презентацию

Tabel of content
Why Innova & PDS-NT
Overview Innova
Overview PDS-NT
Equipment Monitoring
Integration & customer
Tabel of content
Why Innova & PDS-NT
Overview Innova
Overview PDS-NT
Equipment Monitoring
Integration & customer
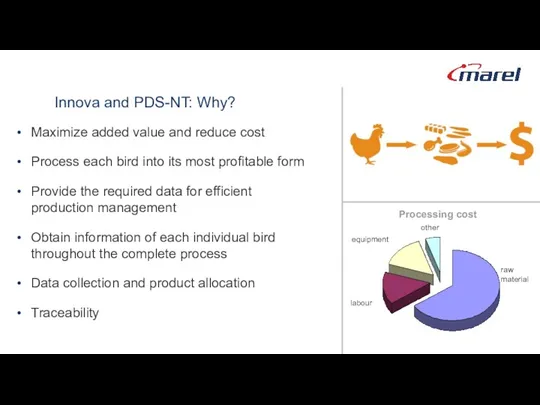
Innova and PDS-NT: Why?
Maximize added value and reduce cost
Process each bird
Innova and PDS-NT: Why?
Maximize added value and reduce cost
Process each bird
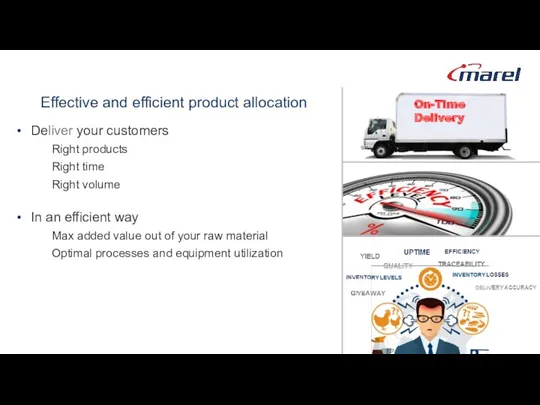
Effective and efficient product allocation
Deliver your customers
Right products
Right time
Right volume
In an
Effective and efficient product allocation
Deliver your customers
Right products
Right time
Right volume
In an
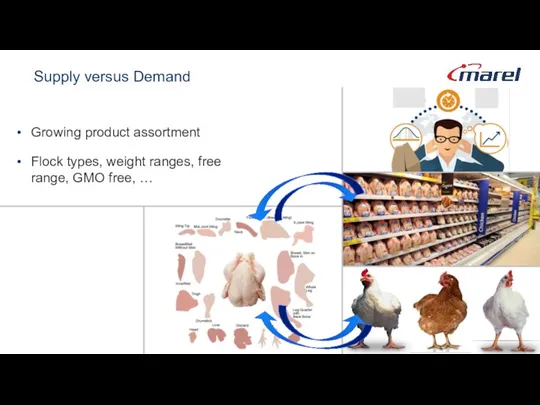
Supply versus Demand
Growing product assortment
Flock types, weight ranges, free range, GMO
Supply versus Demand
Growing product assortment
Flock types, weight ranges, free range, GMO
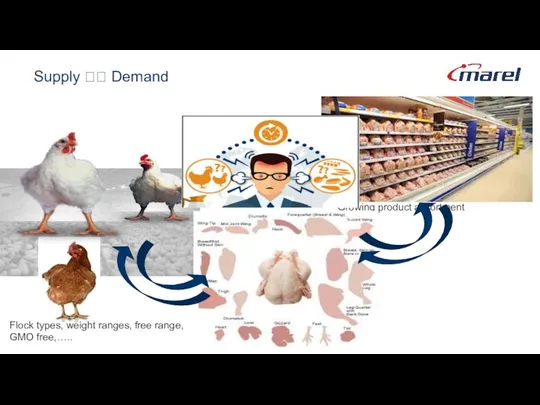
Supply ?? Demand
Supply ?? Demand
Tabel of content
Why Innova & PDS-NT
Overview Innova
Overview PDS-NT
Equipment Monitoring
Integration & customer
Tabel of content
Why Innova & PDS-NT
Overview Innova
Overview PDS-NT
Equipment Monitoring
Integration & customer
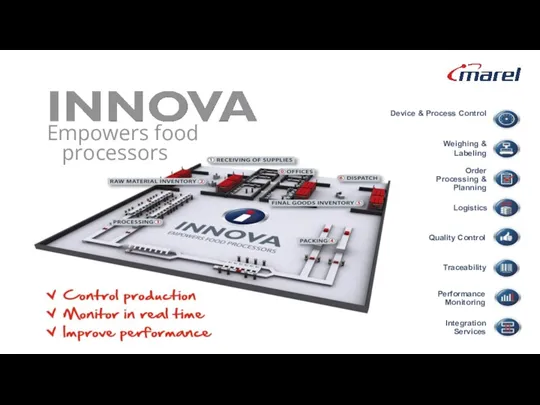
Empowers food processors
Device & Process Control
Weighing &
Labeling
Quality Control
Performance
Monitoring
Order
Processing &
Planning
Traceability
Integration
Services
Logistics
Empowers food processors
Device & Process Control
Weighing &
Labeling
Quality Control
Performance
Monitoring
Order
Processing &
Planning
Traceability
Integration
Services
Logistics
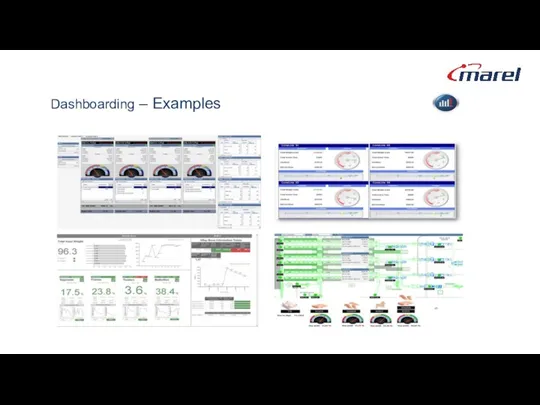
Dashboarding – Examples
Dashboarding – Examples
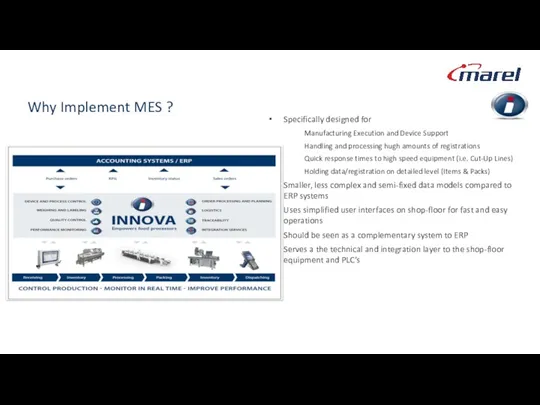
Why Implement MES ?
Specifically designed for
Manufacturing Execution and Device Support
Handling
Why Implement MES ?
Specifically designed for
Manufacturing Execution and Device Support
Handling
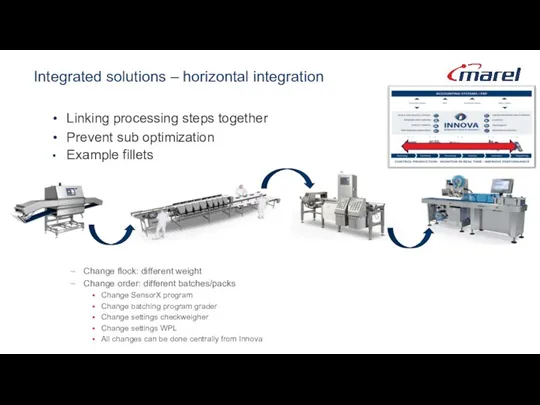
Integrated solutions – horizontal integration
Linking processing steps together
Prevent sub optimization
Integrated solutions – horizontal integration
Linking processing steps together
Prevent sub optimization
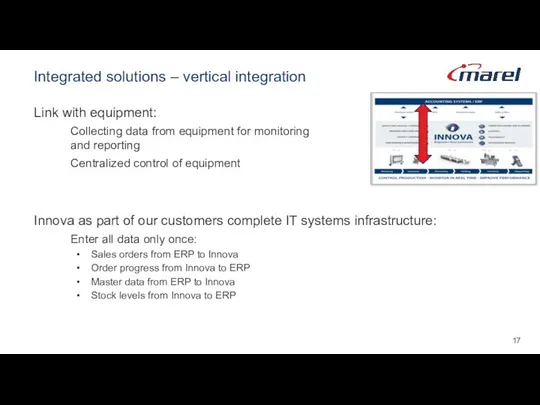
Integrated solutions – vertical integration
Link with equipment:
Collecting data from equipment for
Integrated solutions – vertical integration
Link with equipment:
Collecting data from equipment for
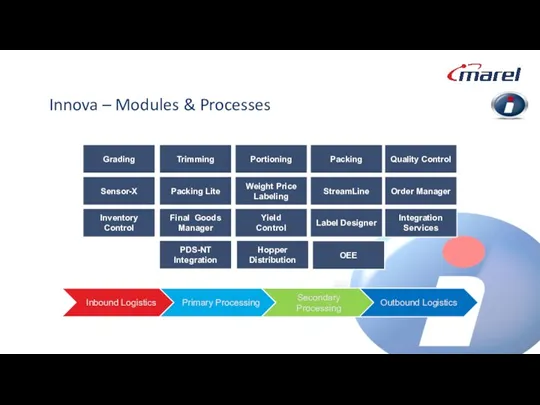
Innova – Modules & Processes
Grading
Sensor-X
Inventory Control
Trimming
Packing Lite
Final Goods Manager
Portioning
Weight Price Labeling
Yield
Innova – Modules & Processes
Grading
Sensor-X
Inventory Control
Trimming
Packing Lite
Final Goods Manager
Portioning
Weight Price Labeling
Yield
Innova base
Innova base
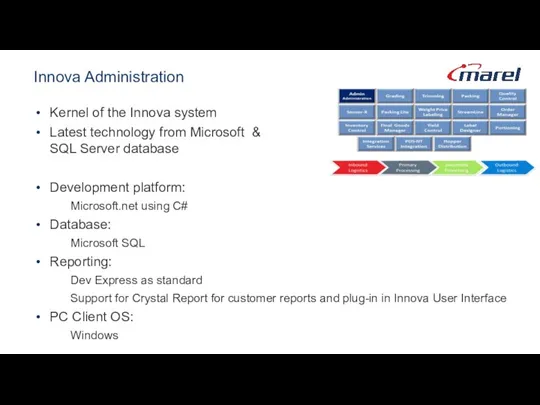
Innova Administration
Kernel of the Innova system
Latest technology from Microsoft &
SQL
Innova Administration
Kernel of the Innova system
Latest technology from Microsoft &
SQL
Innova Packing
Innova Packing
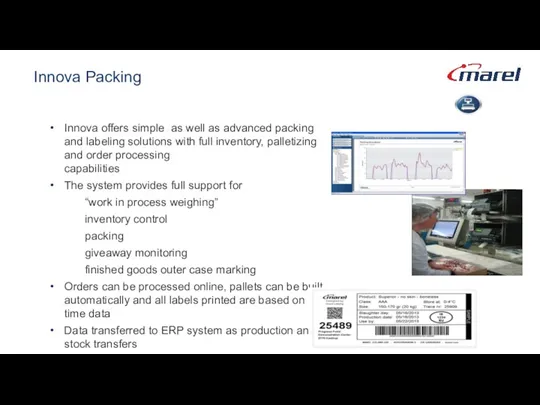
Innova Packing
Innova offers simple as well as advanced packing and labeling
Innova Packing
Innova offers simple as well as advanced packing and labeling
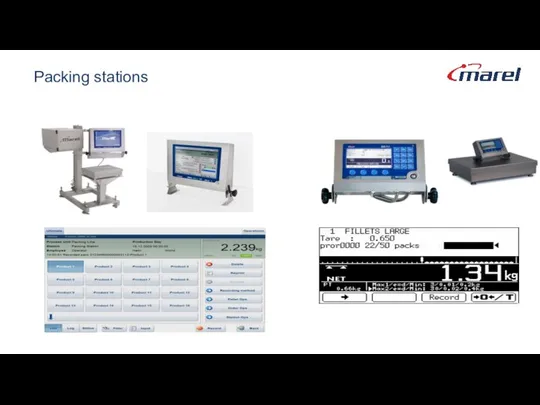
Packing stations
Packing stations
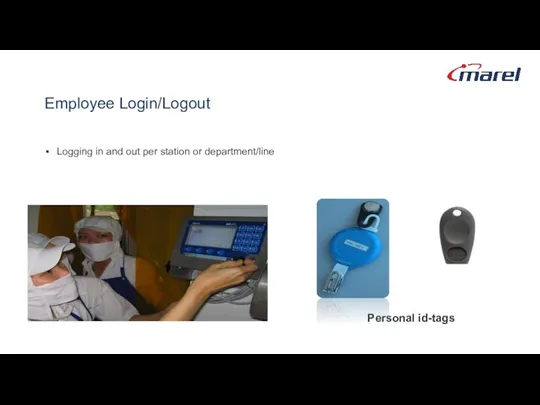
Personal id-tags
Logging in and out per station or department/line
Employee Login/Logout
Personal id-tags
Logging in and out per station or department/line
Employee Login/Logout
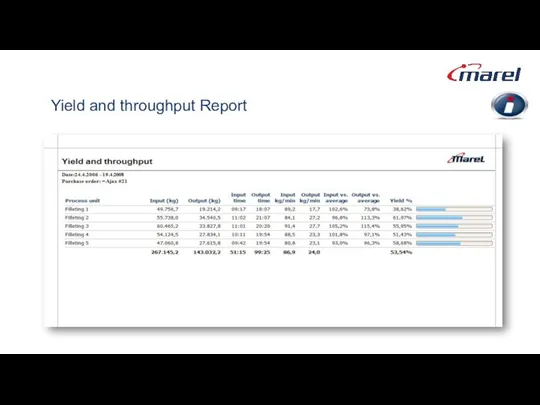
Yield and throughput Report
Yield and throughput Report
Innova Label management
Innova Label management
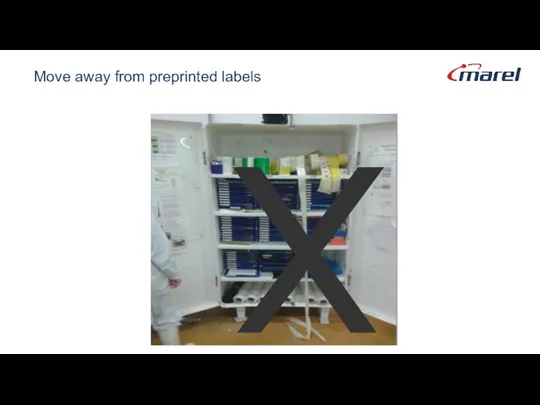
Move away from preprinted labels
X
Move away from preprinted labels
X
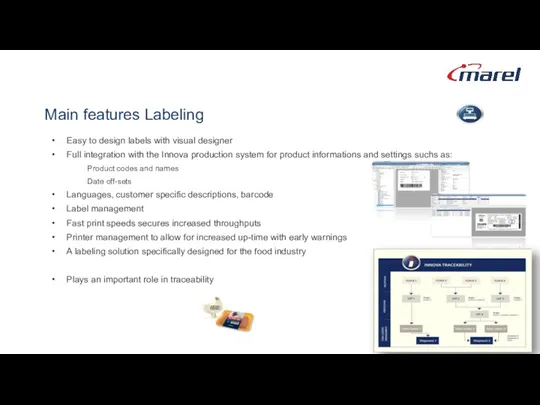
Main features Labeling
Easy to design labels with visual designer
Full integration with
Main features Labeling
Easy to design labels with visual designer
Full integration with
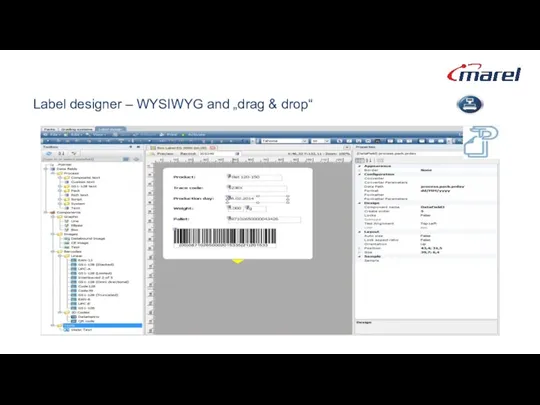
Label designer – WYSIWYG and „drag & drop“
Label designer – WYSIWYG and „drag & drop“
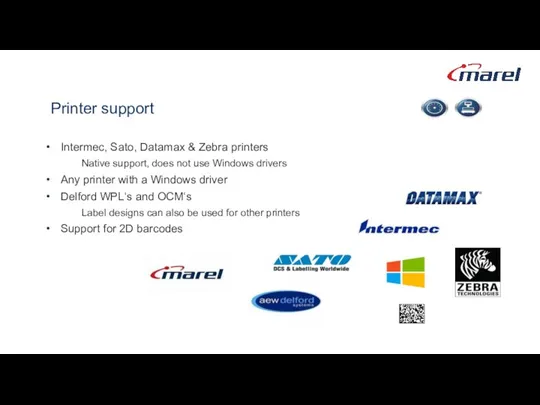
Printer support
Intermec, Sato, Datamax & Zebra printers
Native support, does not use
Printer support
Intermec, Sato, Datamax & Zebra printers
Native support, does not use
Innova Grading & Batching
Innova Grading & Batching
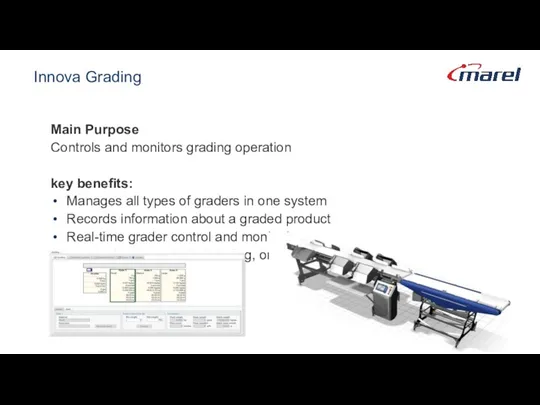
Innova Grading
Main Purpose
Controls and monitors grading operation
key benefits:
Manages all types
Innova Grading
Main Purpose
Controls and monitors grading operation
key benefits:
Manages all types
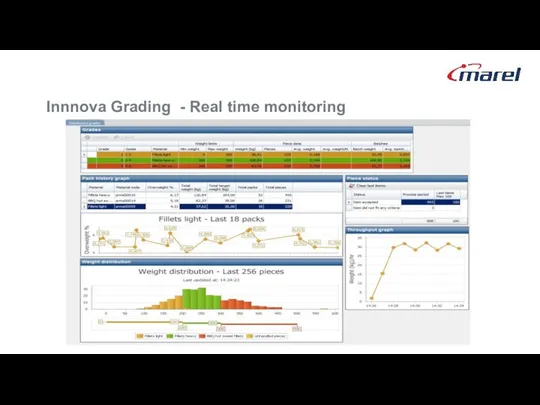
Innnova Grading - Real time monitoring
Innnova Grading - Real time monitoring
Innova Checkweighing
Innova Checkweighing
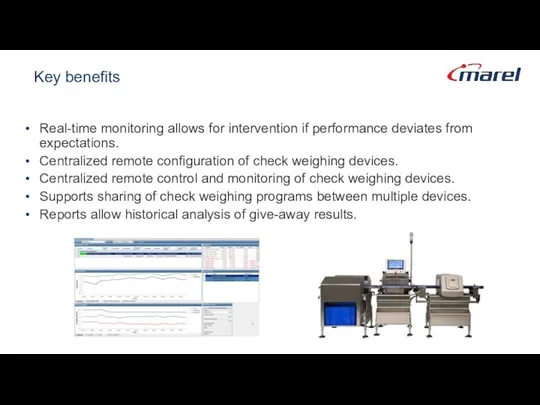
Key benefits
Real-time monitoring allows for intervention if performance deviates from
Key benefits
Real-time monitoring allows for intervention if performance deviates from
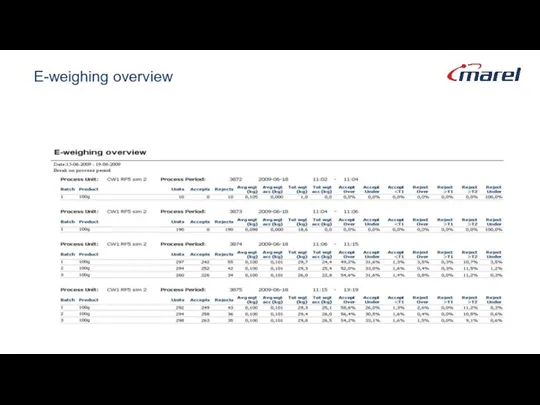
E-weighing overview
E-weighing overview
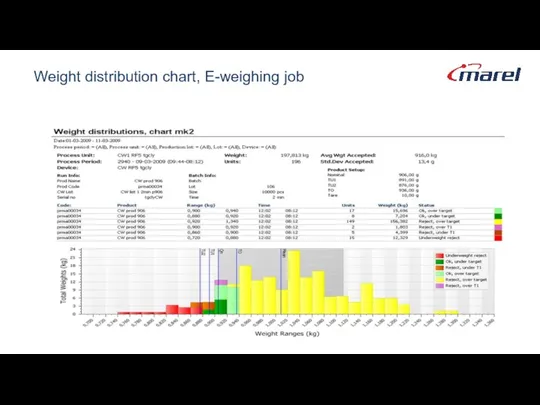
Weight distribution chart, E-weighing job
Weight distribution chart, E-weighing job

Innova
Weight Price Labeler
Innova
Weight Price Labeler
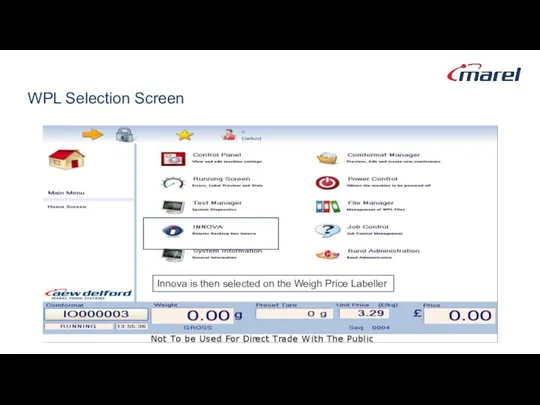
WPL Selection Screen
Innova is then selected on the Weigh Price Labeller
WPL Selection Screen
Innova is then selected on the Weigh Price Labeller
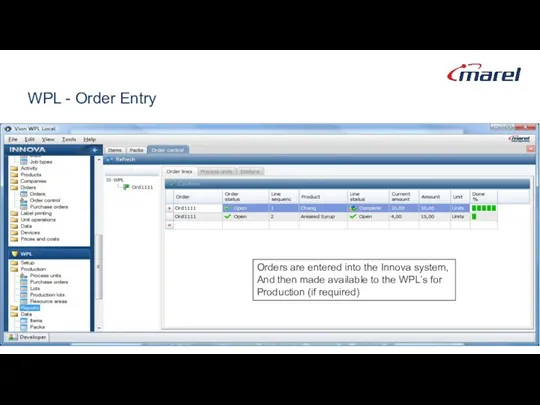
WPL - Order Entry
Orders are entered into the Innova system,
And then
WPL - Order Entry
Orders are entered into the Innova system,
And then
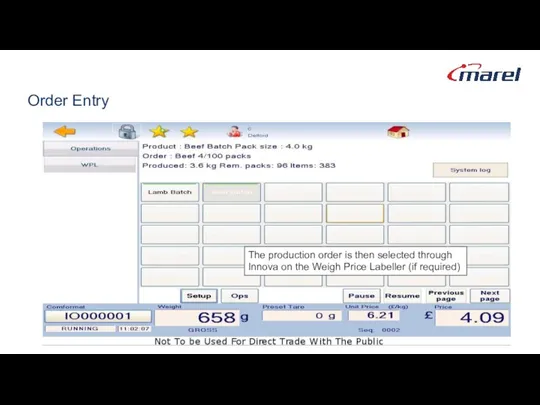
Order Entry
The production order is then selected through
Innova on the Weigh
Order Entry
The production order is then selected through
Innova on the Weigh
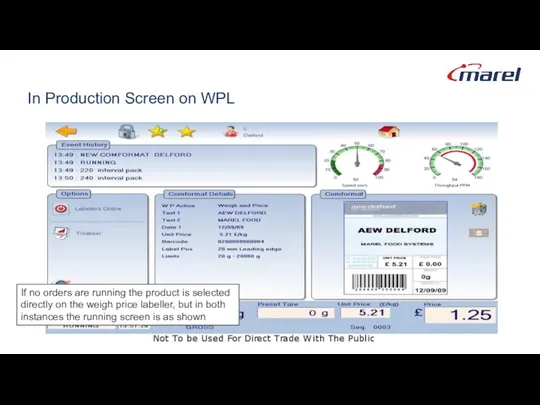
In Production Screen on WPL
If no orders are running the product
In Production Screen on WPL
If no orders are running the product
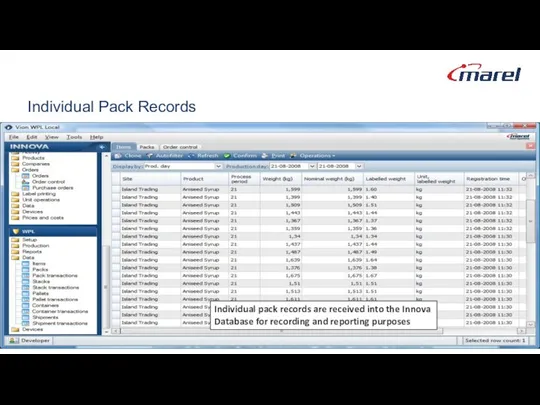
Individual Pack Records
Individual pack records are received into the Innova
Database for
Individual Pack Records
Individual pack records are received into the Innova
Database for

Innova Portioning
Innova Portioning
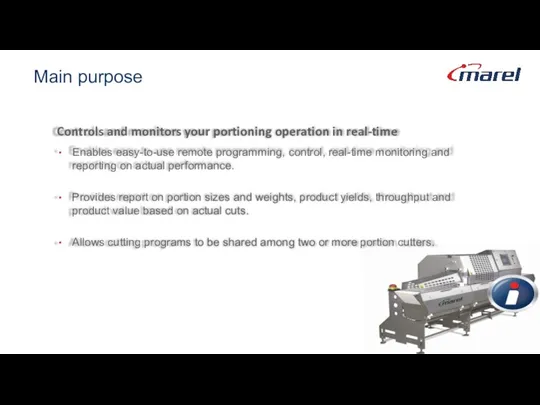
Main purpose
Controls and monitors your portioning operation in real-time
Enables easy-to-use remote
Main purpose
Controls and monitors your portioning operation in real-time
Enables easy-to-use remote
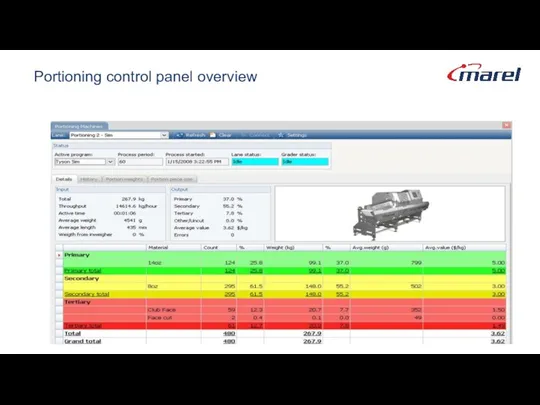
Portioning control panel overview
Portioning control panel overview

Innova
Order Management
Innova
Order Management
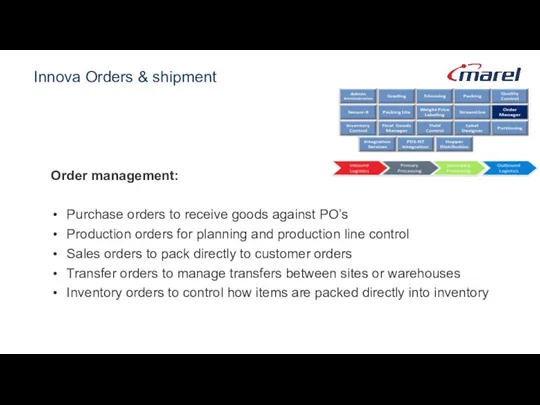
Innova Orders & shipment
Order management:
Purchase orders to receive goods against PO’s
Production
Innova Orders & shipment
Order management:
Purchase orders to receive goods against PO’s
Production
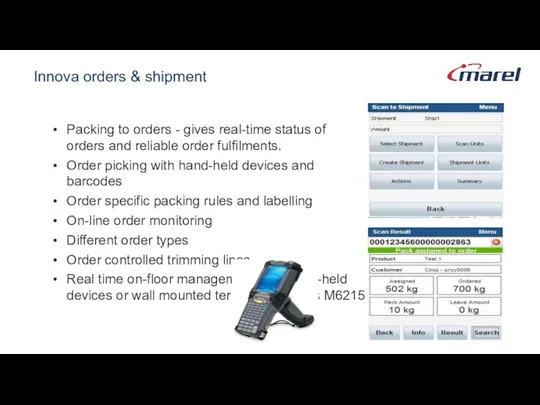
Innova orders & shipment
Packing to orders - gives real-time status of
Innova orders & shipment
Packing to orders - gives real-time status of
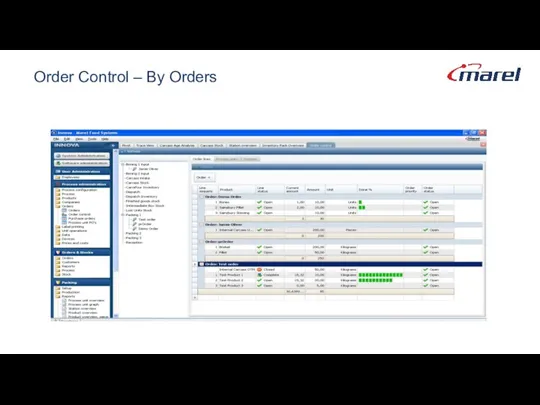
Order Control – By Orders
Order Control – By Orders
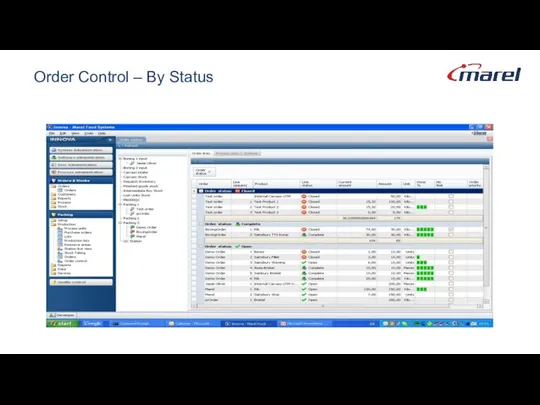
Order Control – By Status
Order Control – By Status
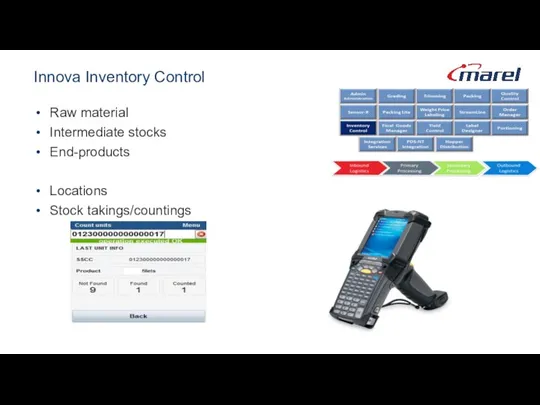
Innova Inventory Control
Raw material
Intermediate stocks
End-products
Locations
Stock takings/countings
Innova Inventory Control
Raw material
Intermediate stocks
End-products
Locations
Stock takings/countings

Innova Final Goods Management
Innova Final Goods Management
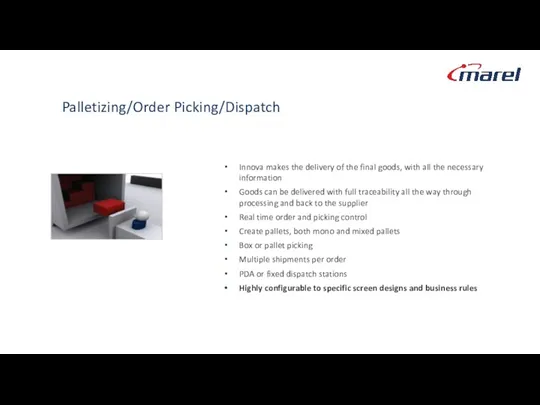
Palletizing/Order Picking/Dispatch
Innova makes the delivery of the final goods, with
Palletizing/Order Picking/Dispatch
Innova makes the delivery of the final goods, with
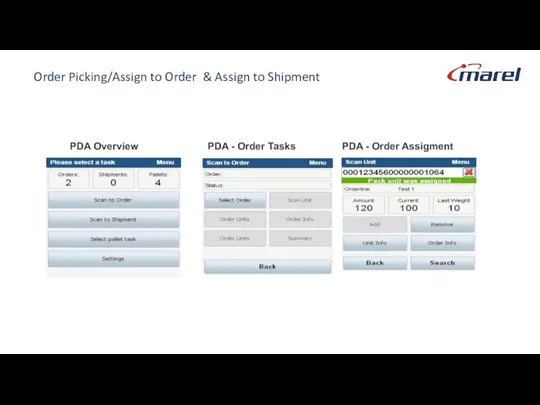
Order Picking/Assign to Order & Assign to Shipment
PDA Overview
PDA - Order
Order Picking/Assign to Order & Assign to Shipment
PDA Overview
PDA - Order

Innova
Inventory Control
Innova
Inventory Control
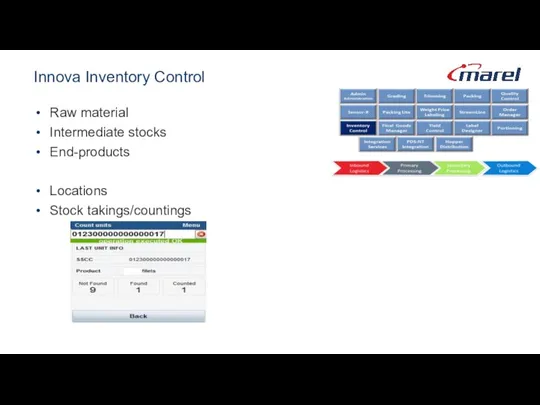
Innova Inventory Control
Raw material
Intermediate stocks
End-products
Locations
Stock takings/countings
Innova Inventory Control
Raw material
Intermediate stocks
End-products
Locations
Stock takings/countings
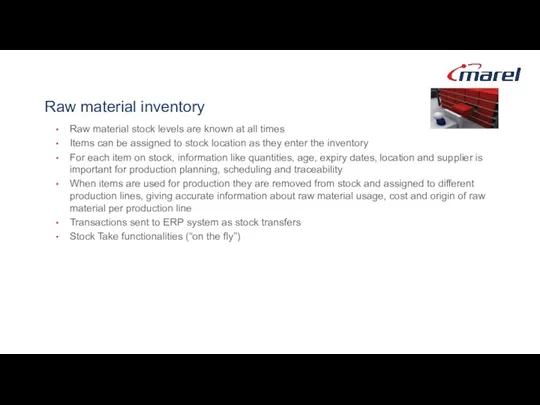
Raw material inventory
Raw material stock levels are known at all times
Items
Raw material inventory
Raw material stock levels are known at all times
Items
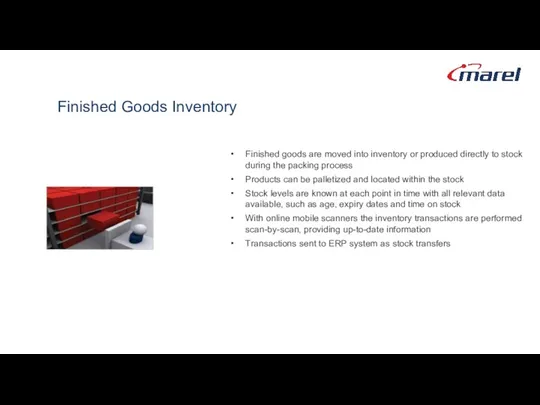
Finished Goods Inventory
Finished goods are moved into inventory or produced directly
Finished Goods Inventory
Finished goods are moved into inventory or produced directly
Innova
Quality Control
Innova
Quality Control
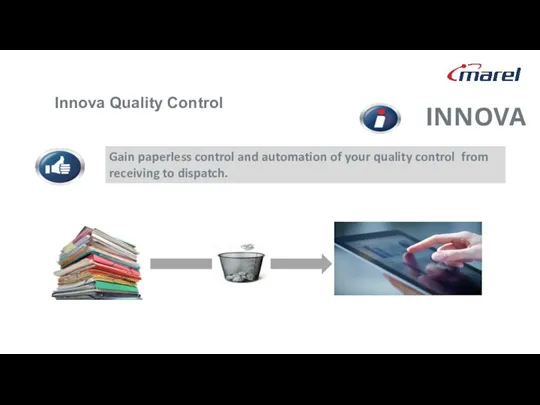
INNOVA
Weight Price Labeler
Allocation
Checkweigher
Gain paperless control and automation of your quality
INNOVA
Weight Price Labeler
Allocation
Checkweigher
Gain paperless control and automation of your quality
INNOVA
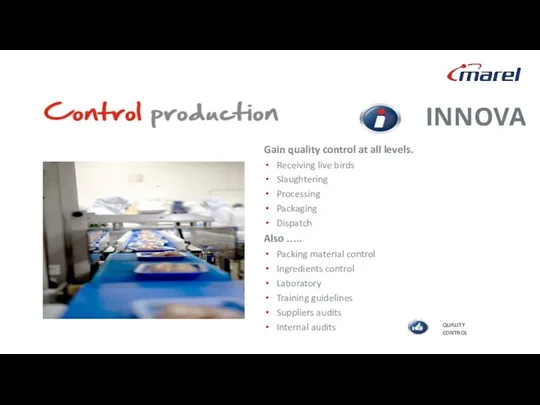
Gain quality control at all levels.
Receiving live birds
Slaughtering
Processing
Packaging
Dispatch
Also …..
Packing material control
Ingredients
INNOVA
Gain quality control at all levels.
Receiving live birds
Slaughtering
Processing
Packaging
Dispatch
Also …..
Packing material control
Ingredients
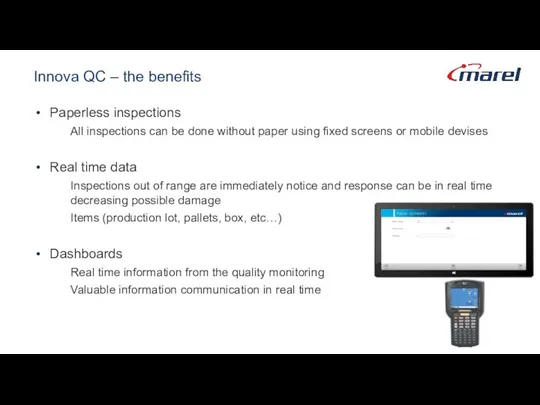
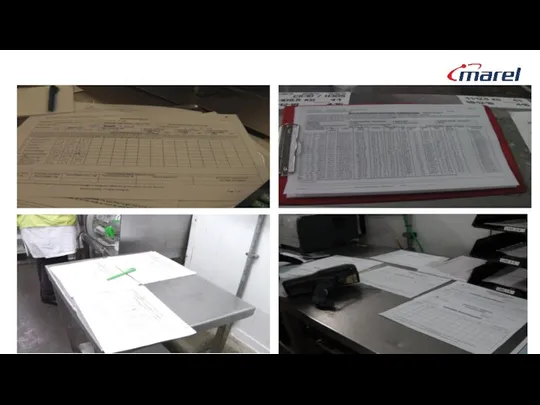
Innova QC – the benefits
Paperless inspections
All inspections can be done
Innova QC – the benefits
Paperless inspections
All inspections can be done
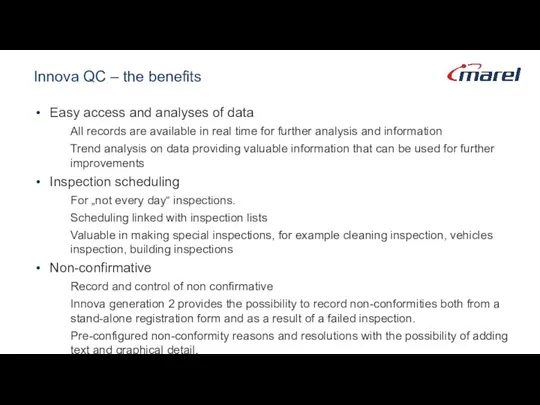
Innova QC – the benefits
Easy access and analyses of data
All records
Innova QC – the benefits
Easy access and analyses of data
All records
INNOVA
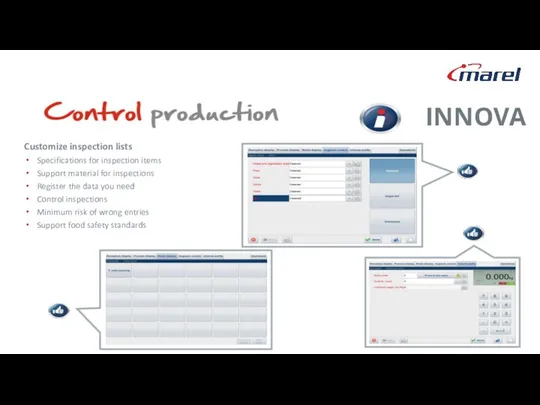
Customize inspection lists
Specifications for inspection items
Support material for inspections
Register the
INNOVA
Customize inspection lists
Specifications for inspection items
Support material for inspections
Register the
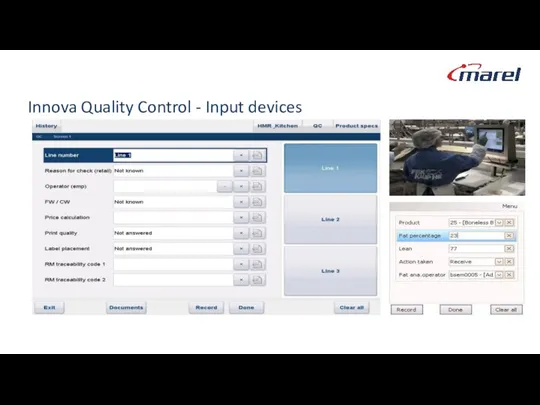
Innova Quality Control - Input devices
Innova Quality Control - Input devices
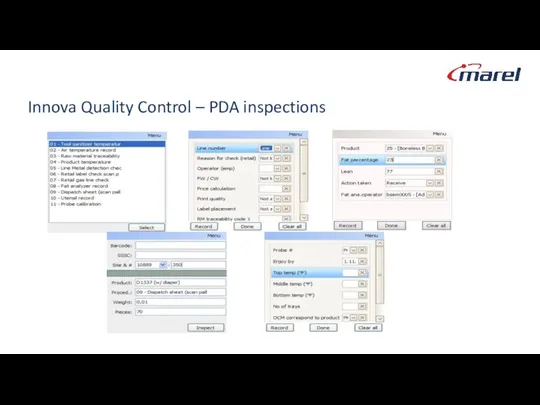
Innova Quality Control – PDA inspections
Innova Quality Control – PDA inspections
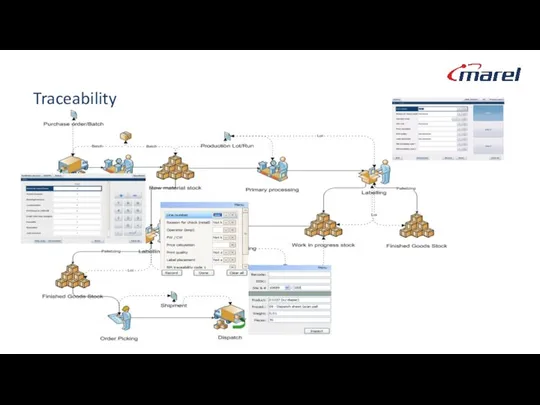
Traceability
Traceability
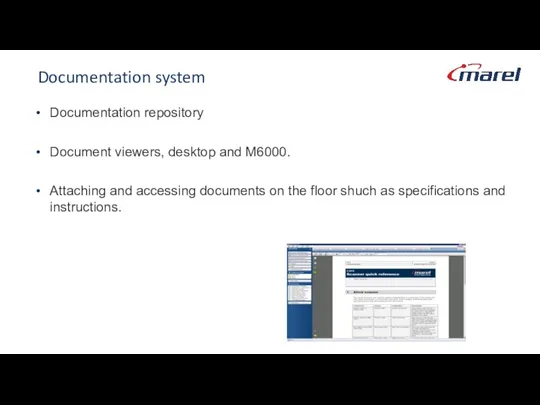
Documentation system
Documentation repository
Document viewers, desktop and M6000.
Attaching and accessing documents on
Documentation system
Documentation repository
Document viewers, desktop and M6000.
Attaching and accessing documents on

Innova
Dashboarding & Reporting
Innova
Dashboarding & Reporting
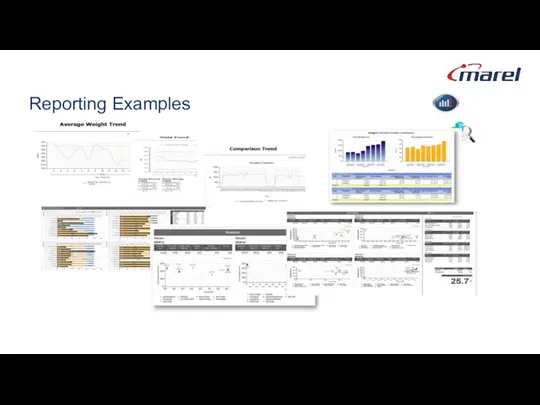
Reporting Examples
Reporting Examples
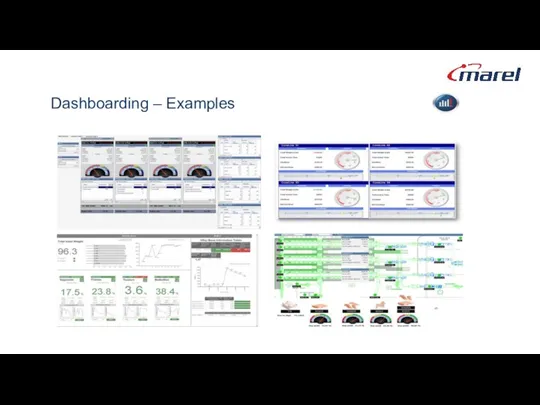
Dashboarding – Examples
Dashboarding – Examples
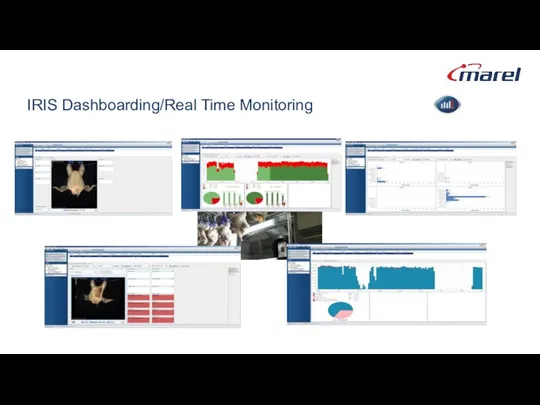
IRIS Dashboarding/Real Time Monitoring
IRIS Dashboarding/Real Time Monitoring
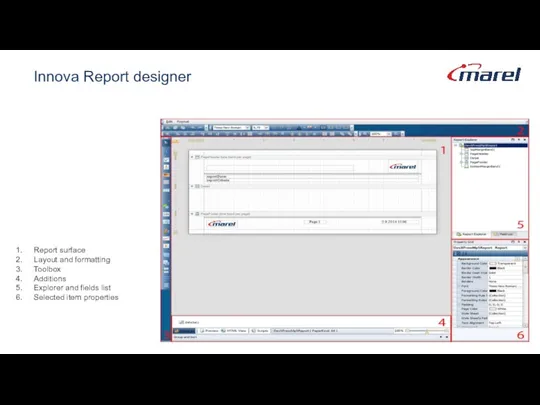
Innova Report designer
Report surface
Layout and formatting
Toolbox
Additions
Explorer and fields list
Selected item properties
Innova Report designer
Report surface
Layout and formatting
Toolbox
Additions
Explorer and fields list
Selected item properties
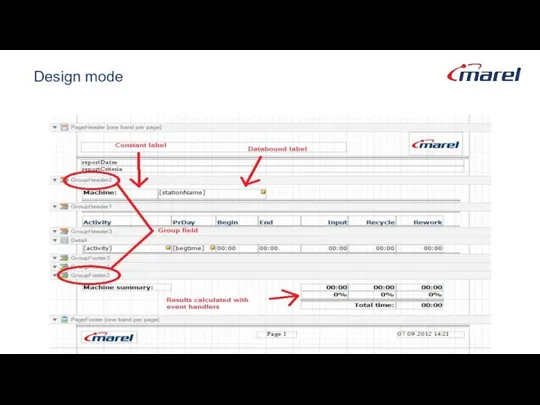
Design mode
Design mode
Innova
Integration Services
Innova
Integration Services
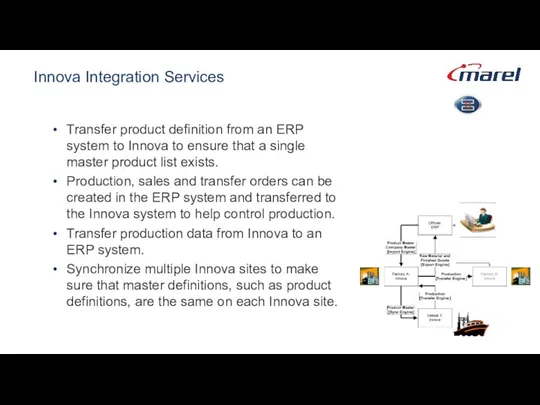
Innova Integration Services
Transfer product definition from an ERP system to Innova
Innova Integration Services
Transfer product definition from an ERP system to Innova
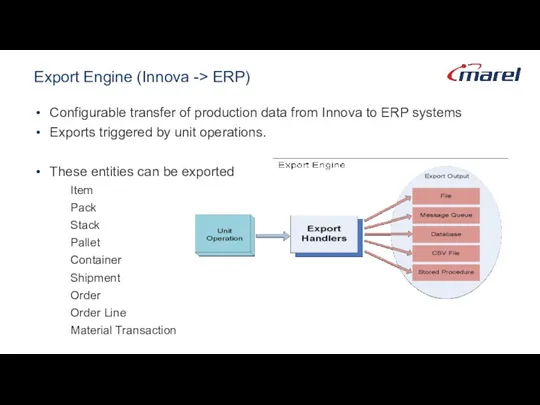
Export Engine (Innova -> ERP)
Configurable transfer of production data from Innova
Export Engine (Innova -> ERP)
Configurable transfer of production data from Innova
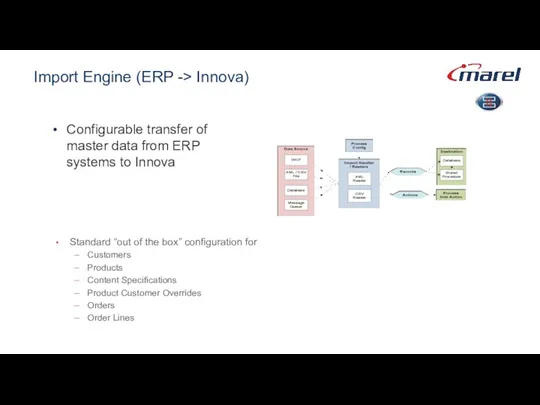
Import Engine (ERP -> Innova)
Configurable transfer of master data from ERP
Import Engine (ERP -> Innova)
Configurable transfer of master data from ERP

Innova OEE
Innova OEE
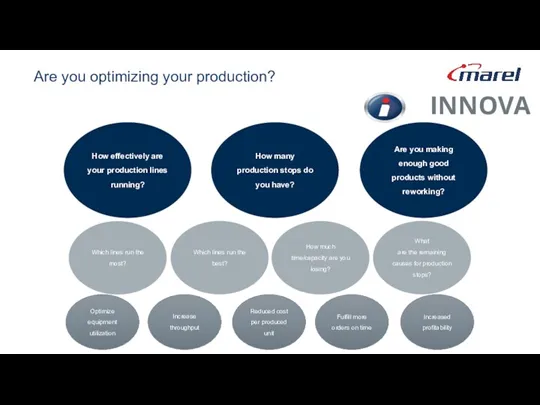
INNOVA
How effectively are your production lines running?
How many production stops do
INNOVA
How effectively are your production lines running?
How many production stops do
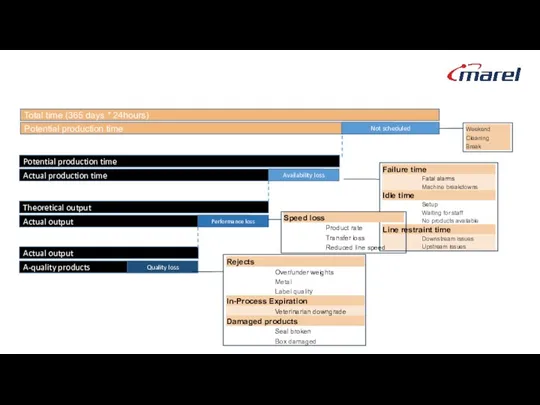
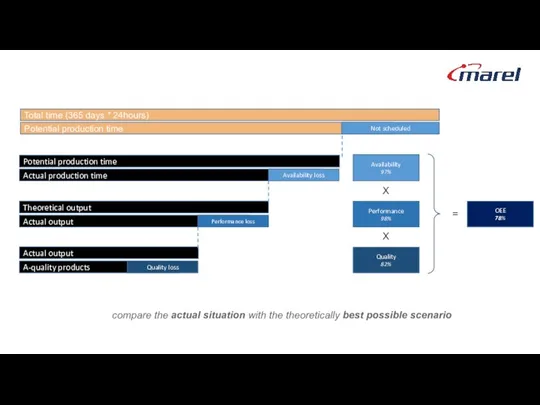
Potential production time
Actual production time
Availability loss
Actual output
Performance loss
A-quality products
Quality loss
Theoretical output
Actual
Potential production time
Actual production time
Availability loss
Actual output
Performance loss
A-quality products
Quality loss
Theoretical output
Actual
Potential production time
Actual production time
Availability loss
Actual output
Performance loss
A-quality products
Quality loss
Theoretical output
Actual
Potential production time
Actual production time
Availability loss
Actual output
Performance loss
A-quality products
Quality loss
Theoretical output
Actual
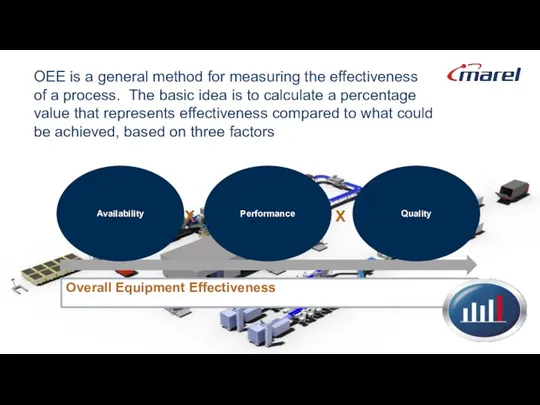
Overall Equipment Effectiveness
X
X
Availability
Performance
Quality
OEE is a general method for measuring the effectiveness
Overall Equipment Effectiveness
X
X
Availability
Performance
Quality
OEE is a general method for measuring the effectiveness
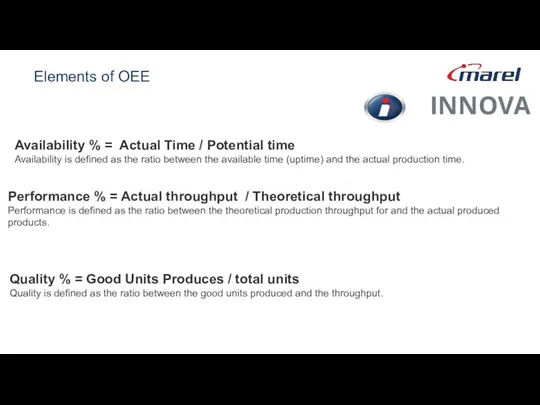
Elements of OEE
INNOVA
Availability % = Actual Time / Potential time
Availability is defined
Elements of OEE
INNOVA
Availability % = Actual Time / Potential time
Availability is defined
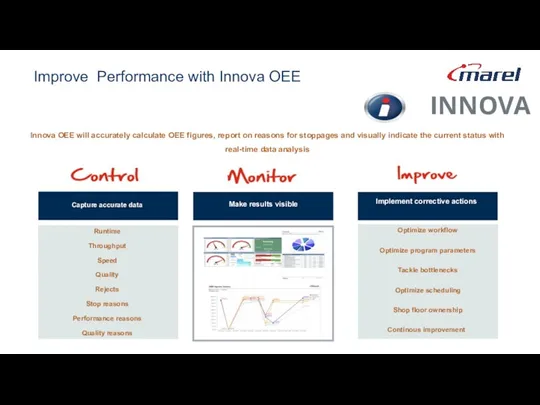
Improve Performance with Innova OEE
Innova OEE will accurately calculate OEE figures,
Improve Performance with Innova OEE
Innova OEE will accurately calculate OEE figures,
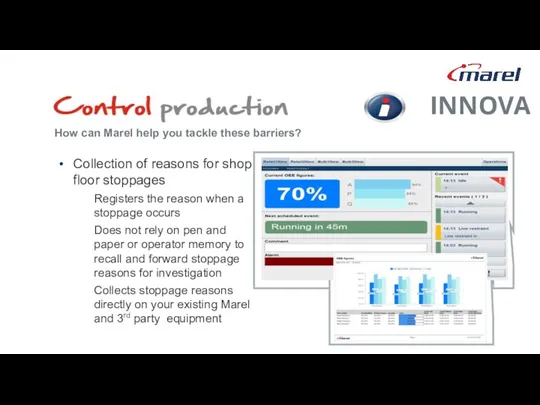
Collection of reasons for shop floor stoppages
Registers the reason when a
Collection of reasons for shop floor stoppages
Registers the reason when a
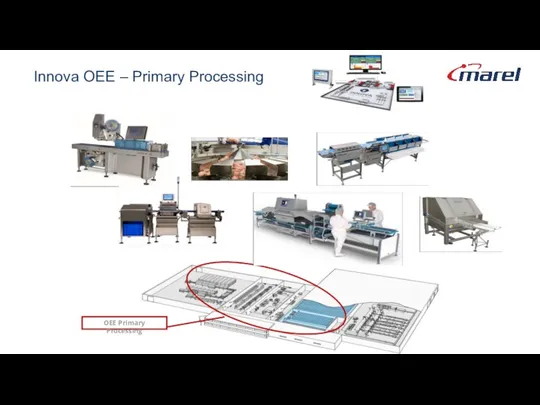
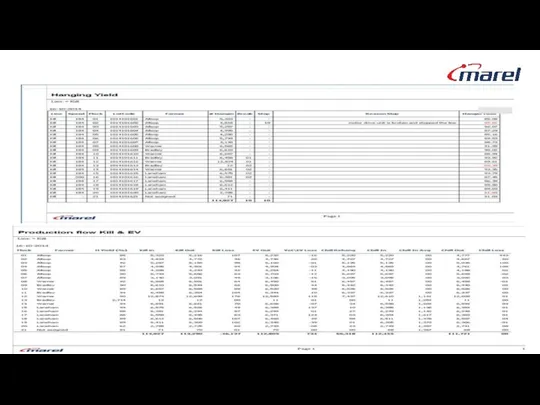
Innova OEE – Primary Processing
OEE Primary Processing
Innova OEE – Primary Processing
OEE Primary Processing
INNOVA
INNOVA
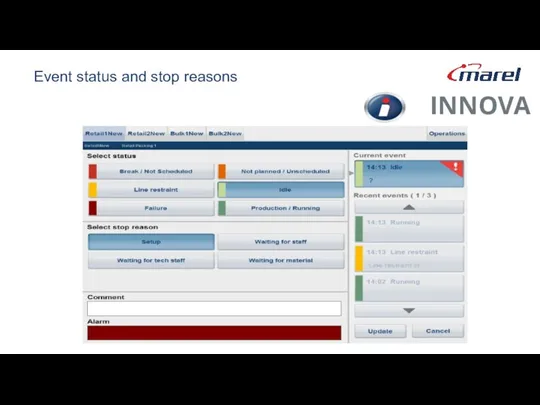
Event status and stop reasons
INNOVA
Event status and stop reasons
INNOVA
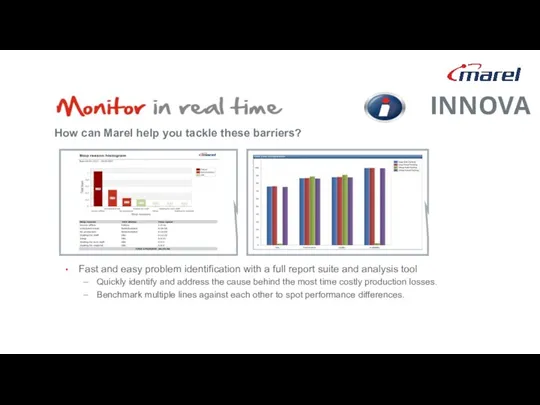
Fast and easy problem identification with a full report suite and
Fast and easy problem identification with a full report suite and
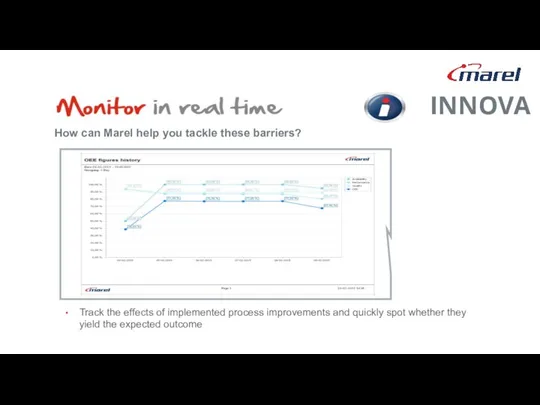
Track the effects of implemented process improvements and quickly spot whether
Track the effects of implemented process improvements and quickly spot whether
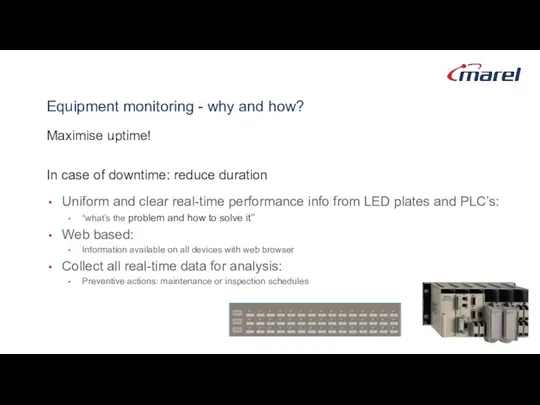
Equipment monitoring - why and how?
Maximise uptime!
In case of downtime: reduce
Equipment monitoring - why and how?
Maximise uptime!
In case of downtime: reduce
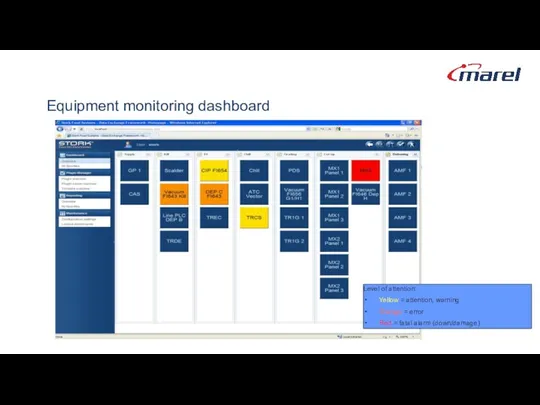
Equipment monitoring dashboard
Level of attention:
Yellow = attention, warning
Orange = error
Red =
Equipment monitoring dashboard
Level of attention:
Yellow = attention, warning
Orange = error
Red =
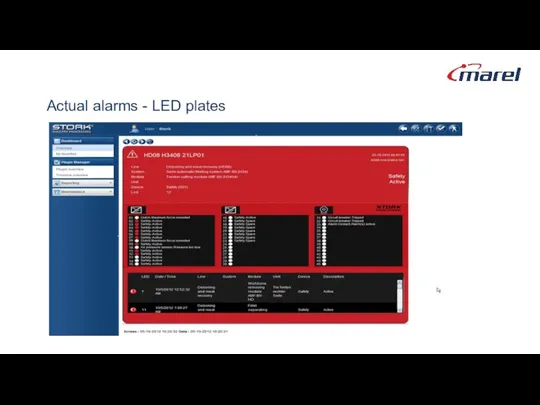
Actual alarms - LED plates
Actual alarms - LED plates
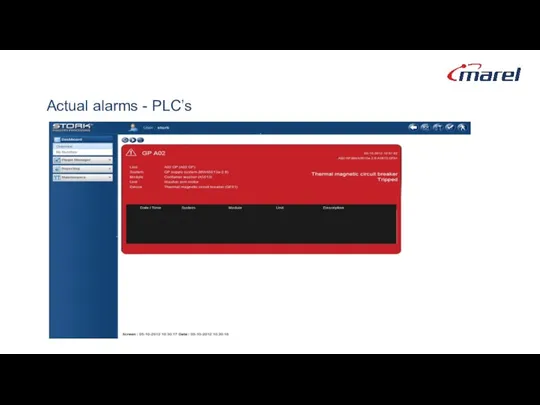
Actual alarms - PLC’s
Actual alarms - PLC’s
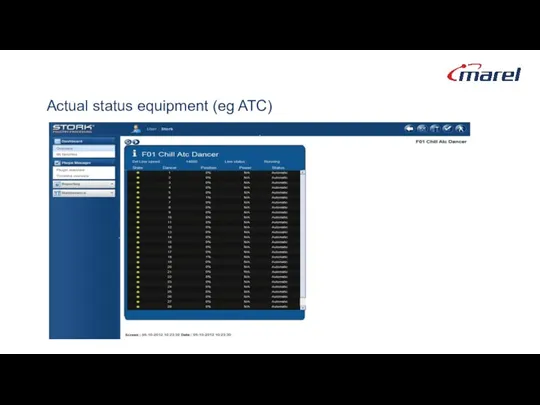
Actual status equipment (eg ATC)
Actual status equipment (eg ATC)
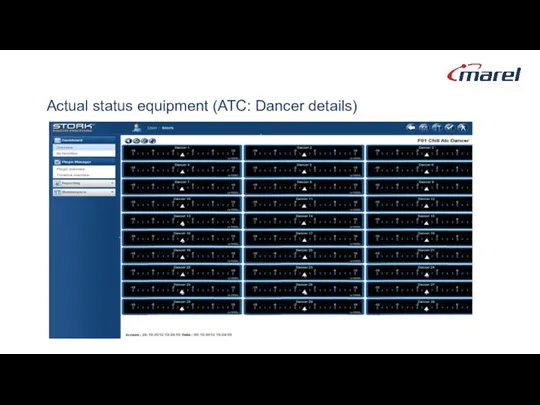
Actual status equipment (ATC: Dancer details)
Actual status equipment (ATC: Dancer details)
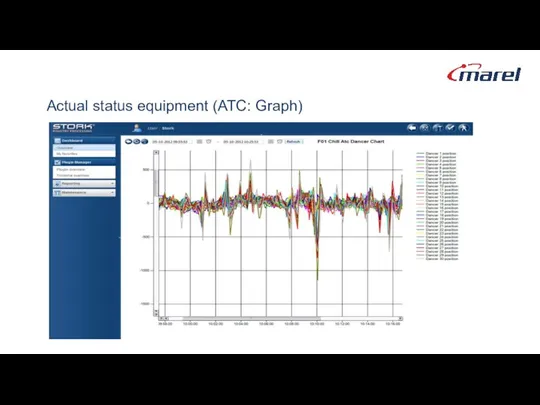
Actual status equipment (ATC: Graph)
Actual status equipment (ATC: Graph)
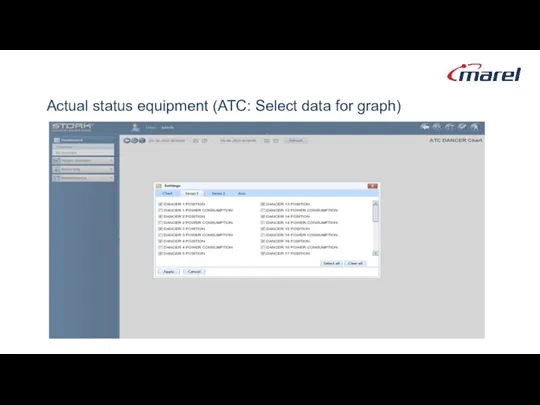
Actual status equipment (ATC: Select data for graph)
Actual status equipment (ATC: Select data for graph)
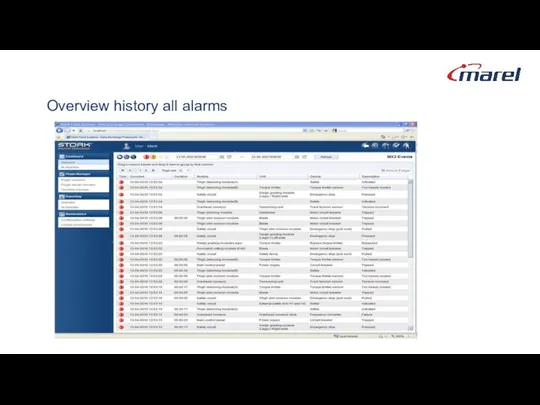
Overview history all alarms
Overview history all alarms
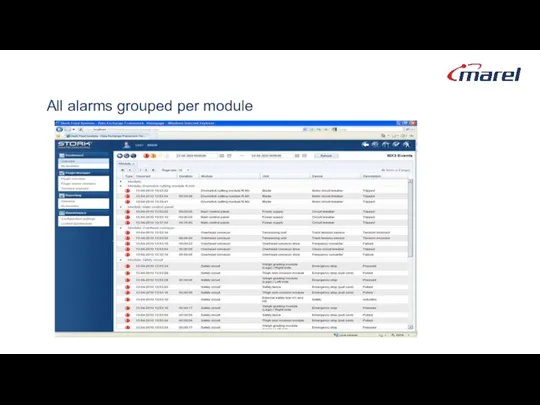
All alarms grouped per module
All alarms grouped per module
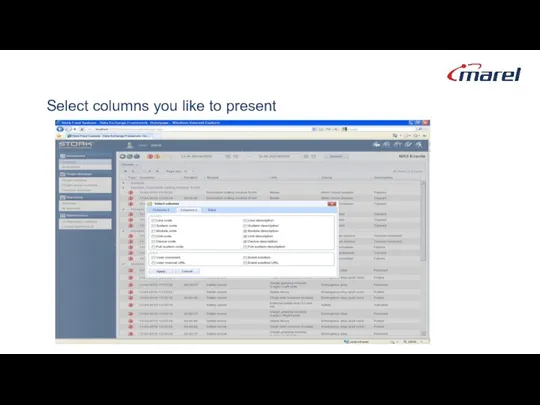
Select columns you like to present
Select columns you like to present
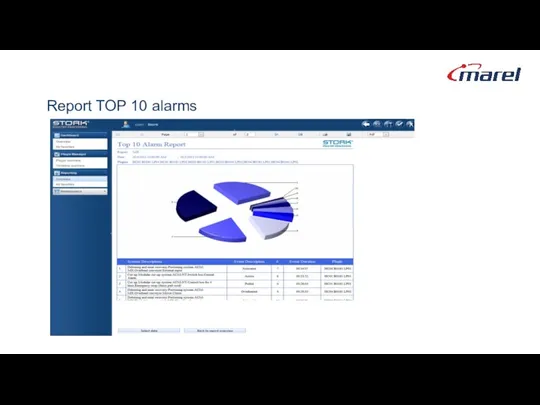
Report TOP 10 alarms
Report TOP 10 alarms
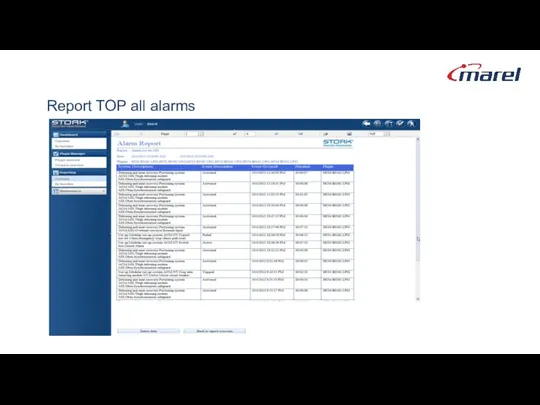
Report TOP all alarms
Report TOP all alarms
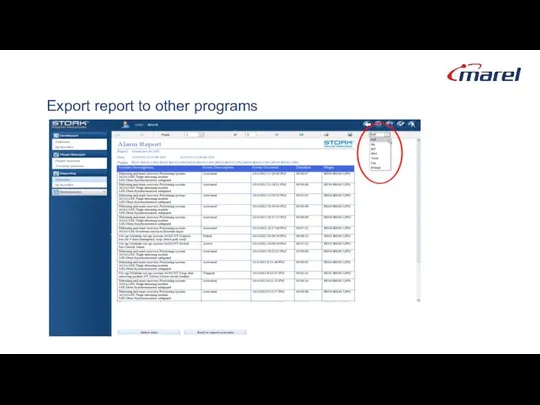
Export report to other programs
Export report to other programs
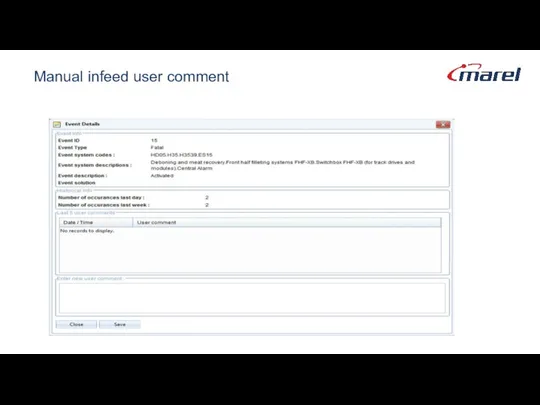
Manual infeed user comment
Manual infeed user comment
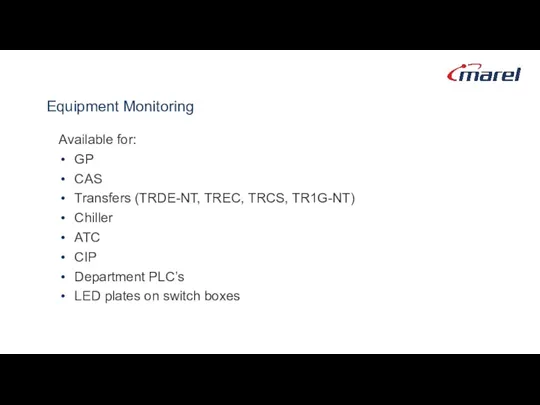
Equipment Monitoring
Available for:
GP
CAS
Transfers (TRDE-NT, TREC, TRCS, TR1G-NT)
Chiller
ATC
CIP
Department PLC’s
LED plates on switch
Equipment Monitoring
Available for:
GP
CAS
Transfers (TRDE-NT, TREC, TRCS, TR1G-NT)
Chiller
ATC
CIP
Department PLC’s
LED plates on switch
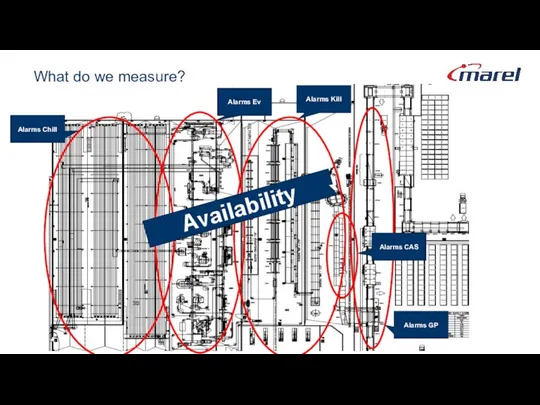
What do we measure?
Availability
What do we measure?
Availability
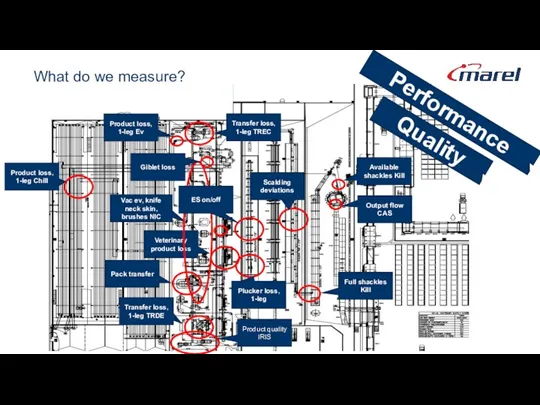
What do we measure?
Quality
Performance
What do we measure?
Quality
Performance
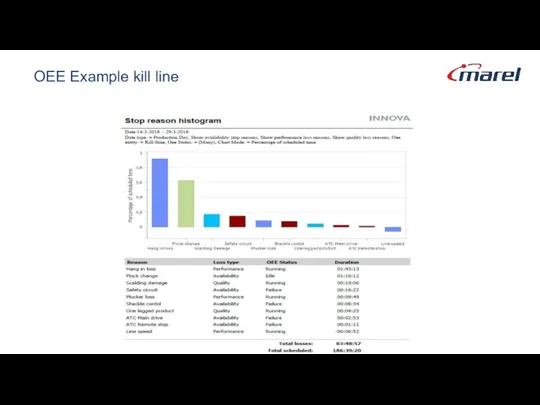
OEE Example kill line
OEE Example kill line
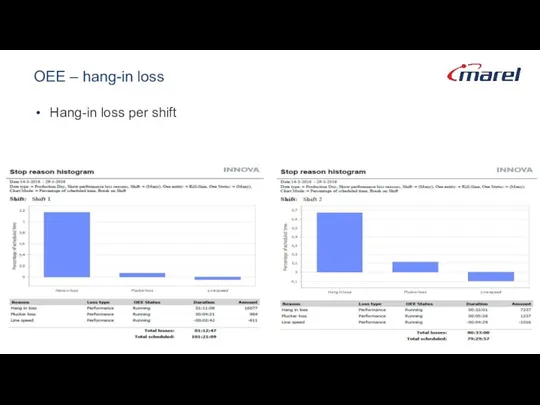
OEE – hang-in loss
Hang-in loss per shift
OEE – hang-in loss
Hang-in loss per shift
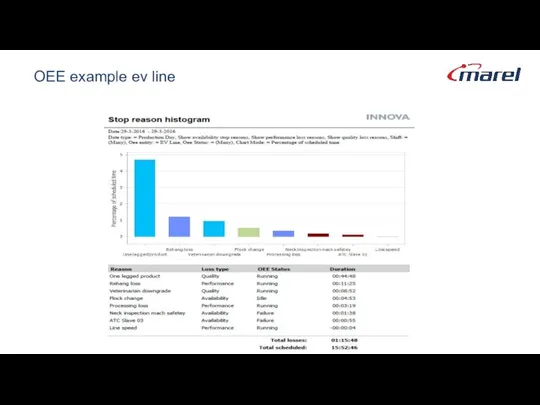
OEE example ev line
OEE example ev line
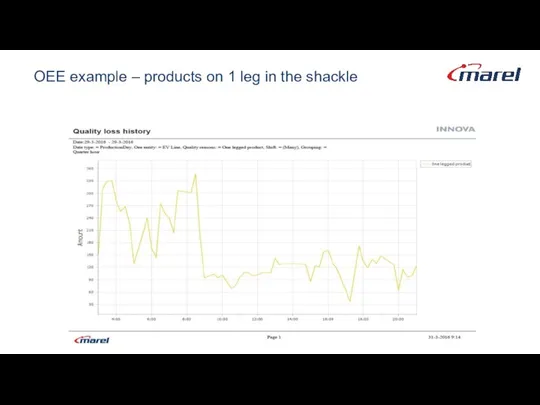
OEE example – products on 1 leg in the shackle
OEE example – products on 1 leg in the shackle
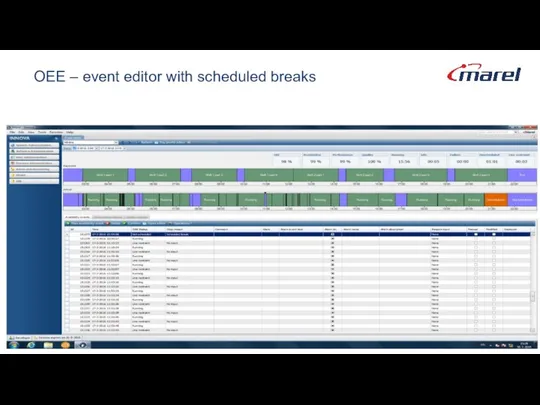
OEE – event editor with scheduled breaks
OEE – event editor with scheduled breaks
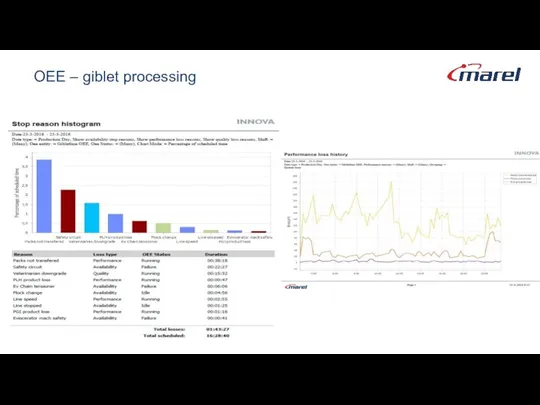
OEE – giblet processing
OEE – giblet processing
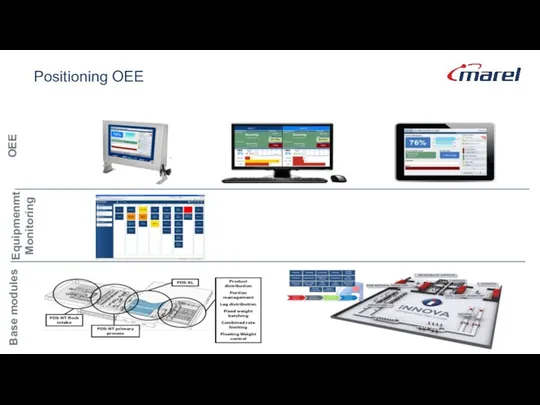
Positioning OEE
Positioning OEE
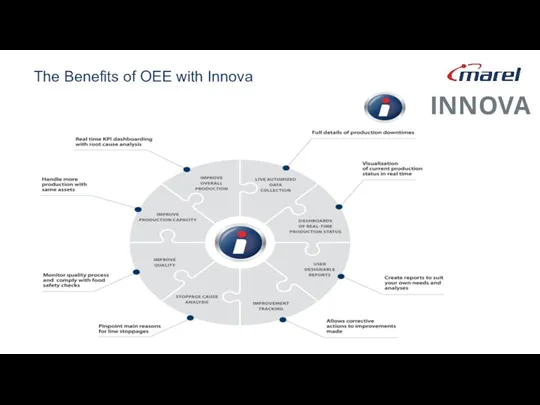
The Benefits of OEE with Innova
INNOVA
The Benefits of OEE with Innova
INNOVA
Innova
Service Portfolio
Innova
Service Portfolio
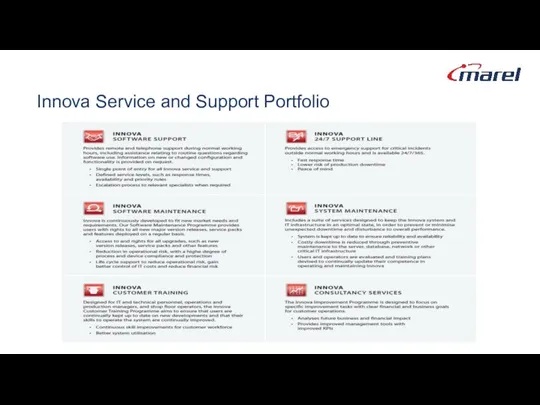
Innova Service and Support Portfolio
Innova Service and Support Portfolio
Tabel of content
Why Innova & PDS-NT
Overview Innova
Overview PDS-NT
Equipment Monitoring
Integration & customer
Tabel of content
Why Innova & PDS-NT
Overview Innova
Overview PDS-NT
Equipment Monitoring
Integration & customer
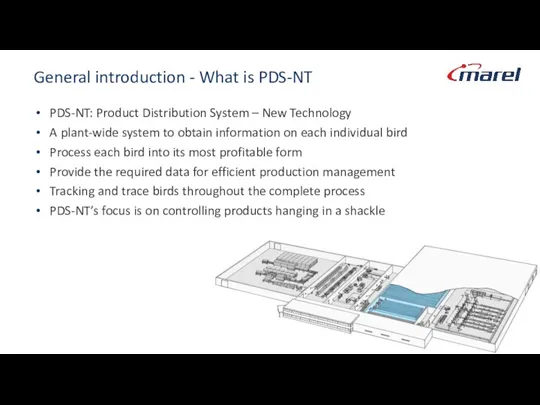
General introduction - What is PDS-NT
PDS-NT: Product Distribution System – New
General introduction - What is PDS-NT
PDS-NT: Product Distribution System – New
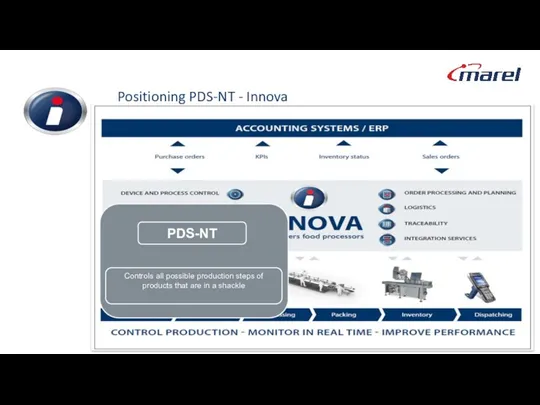
Positioning PDS-NT - Innova
s
Positioning PDS-NT - Innova
s
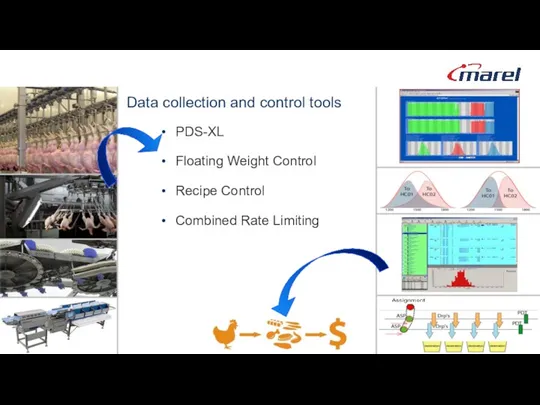
Data collection and control tools
PDS-XL
Floating Weight Control
Recipe Control
Combined Rate Limiting
Data collection and control tools
PDS-XL
Floating Weight Control
Recipe Control
Combined Rate Limiting
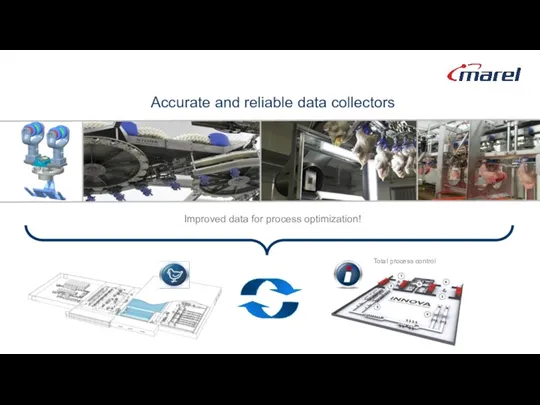
Accurate and reliable data collectors
Improved data for process optimization!
Accurate and reliable data collectors
Improved data for process optimization!
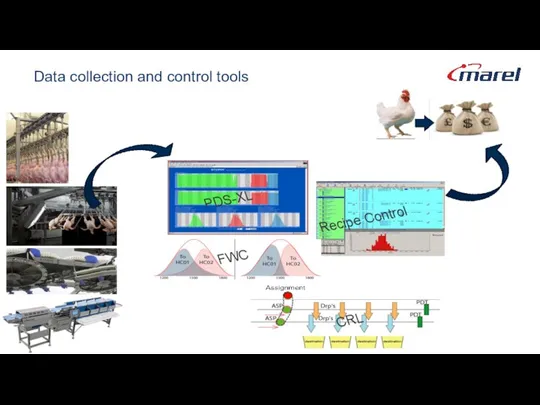
Data collection and control tools
Data collection and control tools
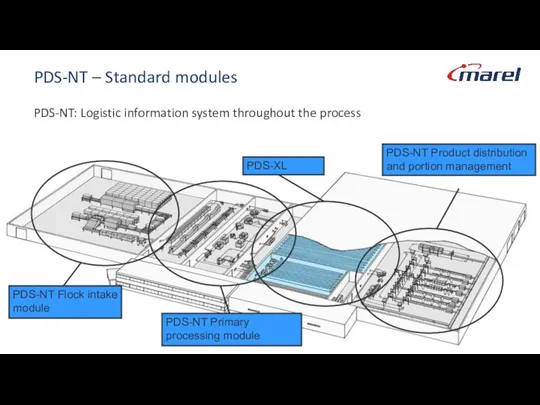
PDS-NT – Standard modules
PDS-NT: Logistic information system throughout the process
PDS-NT Flock
PDS-NT – Standard modules
PDS-NT: Logistic information system throughout the process
PDS-NT Flock
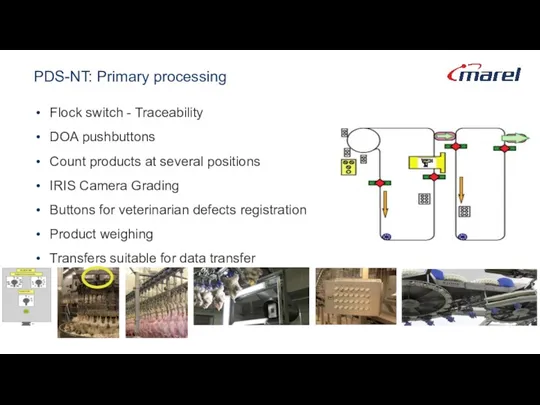
PDS-NT: Primary processing
Flock switch - Traceability
DOA pushbuttons
Count products at several positions
IRIS
PDS-NT: Primary processing
Flock switch - Traceability
DOA pushbuttons
Count products at several positions
IRIS
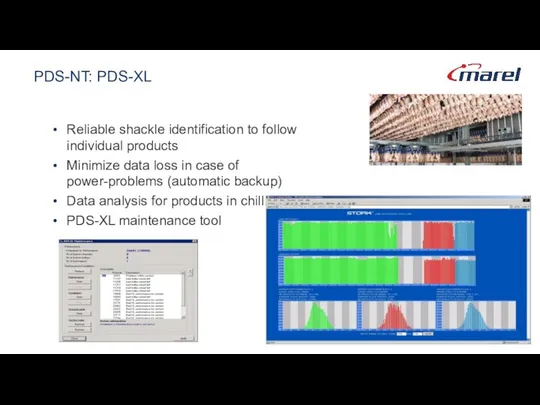
PDS-NT: PDS-XL
Reliable shackle identification to follow individual products
Minimize data loss
PDS-NT: PDS-XL
Reliable shackle identification to follow individual products
Minimize data loss
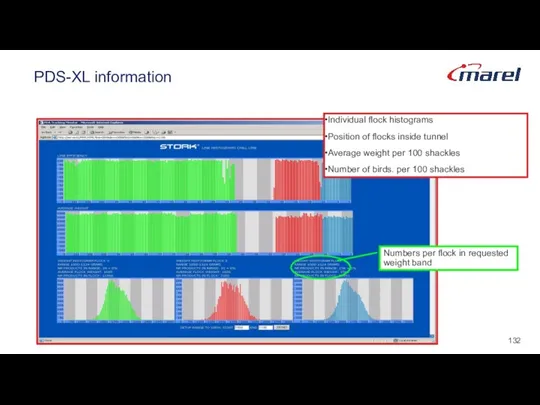
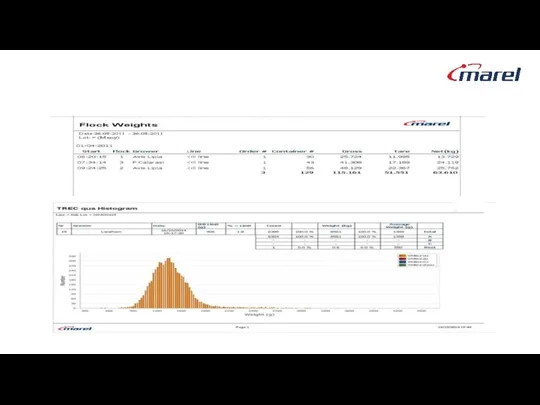
PDS-XL information
Individual flock histograms
Position of flocks inside tunnel
Average weight per 100
PDS-XL information
Individual flock histograms
Position of flocks inside tunnel
Average weight per 100
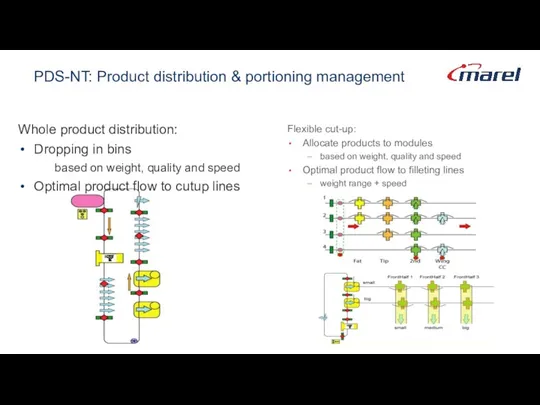
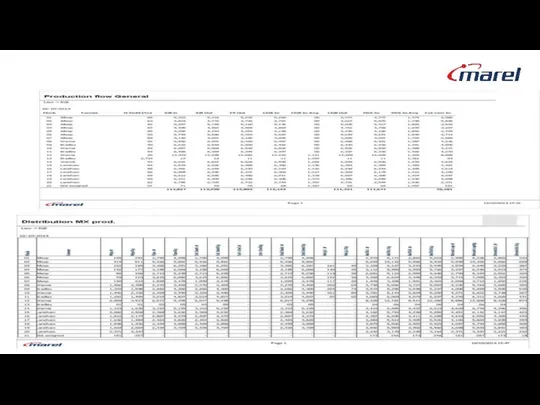
PDS-NT: Product distribution & portioning management
Whole product distribution:
Dropping in bins
based on
PDS-NT: Product distribution & portioning management
Whole product distribution:
Dropping in bins
based on
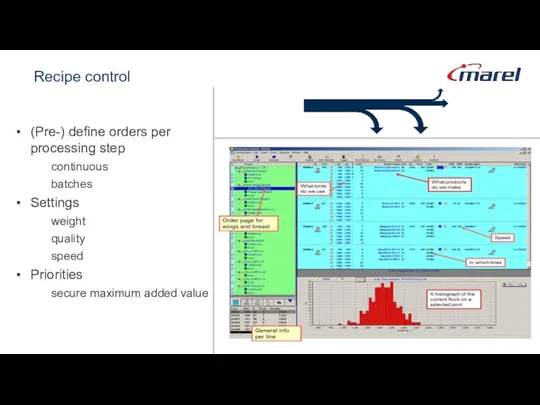
Recipe control
(Pre-) define orders per processing step
continuous
batches
Settings
weight
quality
speed
Priorities
secure maximum added value
Recipe control
(Pre-) define orders per processing step
continuous
batches
Settings
weight
quality
speed
Priorities
secure maximum added value
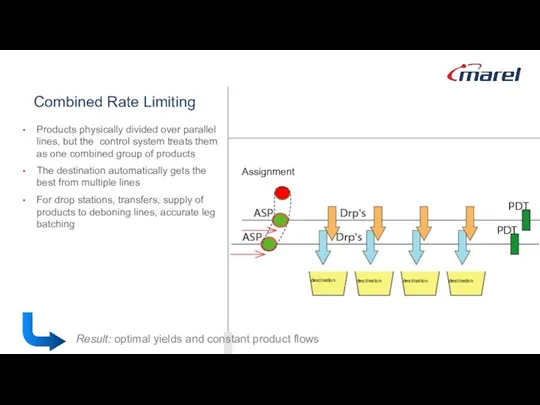
Products physically divided over parallel lines, but the control system treats
Products physically divided over parallel lines, but the control system treats
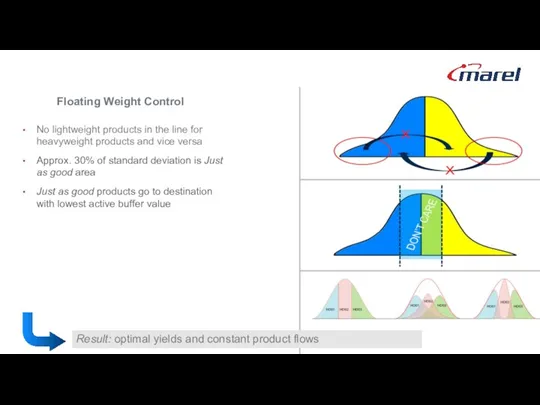
No lightweight products in the line for heavyweight products and vice
No lightweight products in the line for heavyweight products and vice
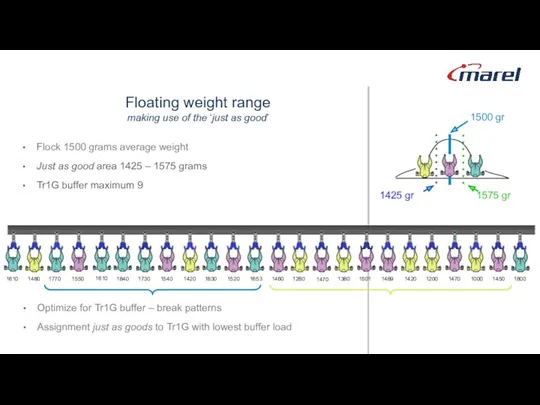
Floating weight range
making use of the ‘just as good’
1730
1540
1420
1830
1520
1653
1460
1280
1840
1610
1550
1770
1480
1610
1501
1489
1420
1200
1470
1000
1450
1800
1380
1470
Flock 1500 grams
Floating weight range
making use of the ‘just as good’
1730
1540
1420
1830
1520
1653
1460
1280
1840
1610
1550
1770
1480
1610
1501
1489
1420
1200
1470
1000
1450
1800
1380
1470
Flock 1500 grams
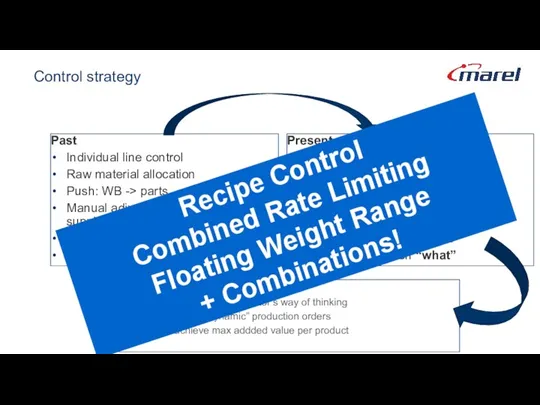
Control strategy
Past
Individual line control
Raw material allocation
Push: WB -> parts
Manual adjustments to
Control strategy
Past
Individual line control
Raw material allocation
Push: WB -> parts
Manual adjustments to
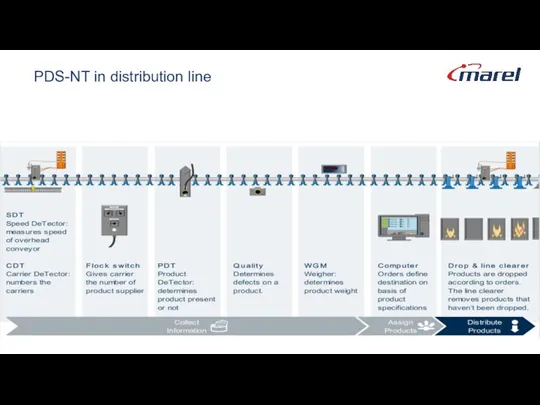
PDS-NT in distribution line
PDS-NT in distribution line
Innova
Traceability
Innova
Traceability
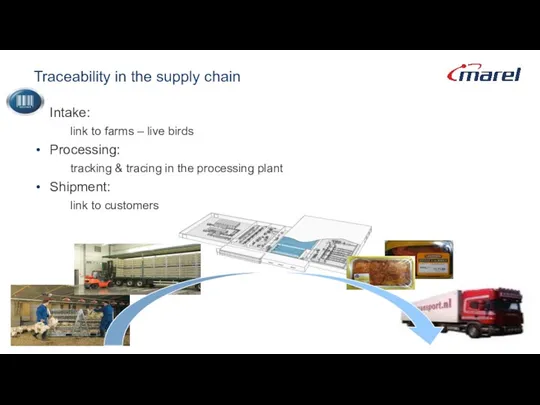
Traceability in the supply chain
Intake:
link to farms – live birds
Processing:
Traceability in the supply chain
Intake:
link to farms – live birds
Processing:
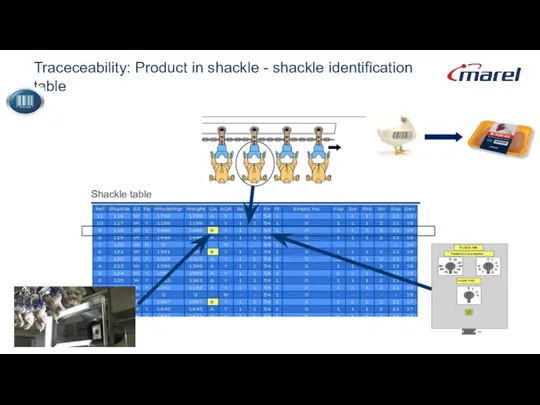
Traceceability: Product in shackle - shackle identification table
Shackle table
Traceceability: Product in shackle - shackle identification table
Shackle table
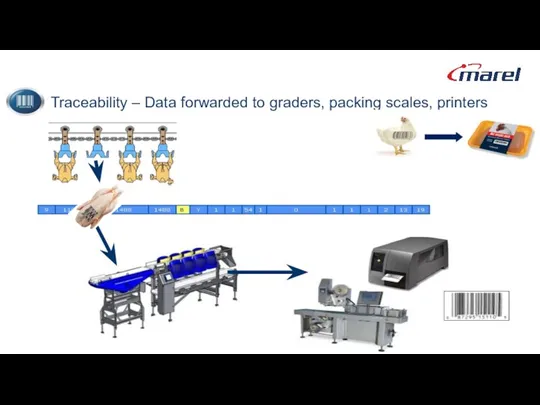
Traceability – Data forwarded to graders, packing scales, printers
Traceability – Data forwarded to graders, packing scales, printers
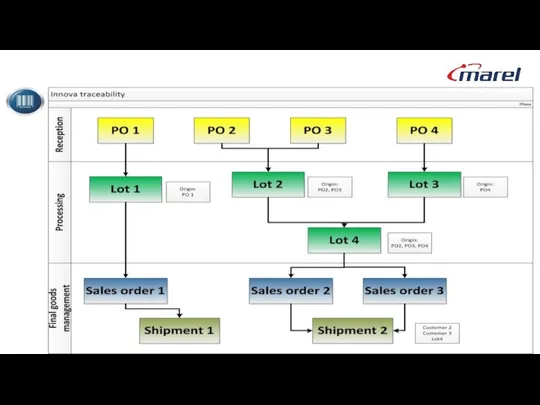
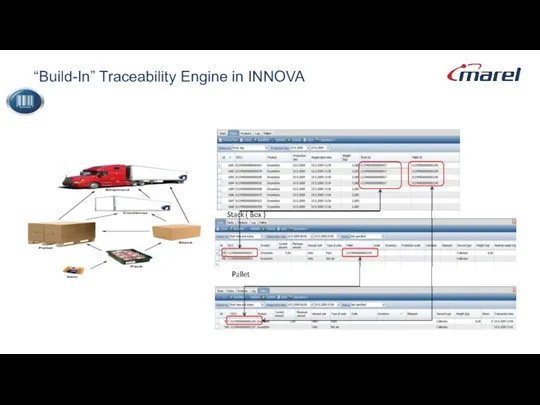
“Build-In” Traceability Engine in INNOVA
“Build-In” Traceability Engine in INNOVA
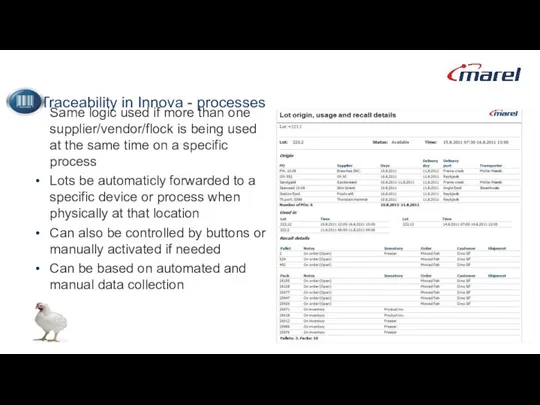
Traceability in Innova - processes
Same logic used if more than one
Traceability in Innova - processes
Same logic used if more than one
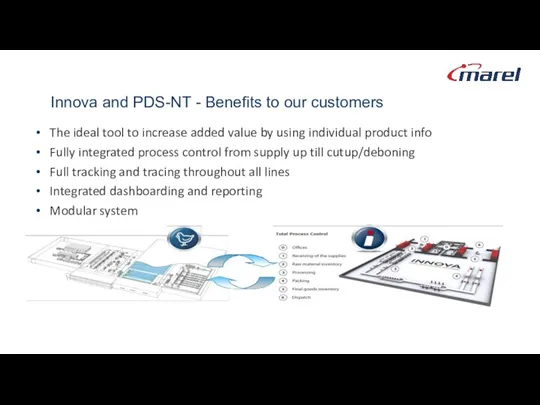
Innova and PDS-NT - Benefits to our customers
The ideal tool to
Innova and PDS-NT - Benefits to our customers
The ideal tool to

Tabel of content
Why Innova & PDS-NT
Overview Innova
Overview PDS-NT
Equipment Monitoring
Integration & customer
Tabel of content
Why Innova & PDS-NT
Overview Innova
Overview PDS-NT
Equipment Monitoring
Integration & customer
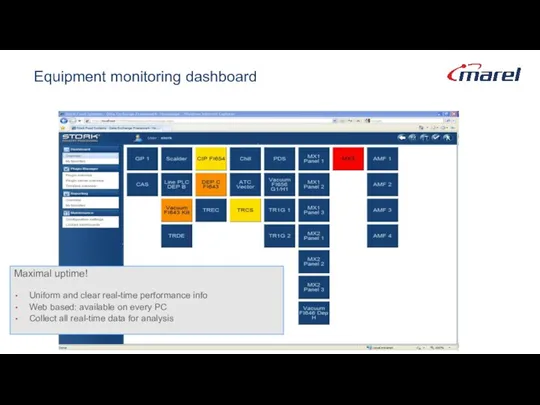
Equipment monitoring dashboard
Maximal uptime!
Uniform and clear real-time performance info
Web based: available
Equipment monitoring dashboard
Maximal uptime!
Uniform and clear real-time performance info
Web based: available
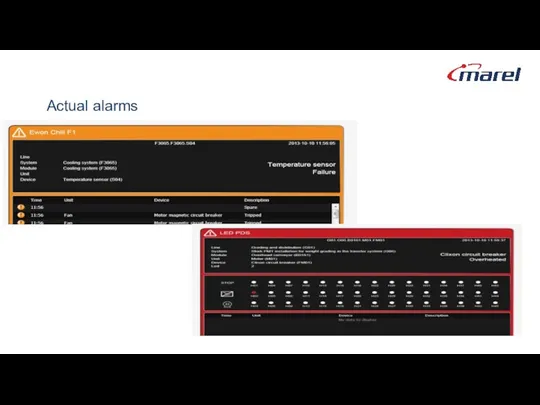
Actual alarms
Actual alarms
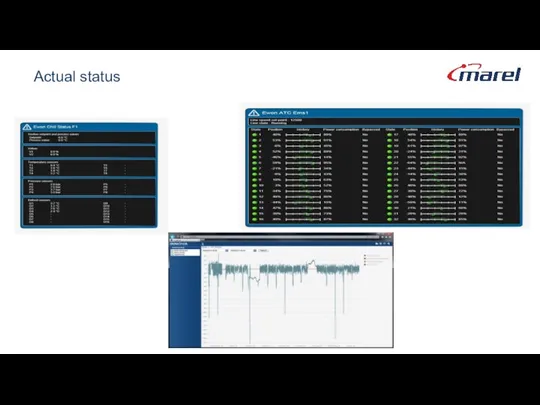
Actual status
Actual status

Actual status equipment (ATC: Graph)
Actual status equipment (ATC: Graph)
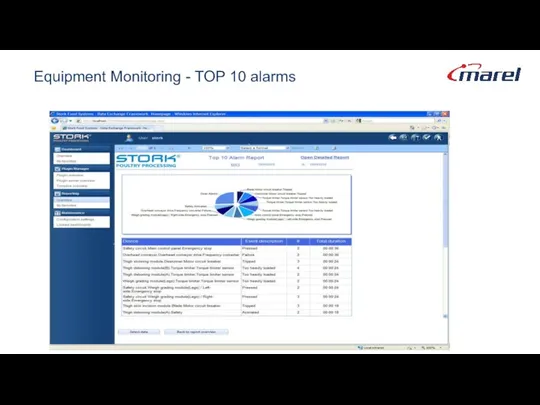
Equipment Monitoring - TOP 10 alarms
Equipment Monitoring - TOP 10 alarms
Tabel of content
Why Innova & PDS-NT
Overview Innova
Overview PDS-NT
Equipment Monitoring
Integration & customer
Tabel of content
Why Innova & PDS-NT
Overview Innova
Overview PDS-NT
Equipment Monitoring
Integration & customer
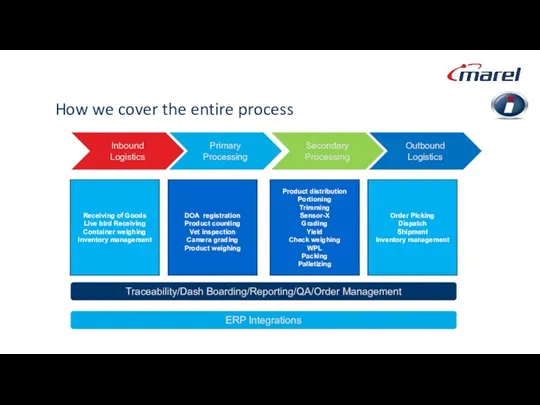
How we cover the entire process
Inbound Logistics
Primary Processing
Secondary Processing
Outbound Logistics
Order Picking
Dispatch
Shipment
Inventory
How we cover the entire process
Inbound Logistics
Primary Processing
Secondary Processing
Outbound Logistics
Order Picking
Dispatch
Shipment
Inventory
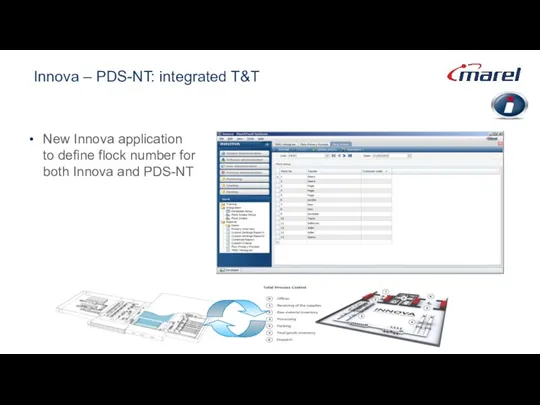
Innova – PDS-NT: integrated T&T
New Innova application
to define flock number
Innova – PDS-NT: integrated T&T
New Innova application to define flock number
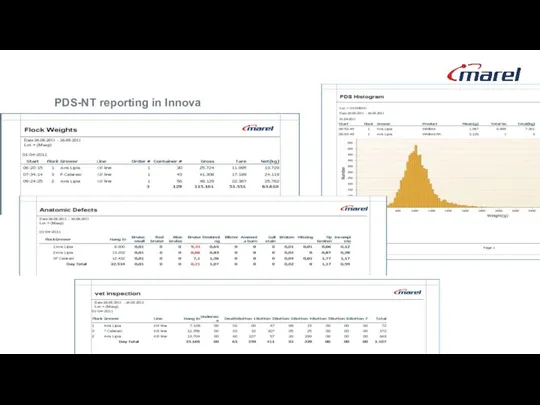
PDS-NT reporting in Innova
PDS-NT reporting in Innova
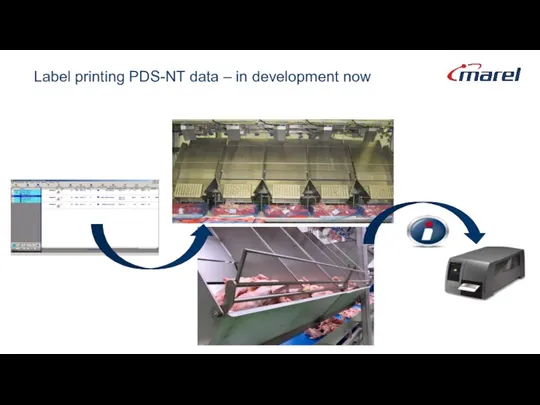
Label printing PDS-NT data – in development now
Label printing PDS-NT data – in development now
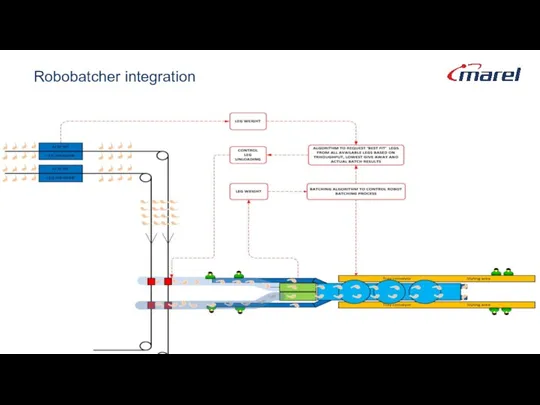
Robobatcher integration
Robobatcher integration
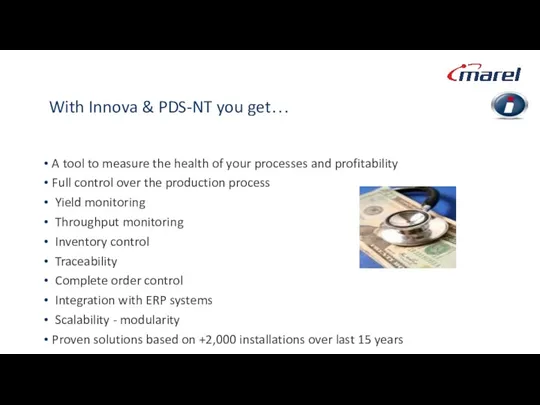
With Innova & PDS-NT you get…
A tool to measure the
With Innova & PDS-NT you get…
A tool to measure the
 Использование мультимедийных технологий в работе учителя-логопеда
 Русское искусство в.п.18 века. Архитектура. Живопись. Скульптура
 Технология. К урокам. Диск Диск Диск Диск Диск Диск
 Вычитание, умножение и деление рациональных чисел
 Основные законы в химии
 Презентация конспекта урока по теме Мягкий знак vol.2
 Практическая работа Определение ГП реки, обозначение рек на контурной карте (6 кл.)
 20230921_urok_3.poschety_i_vychisleniya_v_tablitsah
 Презентация Климат и климатические ресурсы
 Прокуратура Российской Федерации. Организационно-правовые основы деятельности прокуратуры
 Как читать карту
 Музыкальный инструмент - заместитель РУБЕЛЬ
 Симметрия многогранников
 Діни ағымдардың қоғамға кері әсері
 10 социально-экономическое развитие страны в 1960-х – середине 1980-х гг
 Библейские сказания. История Древнего мира
 Исследования на Международной космической станции
 Схемо- и системотехника электронных средств
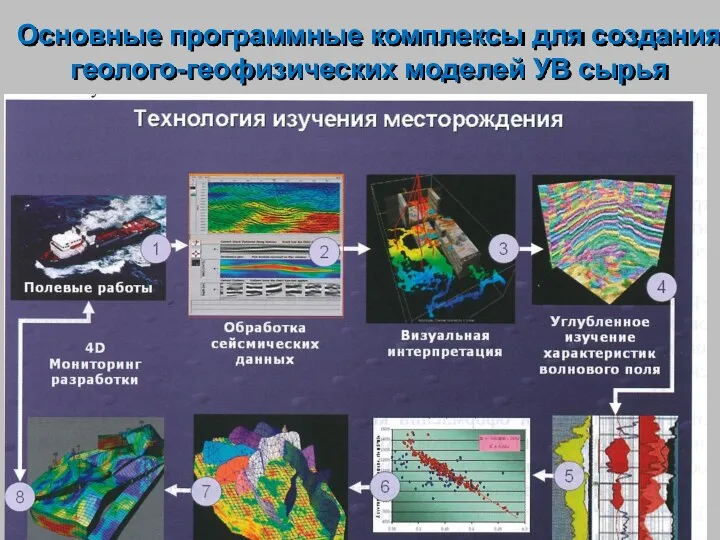 Основные программные комплексы для создания геолого-геофизических моделей УВ сырья
 Обобщение знаний по теме Литосфера
 Мистическое число 13
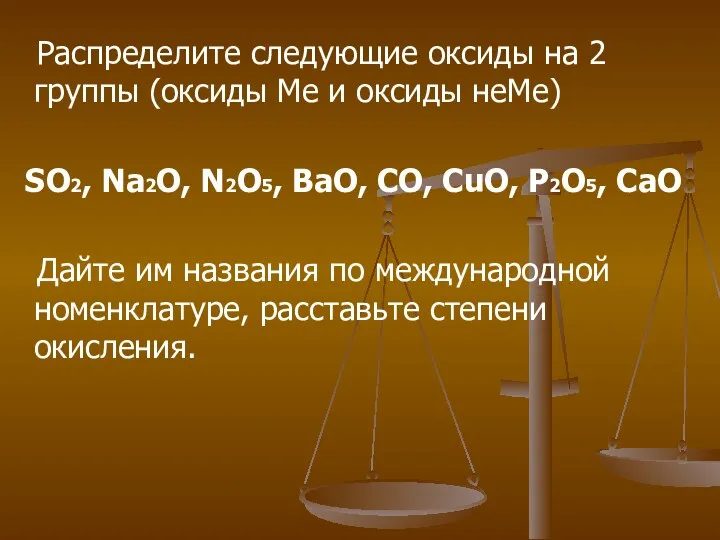 Презентация к уроку химии в 8-м классе по теме Основания
 20231011_oeni_-_konferentsiya_-_kopiya111
 Поняття про ораторську компетенцію
 Напряженность электростатического поля
 Портрет в музыке и живописи
 Молекулярная биология. Достижения, проблемы и перспективы. (Лекция 13-а)
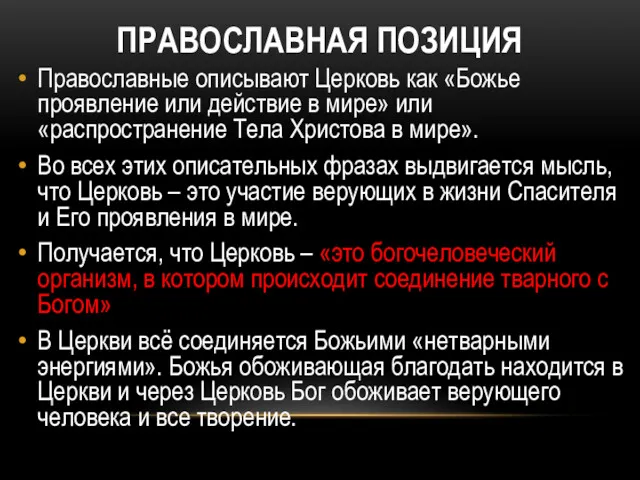 Православная позиция