- International economic analysis

Содержание
- 2. Key points Consumer surplus and producer surplus National welfare with no trade Welfare effects of free
- 3. 1. Demand & Consumer Surplus A Demand curve shows how much of a good consumers are
- 4. 1. Demand & Consumer Surplus Changes in these other things lead to shift of the demand
- 5. 1. Demand & Consumer surplus Consumer surplus The demand curve shows the maximum price the consumer
- 6. 1. Demand & Consumer surplus Consumer surplus is a measure of the difference between the maximum
- 7. 2. Supply & Producer Surplus A supply curve shows the quantity of a good that producers
- 8. 2. Supply & Producer Surplus Changes in these other things lead to shift of the supply
- 9. 2. Supply & Producer Surplus Producer Surplus The supply curve shows the lowest possible price at
- 10. 2. Supply & Producer Surplus Hence there is a producer surplus. Producer surplus is the difference
- 11. Figure 2.1 Demand and Supply for Motorbikes
- 12. Case study 1: Trade is important Exports Plus Imports as a Percentage of GDP
- 13. Case Study 2: The Trade mini collapse of 2009 Volume of World Trade and World Production,
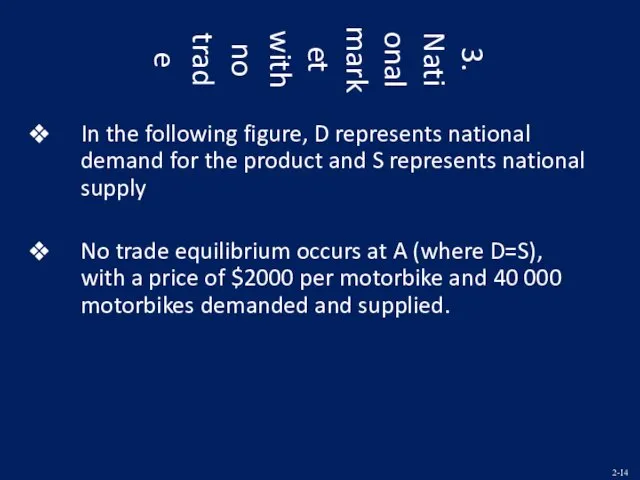
- 14. 3. National market with no trade In the following figure, D represents national demand for the
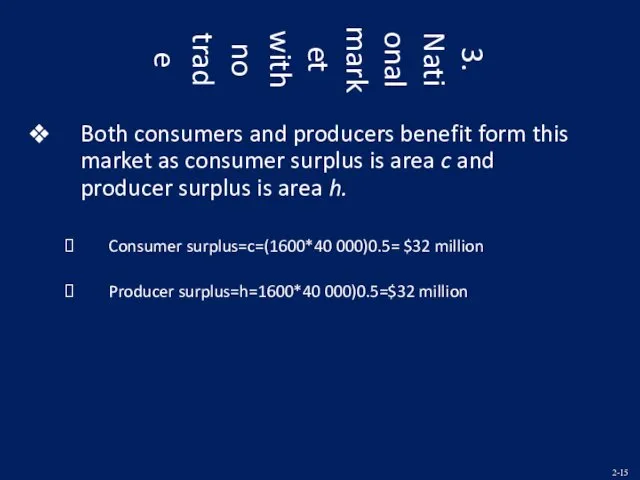
- 15. 3. National market with no trade Both consumers and producers benefit form this market as consumer
- 16. Figure 2.2 The Market for Motorbikes: Demand and Supply
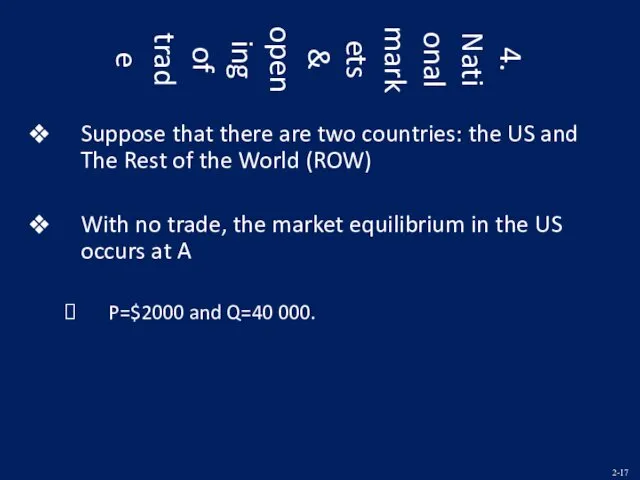
- 17. 4. National markets & opening of trade Suppose that there are two countries: the US and
- 18. 4. National markets & opening of trade With no trade, the market equilibrium in The Rest
- 19. 4. National markets & opening of trade As international market develops between the two countries, it
- 20. 4. National markets & opening of trade If there are no transportation costs or other frictions,
- 21. 4. National markets & opening of trade Free-trade equilibrium occurs at the price that clears the
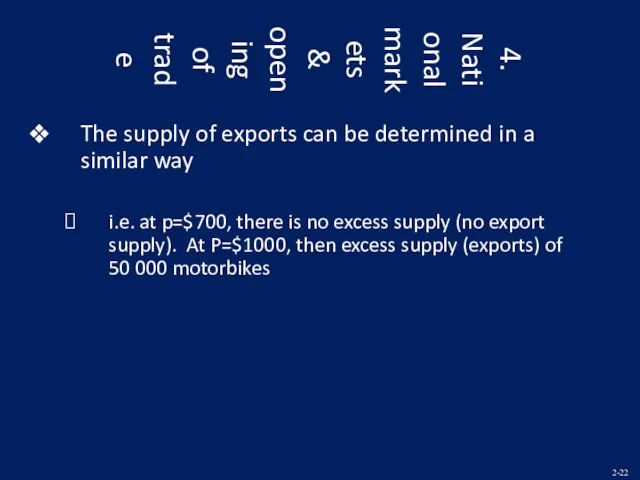
- 22. 4. National markets & opening of trade The supply of exports can be determined in a
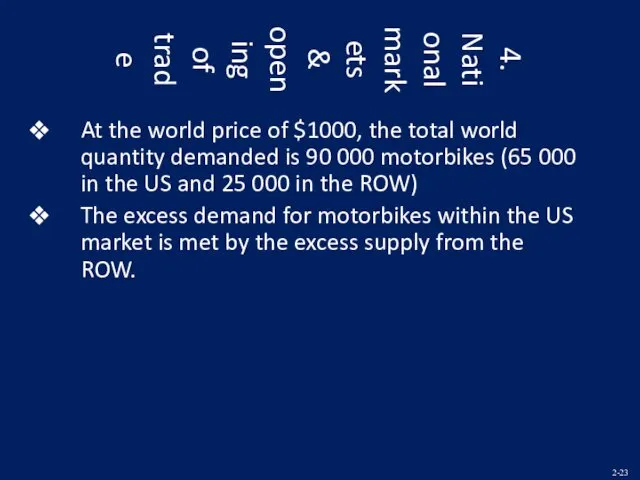
- 23. 4. National markets & opening of trade At the world price of $1000, the total world
- 24. Figure 2.3 The Effects of Trade on Production, Consumption, & Price
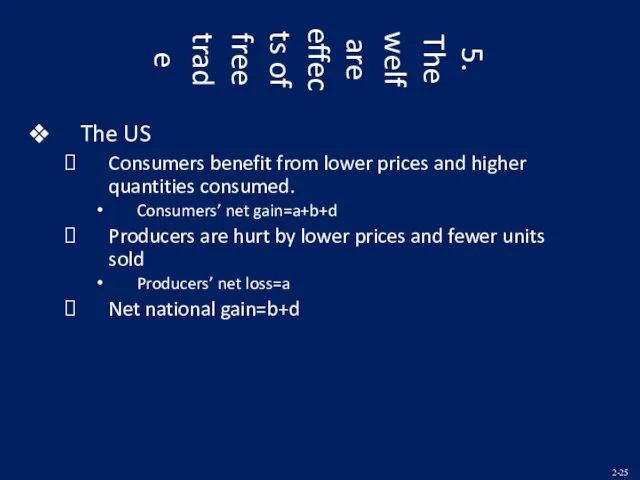
- 25. 5. The welfare effects of free trade The US Consumers benefit from lower prices and higher
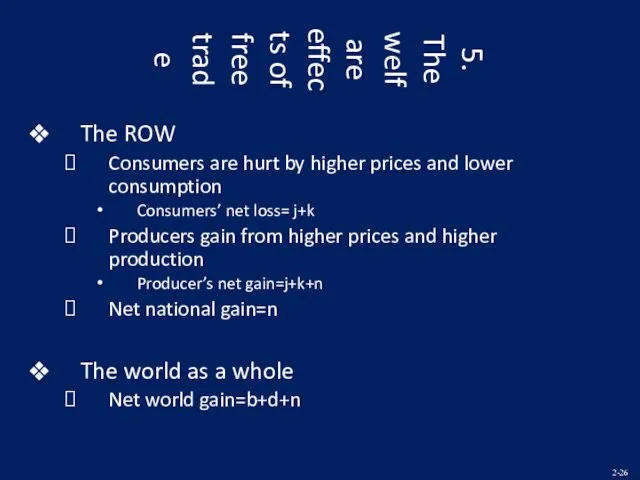
- 26. 5. The welfare effects of free trade The ROW Consumers are hurt by higher prices and
- 27. Figure 2.4 The Effects of Trade on Well- Being of Producers, Consumers, and the Nation as
- 29. Скачать презентацию
Key points
Consumer surplus and producer surplus
National welfare with no trade
Welfare
Key points
Consumer surplus and producer surplus
National welfare with no trade
Welfare
1. Demand & Consumer Surplus
A Demand curve shows how much of
1. Demand & Consumer Surplus
A Demand curve shows how much of
1. Demand & Consumer Surplus
Changes in these other things lead to
1. Demand & Consumer Surplus
Changes in these other things lead to
1. Demand & Consumer surplus
Consumer surplus
The demand curve shows the maximum
1. Demand & Consumer surplus
Consumer surplus
The demand curve shows the maximum
1. Demand & Consumer surplus
Consumer surplus is a measure of the
1. Demand & Consumer surplus
Consumer surplus is a measure of the
2. Supply & Producer Surplus
A supply curve shows the quantity of
2. Supply & Producer Surplus
A supply curve shows the quantity of
2. Supply & Producer Surplus
Changes in these other things lead to
2. Supply & Producer Surplus
Changes in these other things lead to
2. Supply & Producer Surplus
Producer Surplus
The supply curve shows the lowest
2. Supply & Producer Surplus
Producer Surplus
The supply curve shows the lowest
2. Supply & Producer Surplus
Hence there is a producer surplus.
Producer surplus
2. Supply & Producer Surplus
Hence there is a producer surplus.
Producer surplus
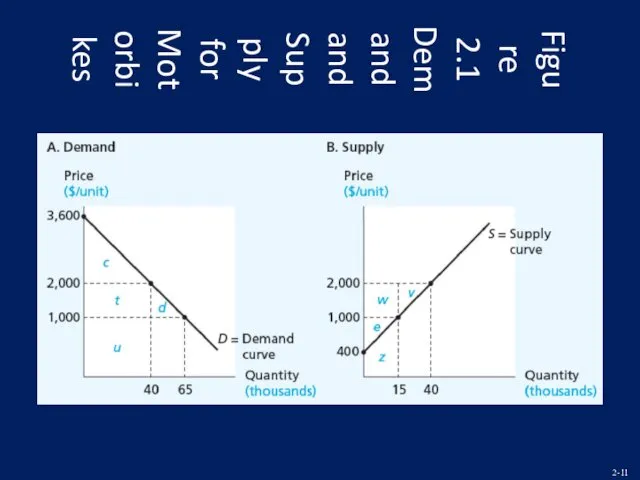
Figure 2.1 Demand and Supply for Motorbikes
Figure 2.1 Demand and Supply for Motorbikes
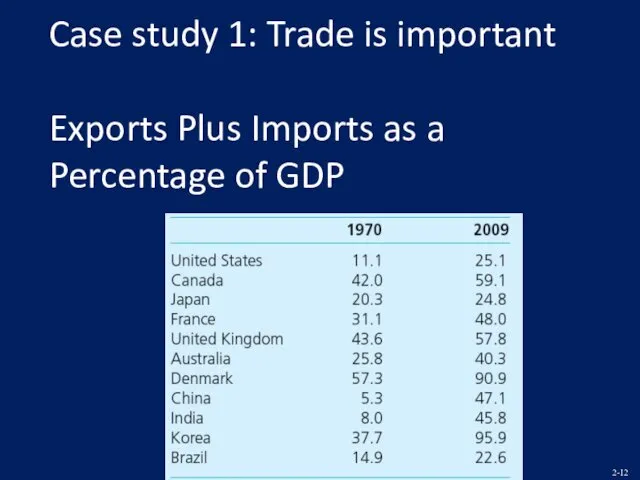
Case study 1: Trade is important
Exports Plus Imports as a Percentage
Case study 1: Trade is important
Exports Plus Imports as a Percentage
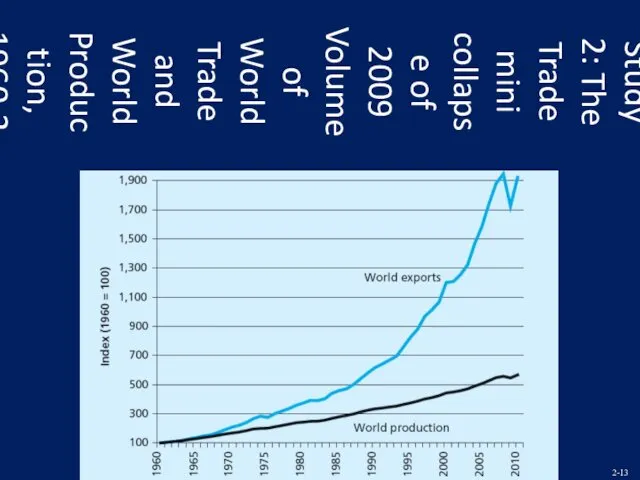
Case Study 2: The Trade mini collapse of 2009
Volume of World
Case Study 2: The Trade mini collapse of 2009 Volume of World
3. National market with no trade
In the following figure, D represents
3. National market with no trade
In the following figure, D represents
3. National market with no trade
Both consumers and producers benefit form
3. National market with no trade
Both consumers and producers benefit form
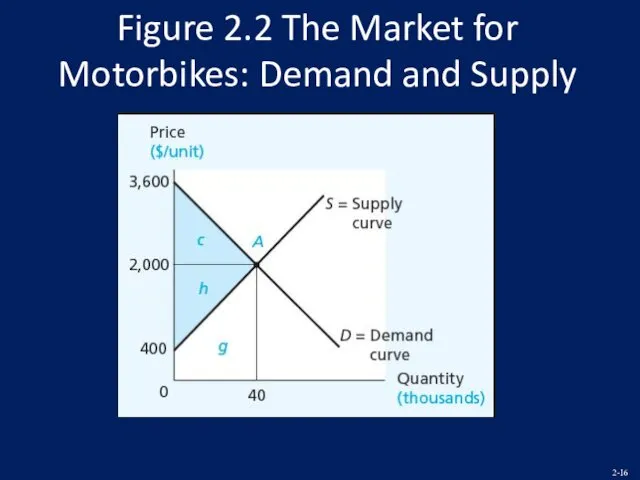
Figure 2.2 The Market for Motorbikes: Demand and Supply
Figure 2.2 The Market for Motorbikes: Demand and Supply
4. National markets & opening of trade
Suppose that there are two
4. National markets & opening of trade
Suppose that there are two
4. National markets & opening of trade
With no trade, the market
4. National markets & opening of trade
With no trade, the market
4. National markets & opening of trade
As international market develops between
4. National markets & opening of trade
As international market develops between
4. National markets & opening of trade
If there are no transportation
4. National markets & opening of trade
If there are no transportation
4. National markets & opening of trade
Free-trade equilibrium occurs at the
4. National markets & opening of trade
Free-trade equilibrium occurs at the
4. National markets & opening of trade
The supply of exports can
4. National markets & opening of trade
The supply of exports can
4. National markets & opening of trade
At the world price of
4. National markets & opening of trade
At the world price of
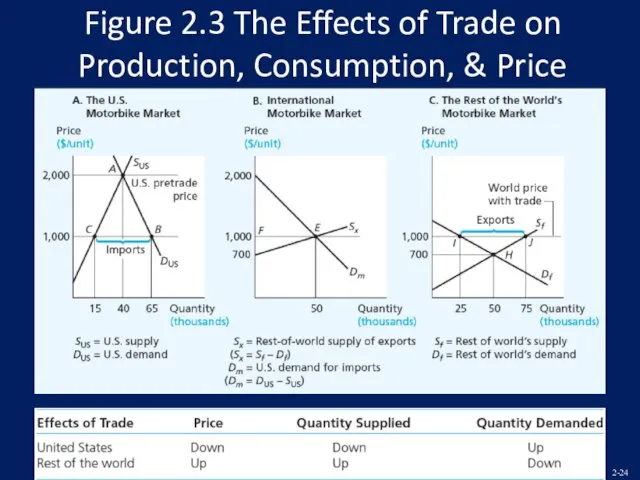
Figure 2.3 The Effects of Trade on Production, Consumption, & Price
Figure 2.3 The Effects of Trade on Production, Consumption, & Price
5. The welfare effects of free trade
The US
Consumers benefit from lower
5. The welfare effects of free trade
The US
Consumers benefit from lower
5. The welfare effects of free trade
The ROW
Consumers are hurt by
5. The welfare effects of free trade
The ROW
Consumers are hurt by
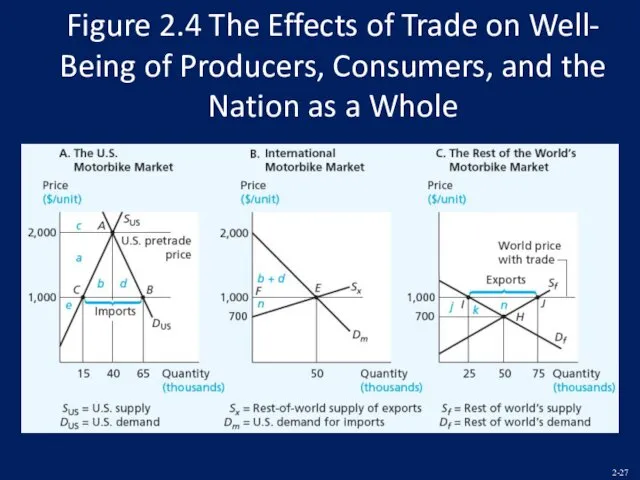
Figure 2.4 The Effects of Trade on Well- Being of Producers,
Figure 2.4 The Effects of Trade on Well- Being of Producers,
 Элементы улиц и дорог (1)
 Архитектор территорий
 Презентация Цветочные фантазии из фетра. Мастер-класс
 Родительское собрание О подростковом возрасте
 Подготовка поверхности к покраске
 Святая блаженная Ксения Петербургская
 Ветеран Великой Отечественной войны посёлка Рябинино Миков Виктор Петрович
 Дидактическая игра Лыжная прогулка
 Приключения барона Мюнхгаузена в Зимнем дворце
 Микропроцессодың архитектурасы
 Эдвард Григ, сюита Пер Гюнт
 Методы исследования рынка. Сущность и процесс маркетингового исследования
 Сенсоры. Классификация сенсоров. Терморезистивные, термоэлектрические, термомеханические, пироэлектрические преобразователи
 Виды ислама
 Понятие формы. Многообразие форм окружающего мира
 Биосфера. (6 класс)
 1917 год. От февраля к октябрю
 Бизнес. Как управлять своим доходом. Сибирское здоровье
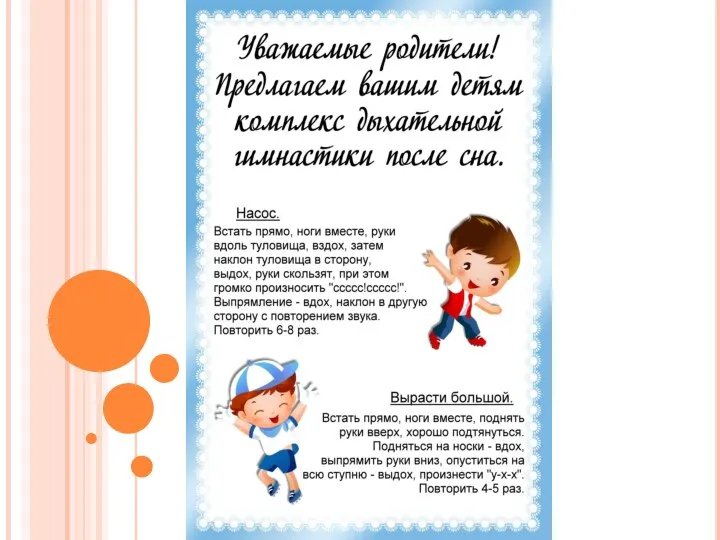 Дыхательная гимнастика
 Работа с клиентами, как составляющая имиджа компании Омскэлектро
 Образцы моделей выполнения упражнений
 Творческий проект Станок-лобзик универсальный стационарный
 Магнитное поле. Линии магнитного поля. 9 класс
 Заповедники Санкт-Петербурга и Ленинградской области
 Презентация к уроку краеведение. Тема: Редкие животные
 Hands
Hands Родительское собрание в 1 классе Родителям о внимании первоклассников
 чистые берега