- Measurement automation in laboratory physical modeling of seismic data

Содержание
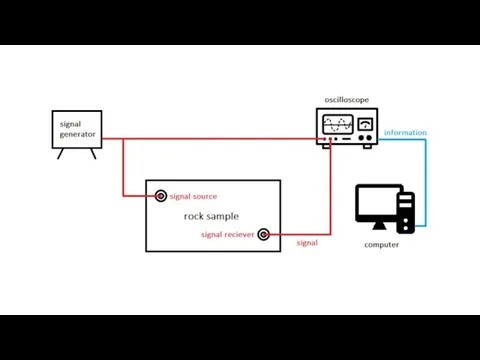
- 2. Here should be a picture of work place
- 4. Required functionality: Display waveform graphics on the screen Control oscilloscope settings Accumulation mode Positioning of the
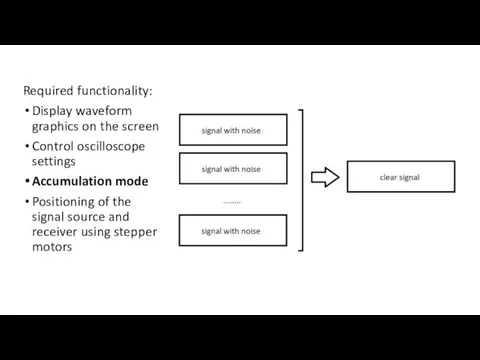
- 5. Required functionality: Display waveform graphics on the screen Control oscilloscope settings Accumulation mode Positioning of the
- 7. Initialization and main loop
- 8. Controlling oscilloscope settings
- 9. Receiving data and drawing
- 10. Graph analysis (peak detection)
- 11. Implementation of cursors
- 12. Automatic signal generation
- 13. Signal accumulation and averaging
- 14. Automation
- 16. Скачать презентацию
Here should be a picture
of work place
Here should be a picture
of work place
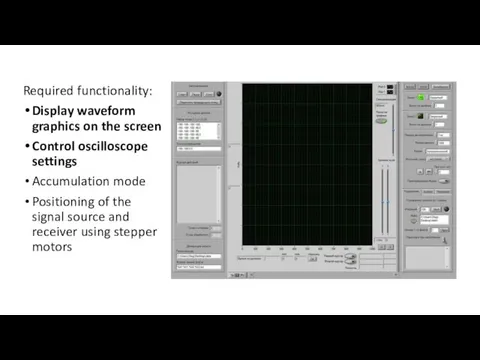
Required functionality:
Display waveform graphics on the screen
Control oscilloscope settings
Accumulation mode
Positioning
Required functionality:
Display waveform graphics on the screen
Control oscilloscope settings
Accumulation mode
Positioning
Required functionality:
Display waveform graphics on the screen
Control oscilloscope settings
Accumulation mode
Positioning
Required functionality:
Display waveform graphics on the screen
Control oscilloscope settings
Accumulation mode
Positioning
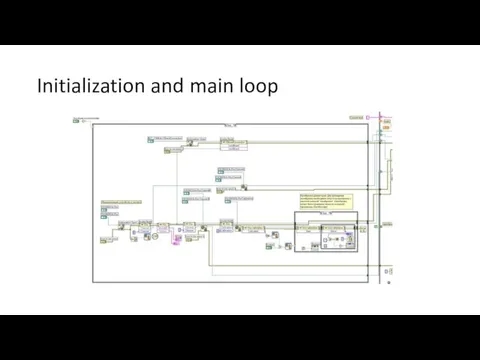
Initialization and main loop
Initialization and main loop
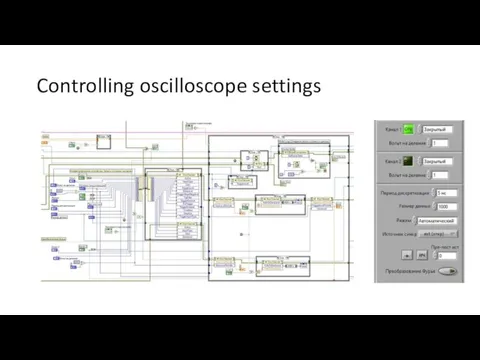
Controlling oscilloscope settings
Controlling oscilloscope settings
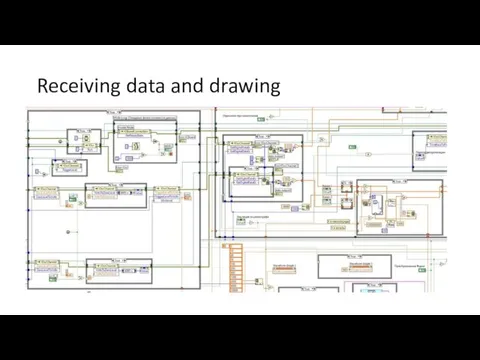
Receiving data and drawing
Receiving data and drawing
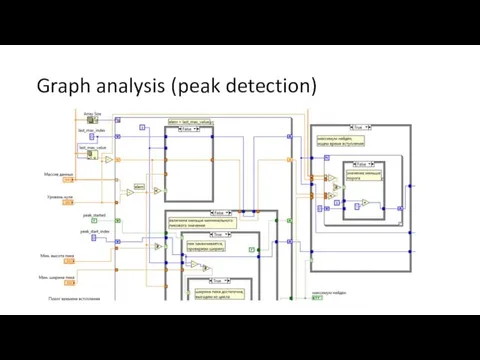
Graph analysis (peak detection)
Graph analysis (peak detection)
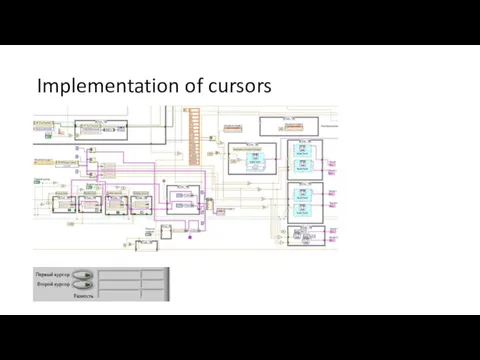
Implementation of cursors
Implementation of cursors
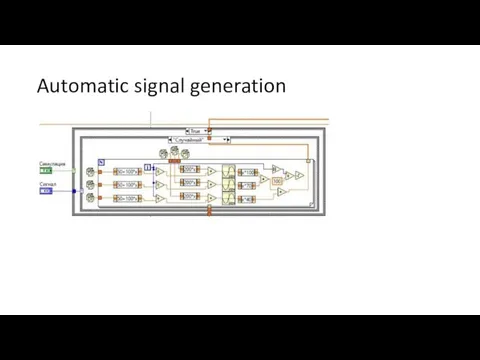
Automatic signal generation
Automatic signal generation
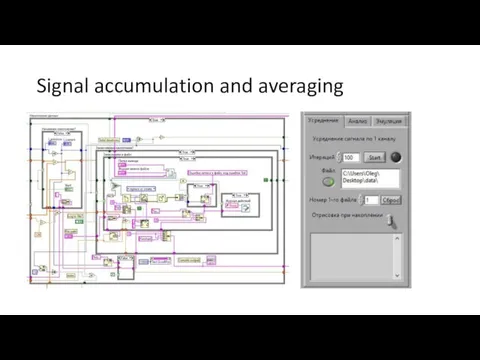
Signal accumulation and averaging
Signal accumulation and averaging
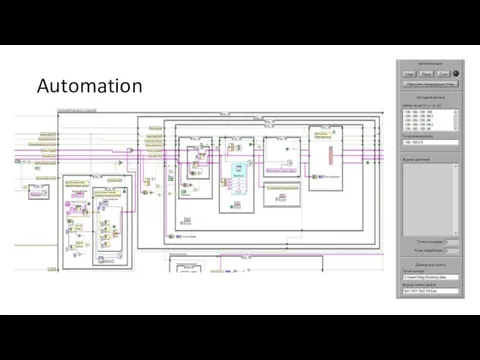
Automation
Automation
 Шаблоны Школьные
 Числа от 1 до 100. Умножение и деление
 ТУРГЕНЕВ ОТЦЫ БАЗАРОВ И РОДИТЕЛИ 2
 Судовое вспомогательное энергооборудование
 Традиции, обычаи воспитания казаков
 Німеччина (ФРН), утворення ФРН 23 травня 1949
 Виды и рода войск Российской федерации
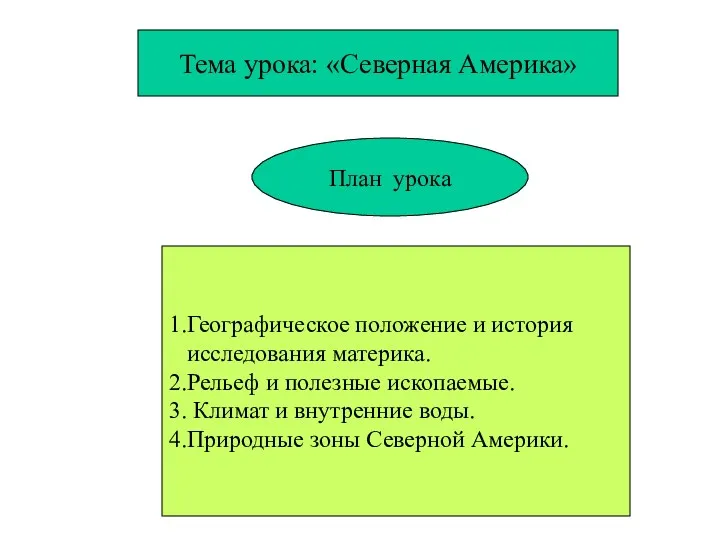 Северная Америка
 Системы обеспечения безопасности движения
 Виды условных знаков. Виды карт по содержанию
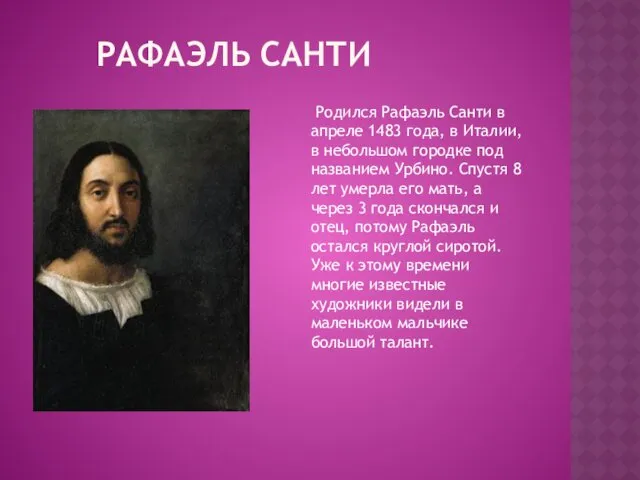 Рафаэль Санти
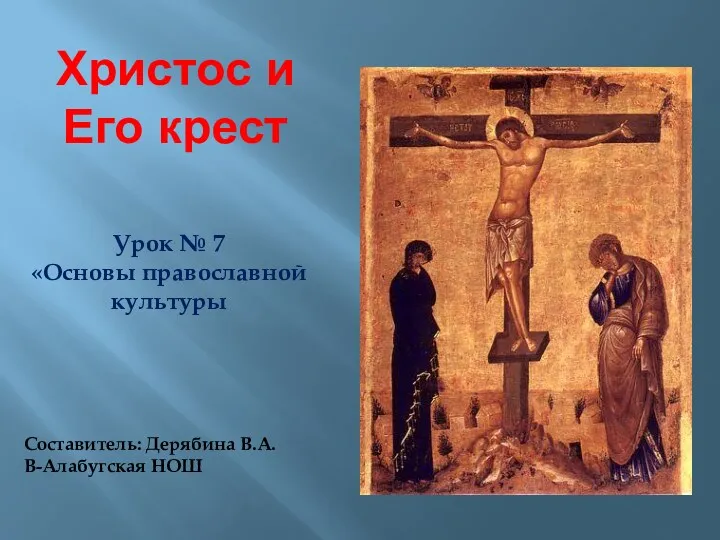 Презентация Христос и Его крест
 ) Жизнь на материках
 Разработка занятия по технике изонить. Первые шаги - угол.
 Анонимные Наркоманы. Служение больницы и учреждения. Исправительные учреждения
 урок - кроссворд
 Организация видов работ при эксплуатации и реконструкции строительных объектов
 Урок технологии в малокомплектной сельской школе Изготовление домашних оберегов
 Қазақтың сүт өнімдері. Сүт өнімдерінің адам ағзасына пайдасы
 Базовые эмоции
 Наноспутники в системе космической радиосвязи
 Балалардағы жүрек ырғағының бұзылысы
 ИСПОЛЬЗОВАНИЕ СИСТЕМНОГО ПОДХОДА КЛАССНОГО РУКОВОДИТЕЛЯ К ЗДОРОВЬЕСБЕРЕГАЮЩЕЙ ДЕЯТЕЛЬНОСТИ ЧЕРЕЗ ПРОЕКТ НАШЕ ЗДОРОВЬЕ
 Лечение болевого синдрома у онкологических пациентов в педиатрии
 презентация: Здоровые дети - здоровая страна
 Николай Николаевич Носов
 Презентация. Игра на тему Этикет
 Библия и Евангелие