- Measurement automation in laboratory physical modeling of seismic data

Содержание
- 2. Here should be a picture of work place
- 4. Required functionality: Display waveform graphics on the screen Control oscilloscope settings Accumulation mode Positioning of the
- 5. Required functionality: Display waveform graphics on the screen Control oscilloscope settings Accumulation mode Positioning of the
- 7. Initialization and main loop
- 8. Controlling oscilloscope settings
- 9. Receiving data and drawing
- 10. Graph analysis (peak detection)
- 11. Implementation of cursors
- 12. Automatic signal generation
- 13. Signal accumulation and averaging
- 14. Automation
- 16. Скачать презентацию
Here should be a picture
of work place
Here should be a picture
of work place
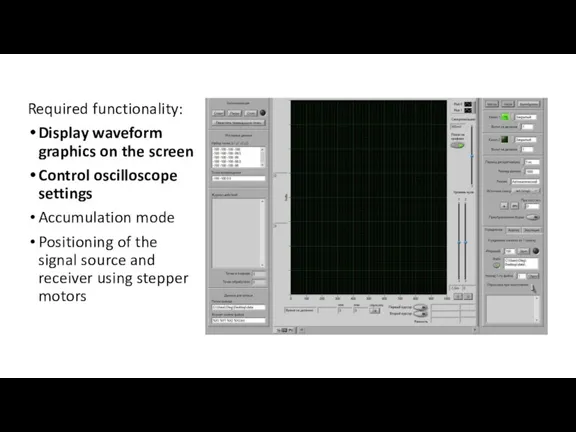
Required functionality:
Display waveform graphics on the screen
Control oscilloscope settings
Accumulation mode
Positioning
Required functionality:
Display waveform graphics on the screen
Control oscilloscope settings
Accumulation mode
Positioning
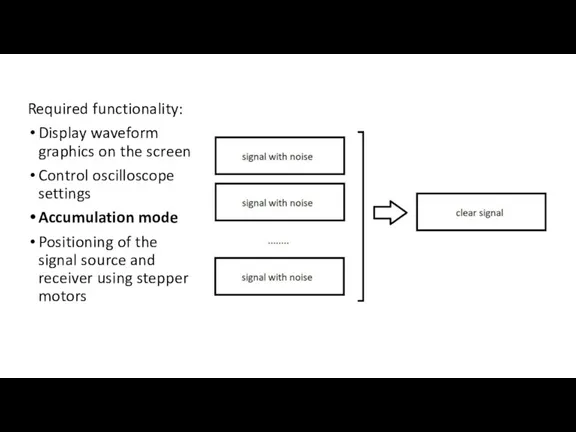
Required functionality:
Display waveform graphics on the screen
Control oscilloscope settings
Accumulation mode
Positioning
Required functionality:
Display waveform graphics on the screen
Control oscilloscope settings
Accumulation mode
Positioning
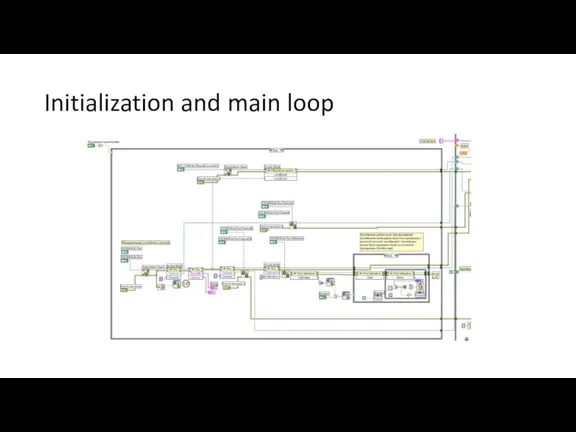
Initialization and main loop
Initialization and main loop
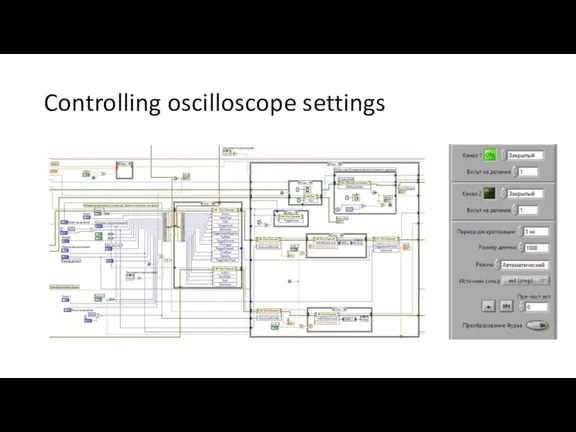
Controlling oscilloscope settings
Controlling oscilloscope settings
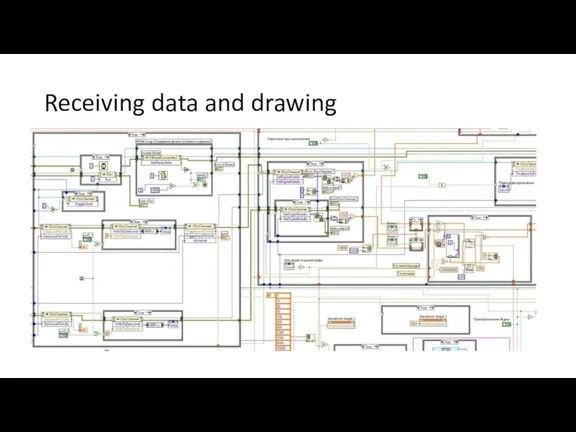
Receiving data and drawing
Receiving data and drawing
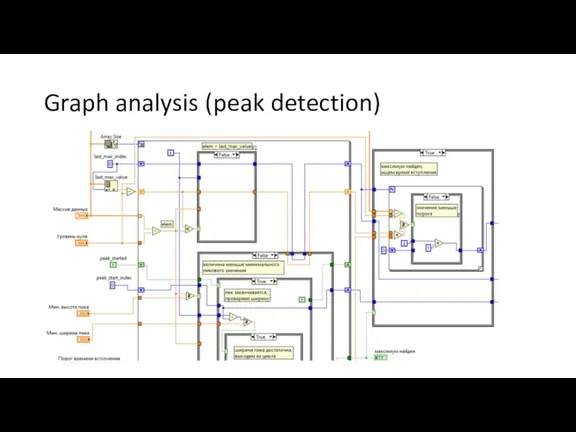
Graph analysis (peak detection)
Graph analysis (peak detection)
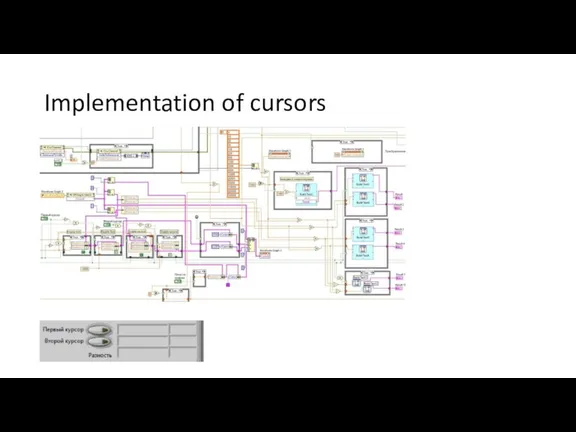
Implementation of cursors
Implementation of cursors
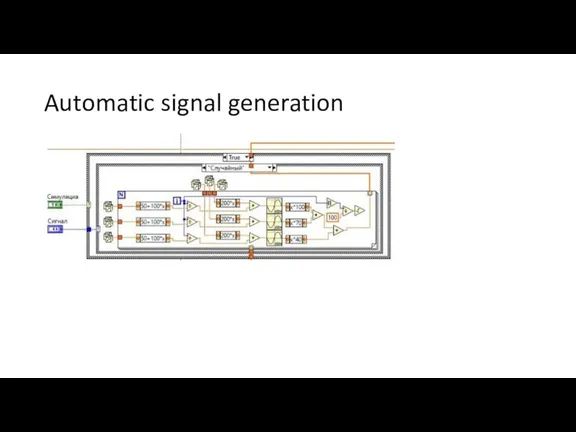
Automatic signal generation
Automatic signal generation
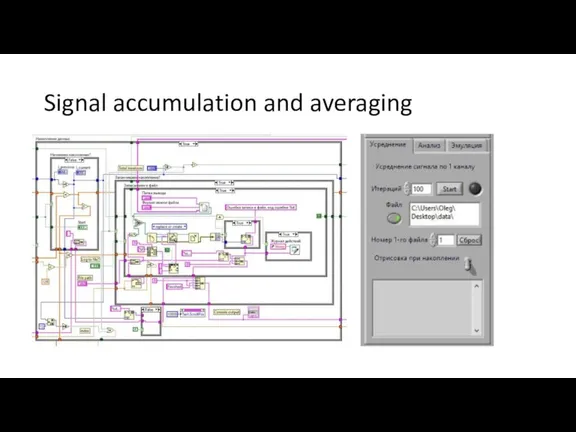
Signal accumulation and averaging
Signal accumulation and averaging
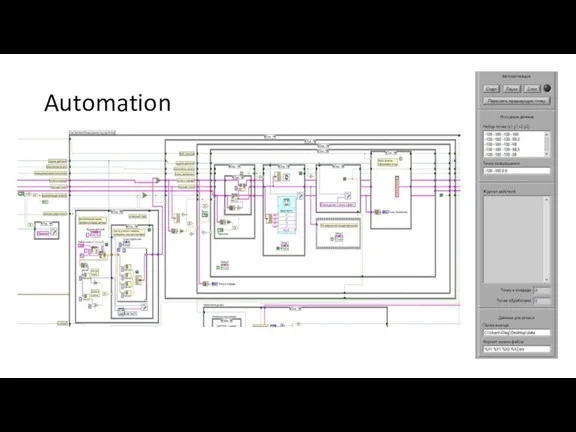
Automation
Automation
 State sysstem of Ukraine
 Объекты Range и Selection
 Профилактика дисграфии
 Классификация звуков речи. Система фонем
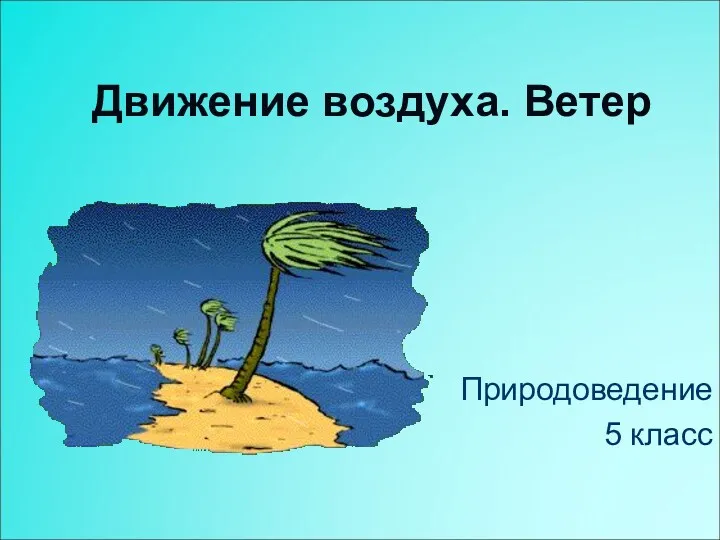 Движение воздуха. Ветер
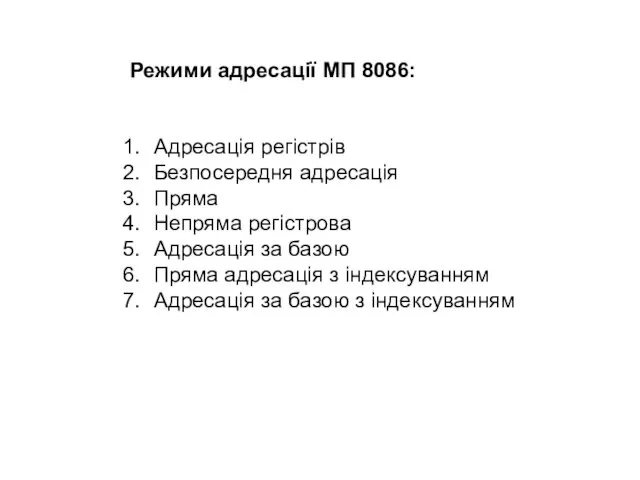 Режими адресації МП 8086
 Кодирование информации
 Октябрьская революция. Политическая и социально-экономическая ситуация накануне Октябрьской революции
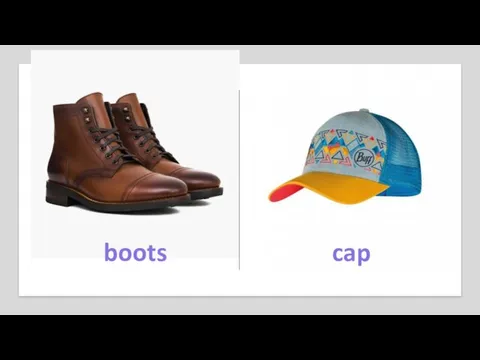 Clothes. Words
 Выбор расположения дополнительного водосброса в ходе комплексной реконструкции Майнского гидроузла
 Организация образовательной деятельности. Управление образованием
 Обстоятельства, исключающие преступность деяния. Понятия и виды обстоятельств, исключающие преступность деяния
 Классный час Радоваться жизни
 презентация Взаимосвязь и взаимодействие специалистов и педагогов
 Презентация к уроку по теме Дробные выражения
 Xit test. Spotlight 4
 ЧС военного характера. Основные источники ЧС военного характера. Современные средства поражения
 ДЕНЬ ЗЕМЛИ
 Презентация В гостях у сказки
 1. 6 клас .Коло. Довжина кола. Число пі
 1.DVIZH_Spotlight_4_m6_11a
 Расширение представления детей об осени, как времени года
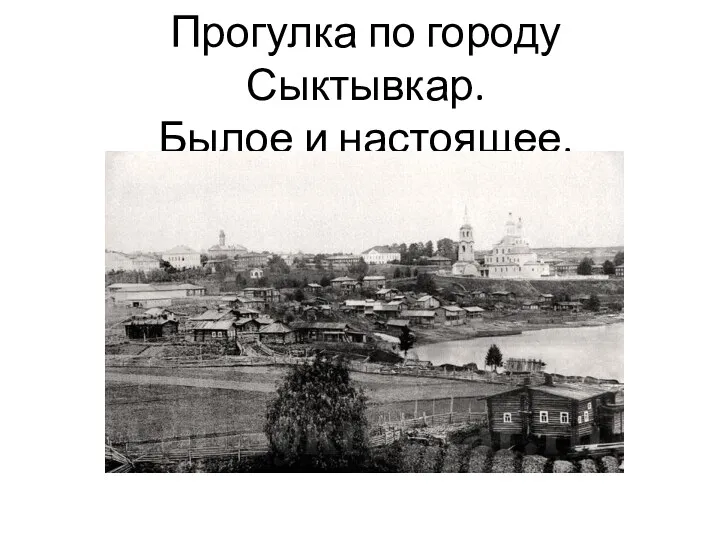 Сыктывкар - мой родной город!
 Электронный задачник по генетике. Часть 2
 Осложнения повреждений опорно-двигательного аппарата
 Организм и среда. Природные сообщества
 Если друг оказался вдруг (3). Крах банка Берингс
 Воздушный змей