- Radar data visualization tool (RDV)

Содержание
- 2. The data and information, in its totality or partial expression, contained in this document are property
- 3. Signature Sheet
- 4. Changes Record
- 5. Acronyms
- 6. Acronyms
- 9. 1 General Description System Overview Block Diagram Functional Description
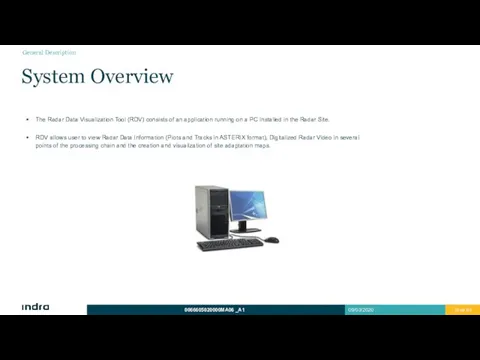
- 10. System Overview The Radar Data Visualization Tool (RDV) consists of an application running on a PC
- 11. Block Diagram General Description
- 12. Functional Description The main of RDV are: Radar Data: Visualization and recordings of ASTERIX Data from
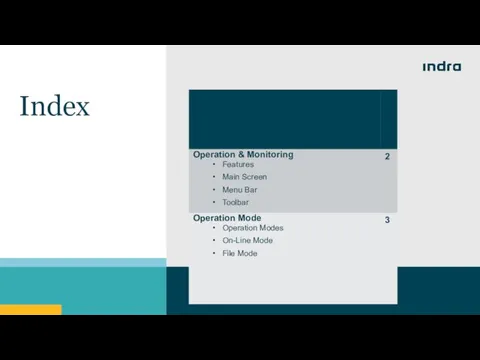
- 13. 2 Operation & Monitoring Features Main Screen Menu Bar Toolbar
- 14. Features Features: Radar Data Display. PSR Video Monitoring. Site Maps Creation. Analyses and Reports. Operation &
- 15. Main Screen Menu Bar Toolbar Visualization Area Operation & Monitoring
- 16. The main screen of the RDV shows three different areas: Menu Bar: Menus to access different
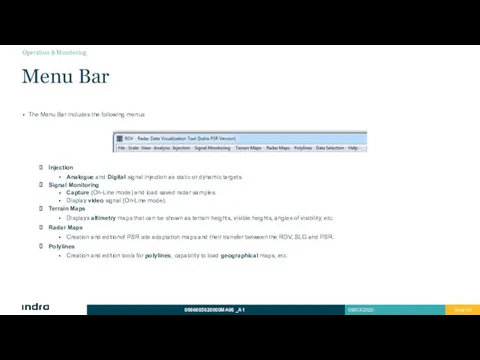
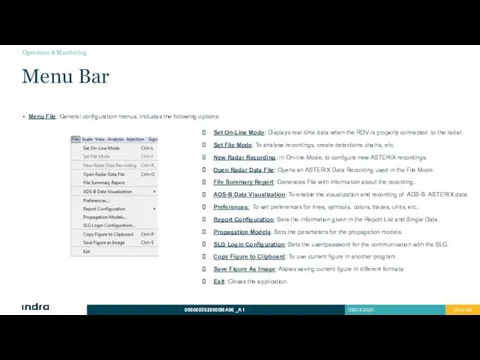
- 17. The Menu Bar includes the following menus File Operation Mode Selection. On-line Mode. File Mode. Allows
- 18. The Menu Bar includes the following menus Injection Analogue and Digital signal injection as static or
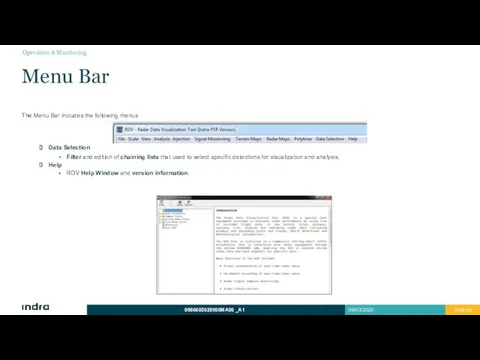
- 19. The Menu Bar includes the following menus Data Selection Filter and edition of chaining lists that
- 20. Set On-Line Mode: Displays real-time data when the RDV is properly connected to the radar. Set
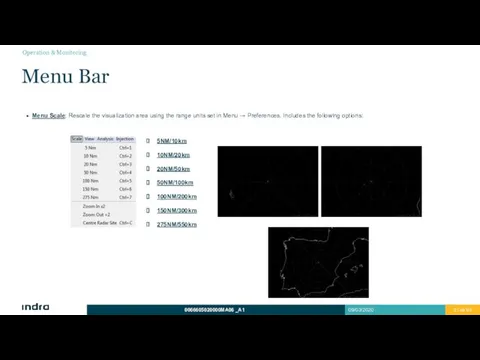
- 21. Menu Scale: Rescale the visualization area using the range units set in Menu → Preferences. Includes
- 22. Menu Analysis: To evaluate ASTERIX recordings in File mode. Includes the following options: Menu Bar PSR-SSR
- 23. Menu Injection: Allows injection of signal in the PSR in On-Line mode. Includes the following options:
- 24. Menu Signal Monitoring: Visualization of PSR data samples and video signal. Includes the following options: Menu
- 25. Menu Terrain Maps: Visualization of site environment altimetry (DTED). Includes the following options: Menu Bar Load
- 26. Menu Radar Maps: PSR maps creation, edition, transfer and management. Includes the following options: Menu Bar
- 27. Menu Polylines: Lines management, geographical maps. Includes the following options: Menu Bar Load User Polylines File:
- 28. Menu Data Selection: Filter options and creation of data lists. Includes the following options: Menu Help:
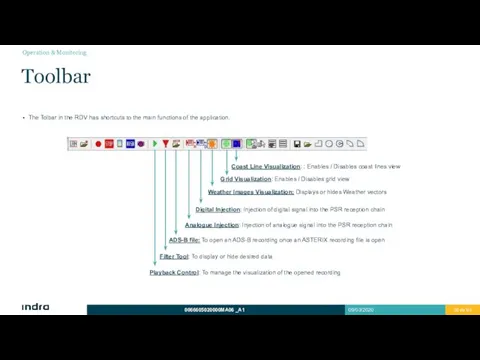
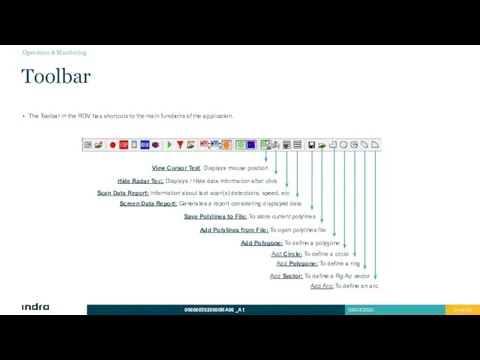
- 29. The Toolbar includes shortcuts to the main functions of the RDV. Toolbar Operation & Monitoring
- 30. The Tolbar in the RDV has shortcuts to the main functions of the application. Toolbar Analogue
- 31. The Toolbar in the RDV has shortcuts to the main functions of the application. Toolbar Operation
- 32. 3 Operation Mode Operation Modes On-Line Mode File Mode
- 33. The RDV is able to work in two different modes: On-line Mode. When the RDV is
- 34. The RDV provides the capability to display the radar detections read from LAN. The representation of
- 35. When the Video Display is enabled the Video Control Window appears: On-Line Mode Video Display Operation
- 36. By means the Video Display Tool, it is possible to select between different monitoring points, depending
- 37. Once the monitoring point is selected is possible to see the Video Data in the PPI:
- 38. Clicking in the “OSCILLOSCOPE” Button, opens the Oscilloscope view: On-Line Mode Video Display This view shows
- 39. The RDV provides the capability to display radar detections stored in an ASTERIX file. The visual
- 40. The user can run offline analyses that evaluate radar performance (PSR-SSR alignment, north alignment, accuracy in
- 41. 4 Analysis PSR-SSR Range Alignment North Alignment Detection Target Position Accuracy and Resolution PSR Amplitude Profile
- 42. PSR-SSR Alignment: Analyzes the alignment difference reported from PSR and SSR sensors in a recording with
- 43. There are two possible ways to perform the North Alignment: An offset sent from MSSR is
- 44. The RDV analyses detection of a radar data chain previously created from a recording. First it
- 45. SR Detection : Primary Radar Detections SSR Detection : Secondary Radar Detections RR Detection : Combined
- 46. Obtaining the following results: Probability of Detection Vs Range Diagram: Detection Analysis
- 47. The RDV can estimate the accuracy and resolution in range, azimuth and height of PSR and
- 48. The PSR Amplitude Profile takes the information of the PSR and combined detections and displays them
- 49. The SSR Altitude Profile takes the information of the SSR/Mode-S detections and displays them in a
- 50. The RDV can analyse a recording synchronized through NTP (.gps) to evaluate time delay. Delay can
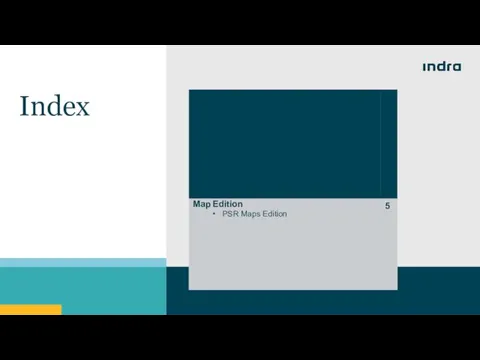
- 51. 5 RDV Management Maps Functionalities Map Modification Criteria
- 52. Maps Optimization Maps In addition to tilt selection and CFAR sensitivity values configuration, system optimization is
- 53. The Blanking map has the capability to stop the transmission over certain azimuths of the coverage.
- 54. The analog STC Map is usually configured the first one by following the next tips: Depending
- 55. The Site Environment Map allows the user to configure the CFAR processing in the system, applying
- 56. The receiver status map has a limitation that must always be followed about the pulses. All
- 57. The Digital STC Map stablishes a threshold of power for a signal to be considered on
- 58. The tracking areas map is used to create specific areas with special tracking conditions, filtering detections
- 59. The map edition, creation and management is done with the Indra RDV software. RDV Configuration: Execute
- 60. Execute Indra RDV Software as administrator. Once the RDV software is operative, open the “Radar Maps”
- 61. Select “New Map” and select in the pop-up window which map is about to be created.
- 62. Open the RDV software. Open the map that needs to be applied in the CPC. Go
- 63. Monitoring RDV
- 64. RDV allows the user to perform a Signal monitoring at a certain time by pressing “M”.
- 65. A Signal Monitoring can be saved in the PC to be sent in case of need.
- 66. The video configuration allows the user to see in real time the status of several monitoring
- 67. To analyze a system’s performance it is needed a recording of several hours. To perform a
- 68. To analyze a recording it is used the RDV and the SASS-C / Verif combined. The
- 69. First thing is to open the recording with RDV. In order to do so, click on
- 70. The following shortcuts allow the user to navigate faster through the recording: “E” : The recording
- 71. RDV can also perform several types of analysis with a recording. The most used are the
- 72. When the optimization process has achieved a successful result, it is highly convenient to create a
- 73. The Blanking Map is only edited to add blanking azimuths by customer’s request to prevent radiation
- 74. The modification of this map is related with a low Pd issue. If the default map
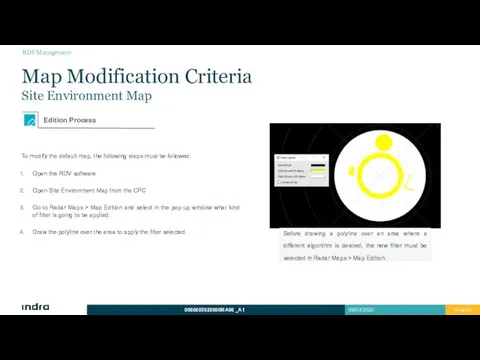
- 75. To modify the default map, the following steps must be followed: Open the RDV software Open
- 76. Analog STC Map Maps Modification Criteria
- 77. This map is not usually modified, because the Indra PSR sensor has other methods to avoid
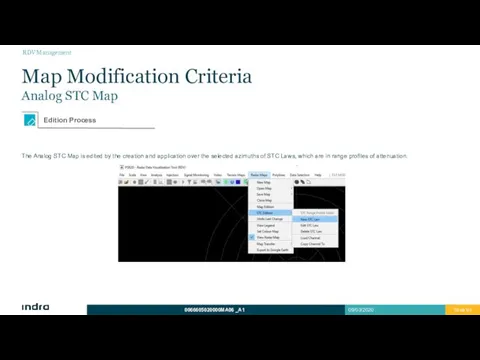
- 78. The Analog STC Map is edited by the creation and application over the selected azimuths of
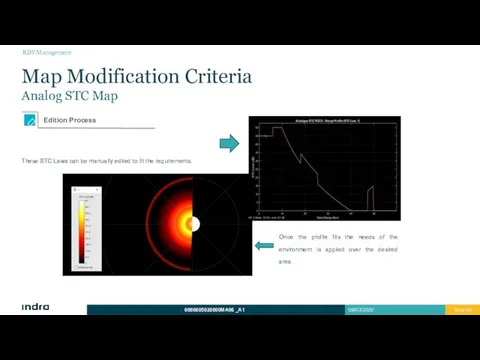
- 79. These STC Laws can be manually edited to fit the requirements. Once the profile fits the
- 80. The Receiver Status Map usually stays as default. In some circumstances of loses, the range of
- 81. The first step is choosing the configuration of the beam that needs to be applied, and
- 82. The Digital STC Map is meant to stablish thresholds for those areas with high clutter that
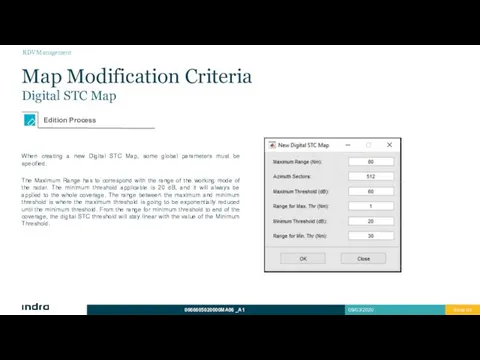
- 83. When creating a new Digital STC Map, some global parameters must be specified. The Maximum Range
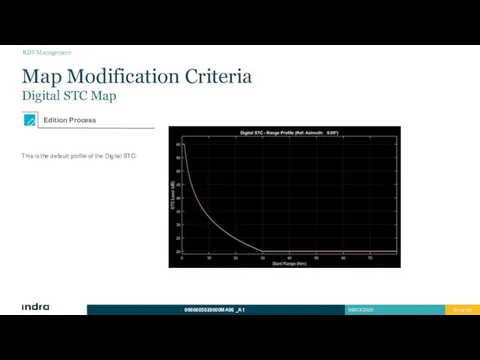
- 84. This is the default profile of the Digital STC: RDV Management Map Modification Criteria Digital STC
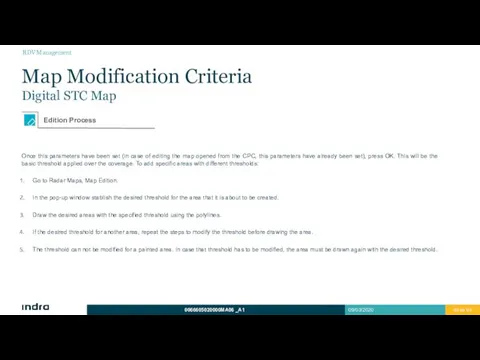
- 85. Once this parameters have been set (in case of editing the map opened from the CPC,
- 86. The Range Profile can be manually modified also. In order to do so, go to Radar
- 87. In the following image the previous range profile has been applied to half of the coverage,
- 88. The application of the different possibilities in the Tracking zones is based on several conditions. As
- 89. The type of area applied depends on the type of false targets over that area. PB
- 90. To edit this map there are several tips to count on: Several Configuration sets can be
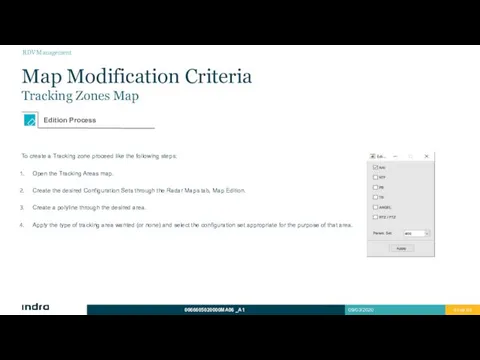
- 91. To create a Tracking zone proceed like the following steps: Open the Tracking Areas map. Create
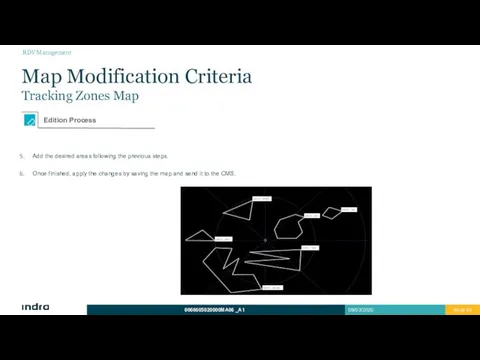
- 92. Add the desired areas following the previous steps. Once finished, apply the changes by saving the
- 94. Скачать презентацию
The data and information, in its totality or partial expression, contained
The data and information, in its totality or partial expression, contained
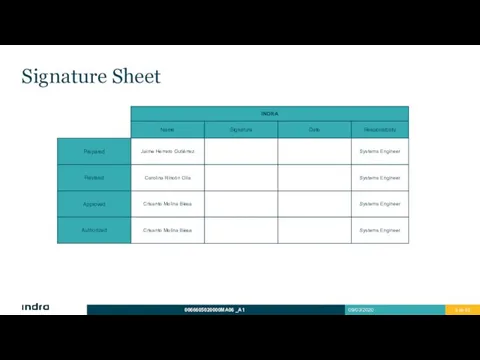
Signature Sheet
Signature Sheet
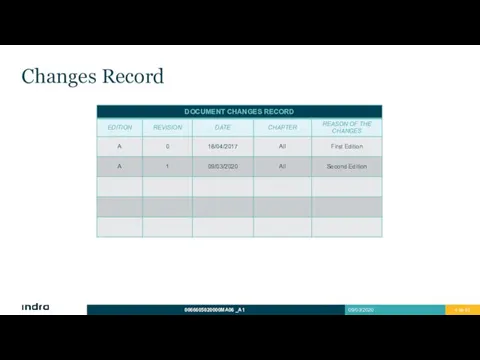
Changes Record
Changes Record
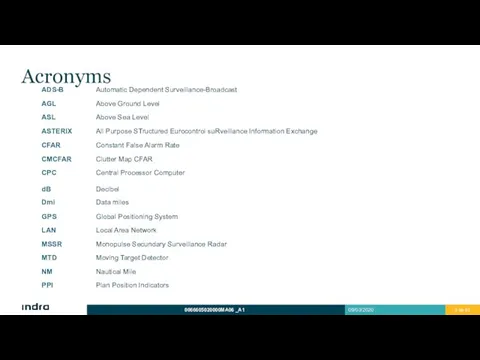
Acronyms
Acronyms
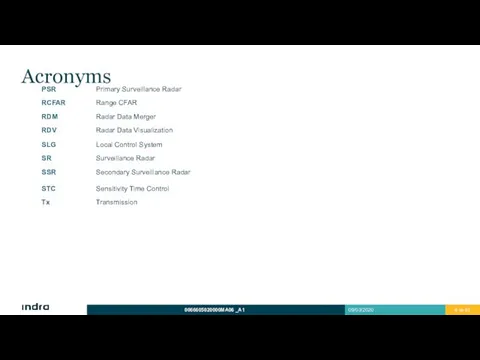
Acronyms
Acronyms
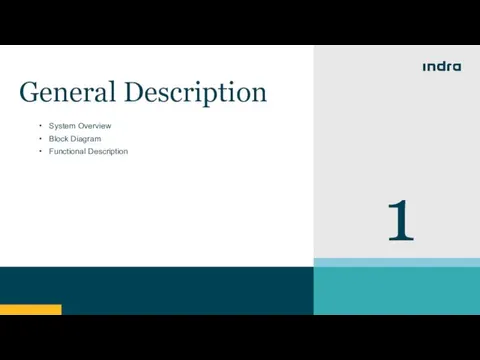
1
General Description
System Overview
Block Diagram
Functional Description
1
General Description
System Overview
Block Diagram
Functional Description
System Overview
The Radar Data Visualization Tool (RDV) consists of an application
System Overview
The Radar Data Visualization Tool (RDV) consists of an application
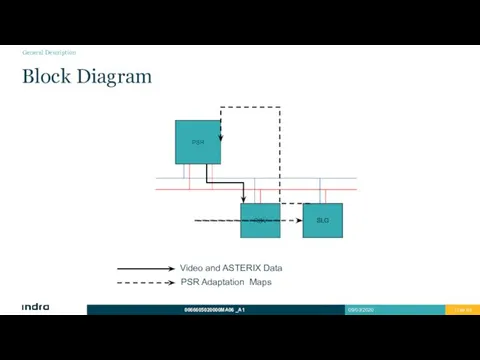
Block Diagram
General Description
Block Diagram
General Description
Functional Description
The main of RDV are:
Radar Data: Visualization and recordings of
Functional Description
The main of RDV are:
Radar Data: Visualization and recordings of
2
Operation & Monitoring
Features
Main Screen
Menu Bar
Toolbar
2
Operation & Monitoring
Features
Main Screen
Menu Bar
Toolbar
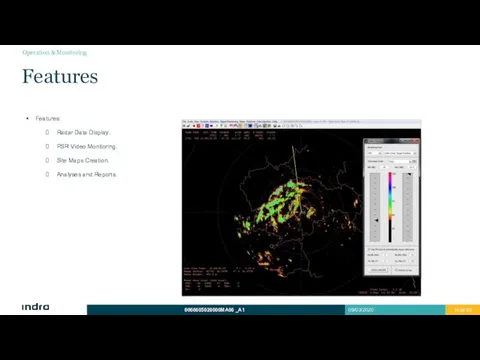
Features
Features:
Radar Data Display.
PSR Video Monitoring.
Site Maps Creation.
Analyses and Reports.
Operation & Monitoring
Features
Features:
Radar Data Display.
PSR Video Monitoring.
Site Maps Creation.
Analyses and Reports.
Operation & Monitoring
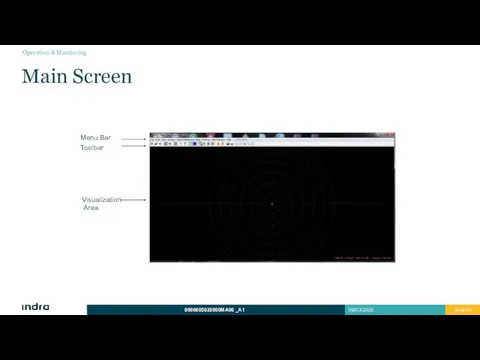
Main Screen
Menu Bar
Toolbar
Visualization Area
Operation & Monitoring
Main Screen
Menu Bar
Toolbar
Visualization Area
Operation & Monitoring
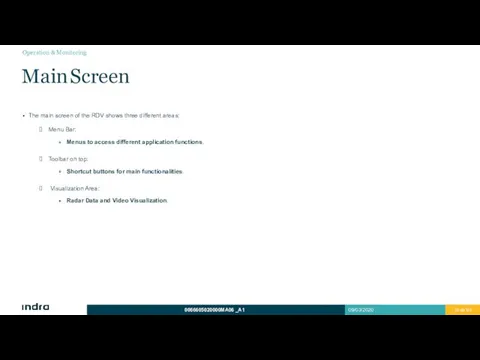
The main screen of the RDV shows three different areas:
Menu Bar:
Menus
The main screen of the RDV shows three different areas:
Menu Bar:
Menus
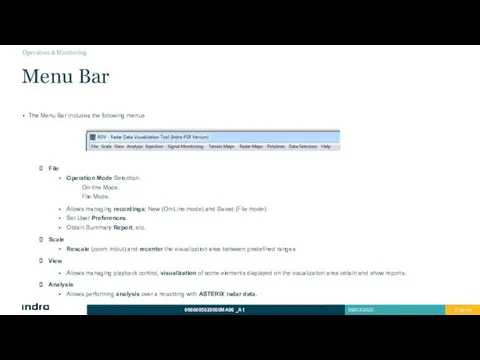
The Menu Bar includes the following menus
File
Operation Mode Selection.
On-line Mode.
The Menu Bar includes the following menus
File
Operation Mode Selection.
On-line Mode.
The Menu Bar includes the following menus
Injection
Analogue and Digital signal injection
The Menu Bar includes the following menus
Injection
Analogue and Digital signal injection
The Menu Bar includes the following menus
Data Selection
Filter and edition of
The Menu Bar includes the following menus
Data Selection
Filter and edition of
Set On-Line Mode: Displays real-time data when the RDV is properly
Set On-Line Mode: Displays real-time data when the RDV is properly
Menu Scale: Rescale the visualization area using the range units set
Menu Scale: Rescale the visualization area using the range units set
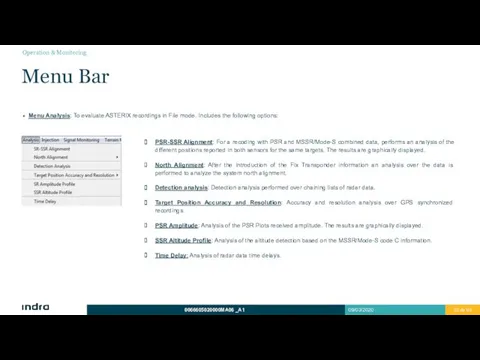
Menu Analysis: To evaluate ASTERIX recordings in File mode. Includes the
Menu Analysis: To evaluate ASTERIX recordings in File mode. Includes the
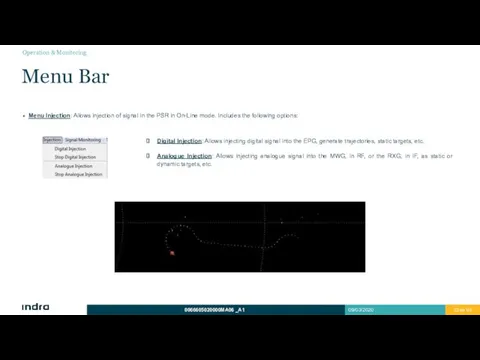
Menu Injection: Allows injection of signal in the PSR in On-Line
Menu Injection: Allows injection of signal in the PSR in On-Line
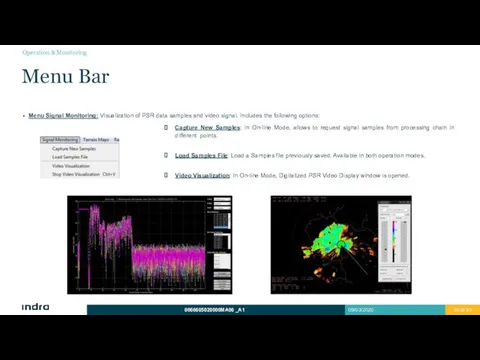
Menu Signal Monitoring: Visualization of PSR data samples and video signal.
Menu Signal Monitoring: Visualization of PSR data samples and video signal.
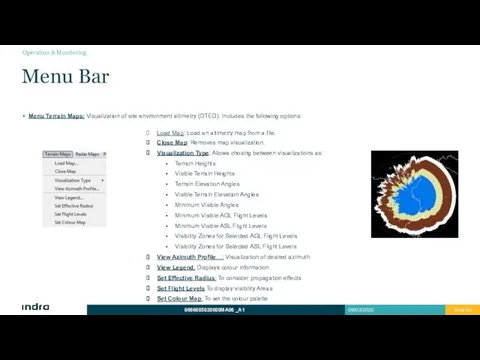
Menu Terrain Maps: Visualization of site environment altimetry (DTED). Includes the
Menu Terrain Maps: Visualization of site environment altimetry (DTED). Includes the
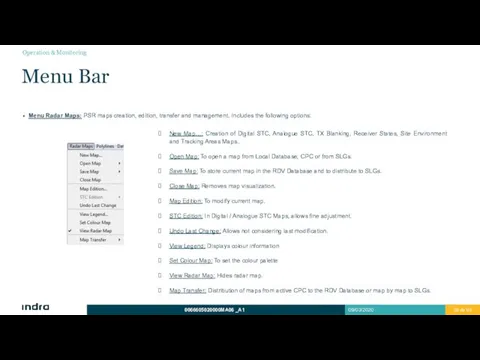
Menu Radar Maps: PSR maps creation, edition, transfer and management. Includes
Menu Radar Maps: PSR maps creation, edition, transfer and management. Includes
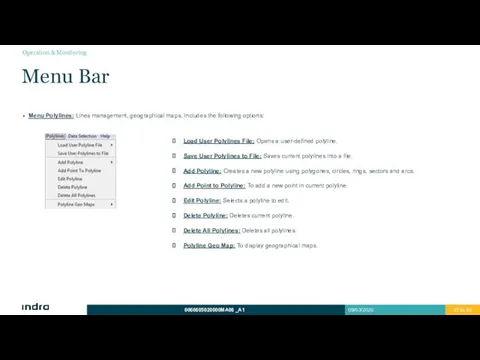
Menu Polylines: Lines management, geographical maps. Includes the following options:
Menu Bar
Load
Menu Polylines: Lines management, geographical maps. Includes the following options:
Menu Bar
Load
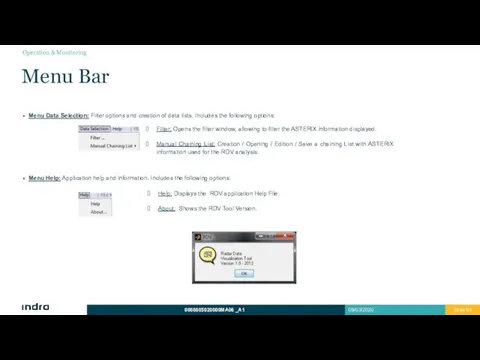
Menu Data Selection: Filter options and creation of data lists. Includes
Menu Data Selection: Filter options and creation of data lists. Includes
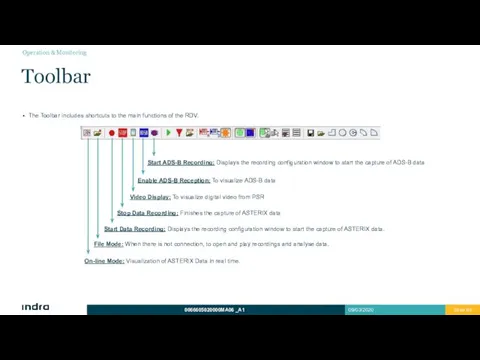
The Toolbar includes shortcuts to the main functions of the RDV.
Toolbar
Operation
The Toolbar includes shortcuts to the main functions of the RDV.
Toolbar
Operation
The Tolbar in the RDV has shortcuts to the main functions
The Tolbar in the RDV has shortcuts to the main functions
The Toolbar in the RDV has shortcuts to the main functions
The Toolbar in the RDV has shortcuts to the main functions
3
Operation Mode
Operation Modes
On-Line Mode
File Mode
3
Operation Mode
Operation Modes
On-Line Mode
File Mode
The RDV is able to work in two different modes:
On-line Mode.
When
The RDV is able to work in two different modes:
On-line Mode.
When
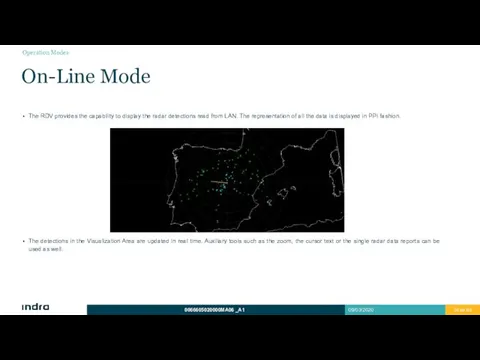
The RDV provides the capability to display the radar detections read
The RDV provides the capability to display the radar detections read
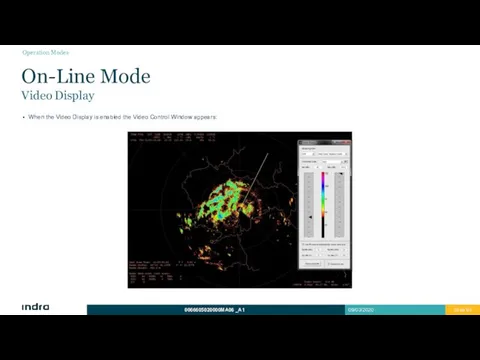
When the Video Display is enabled the Video Control Window appears:
On-Line
When the Video Display is enabled the Video Control Window appears:
On-Line
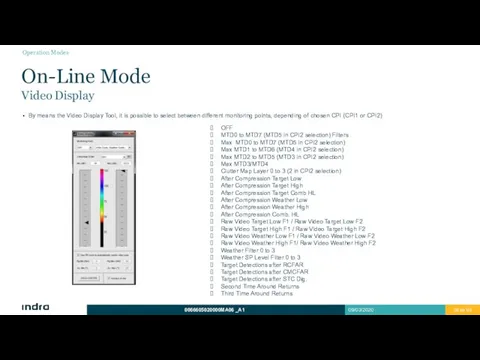
By means the Video Display Tool, it is possible to select
By means the Video Display Tool, it is possible to select
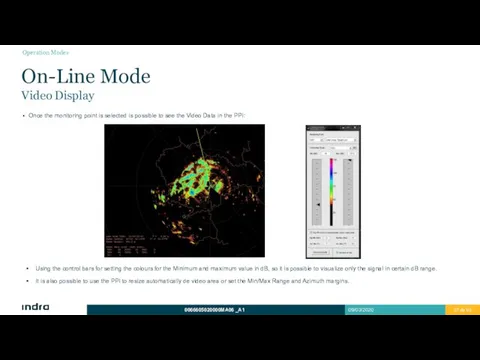
Once the monitoring point is selected is possible to see the
Once the monitoring point is selected is possible to see the
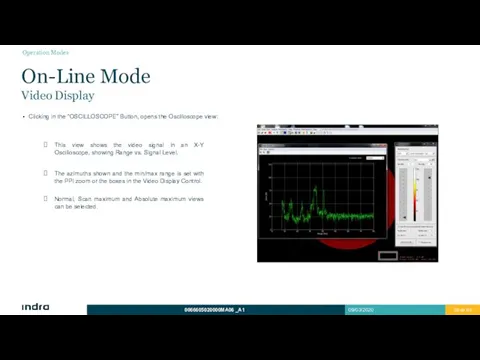
Clicking in the “OSCILLOSCOPE” Button, opens the Oscilloscope view:
On-Line Mode
Video Display
This
Clicking in the “OSCILLOSCOPE” Button, opens the Oscilloscope view:
On-Line Mode
Video Display
This
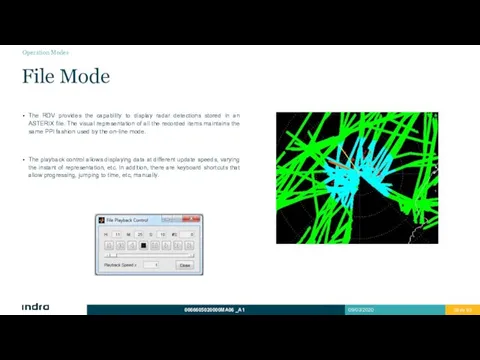
The RDV provides the capability to display radar detections stored in
The RDV provides the capability to display radar detections stored in
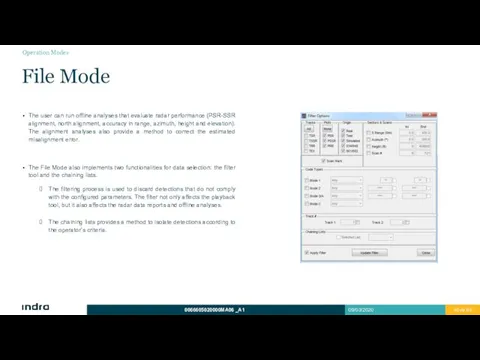
The user can run offline analyses that evaluate radar performance (PSR-SSR
The user can run offline analyses that evaluate radar performance (PSR-SSR
4
Analysis
PSR-SSR Range Alignment
North Alignment
Detection
Target Position Accuracy and Resolution
PSR Amplitude Profile
SSR Altitude
4
Analysis
PSR-SSR Range Alignment
North Alignment
Detection
Target Position Accuracy and Resolution
PSR Amplitude Profile
SSR Altitude
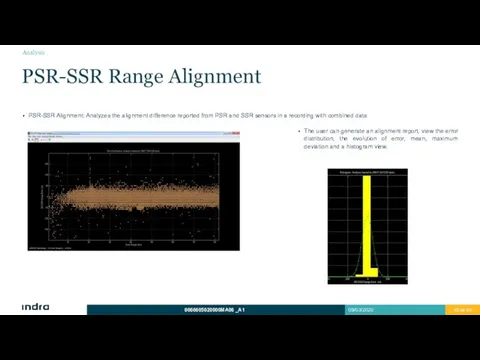
PSR-SSR Alignment: Analyzes the alignment difference reported from PSR and SSR
PSR-SSR Alignment: Analyzes the alignment difference reported from PSR and SSR
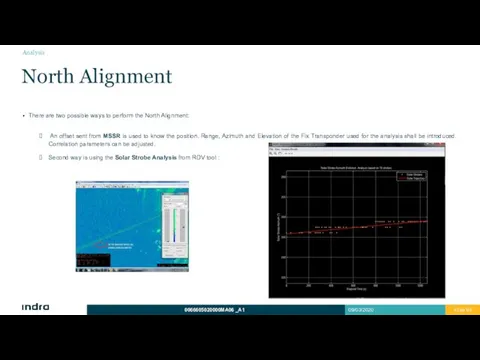
There are two possible ways to perform the North Alignment:
An
There are two possible ways to perform the North Alignment:
An
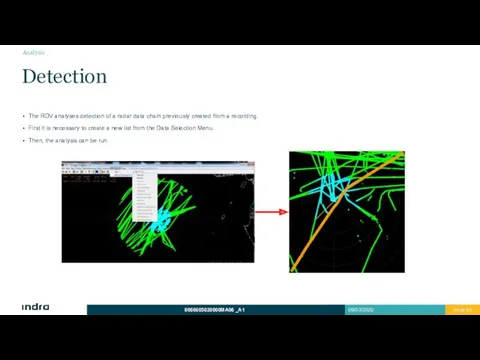
The RDV analyses detection of a radar data chain previously created
The RDV analyses detection of a radar data chain previously created
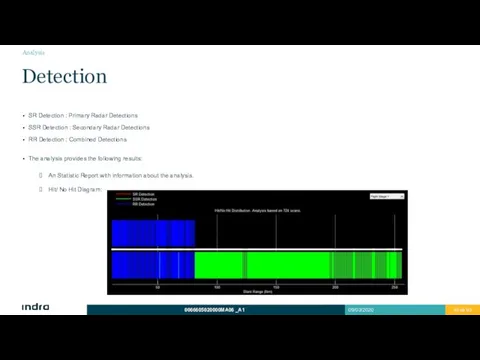
SR Detection : Primary Radar Detections
SSR Detection : Secondary Radar Detections
RR
SR Detection : Primary Radar Detections
SSR Detection : Secondary Radar Detections
RR
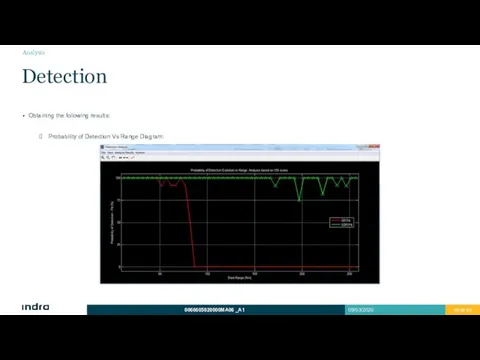
Obtaining the following results:
Probability of Detection Vs Range Diagram:
Detection
Analysis
Obtaining the following results:
Probability of Detection Vs Range Diagram:
Detection
Analysis
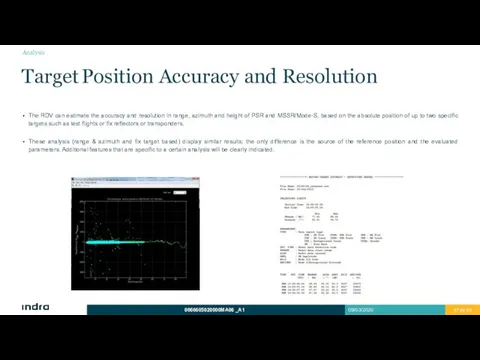
The RDV can estimate the accuracy and resolution in range, azimuth
The RDV can estimate the accuracy and resolution in range, azimuth
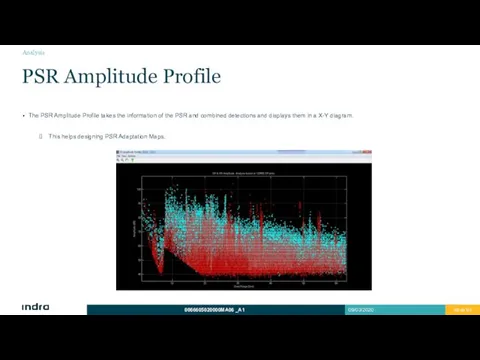
The PSR Amplitude Profile takes the information of the PSR and
The PSR Amplitude Profile takes the information of the PSR and
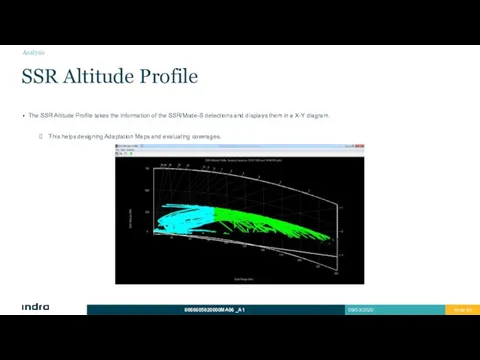
The SSR Altitude Profile takes the information of the SSR/Mode-S detections
The SSR Altitude Profile takes the information of the SSR/Mode-S detections
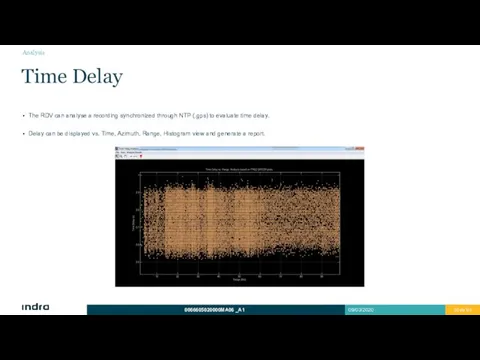
The RDV can analyse a recording synchronized through NTP (.gps) to
The RDV can analyse a recording synchronized through NTP (.gps) to
5
RDV Management
Maps
Functionalities
Map Modification Criteria
5
RDV Management
Maps
Functionalities
Map Modification Criteria
Maps
Optimization Maps
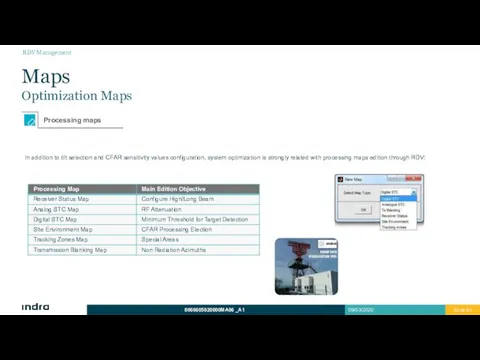
In addition to tilt selection and CFAR sensitivity values configuration,
Maps
Optimization Maps
In addition to tilt selection and CFAR sensitivity values configuration,
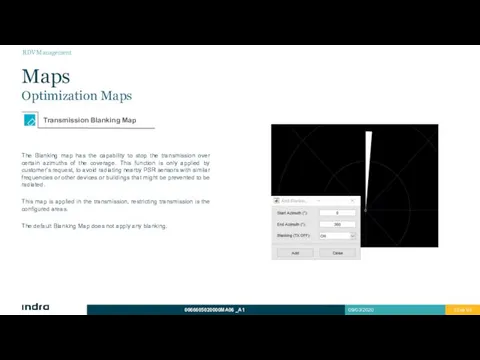
The Blanking map has the capability to stop the transmission over
The Blanking map has the capability to stop the transmission over
The analog STC Map is usually configured the first one by
The analog STC Map is usually configured the first one by
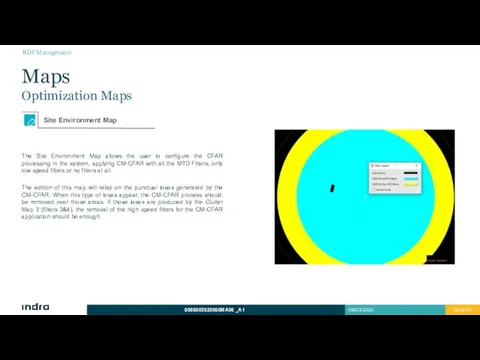
The Site Environment Map allows the user to configure the CFAR
The Site Environment Map allows the user to configure the CFAR
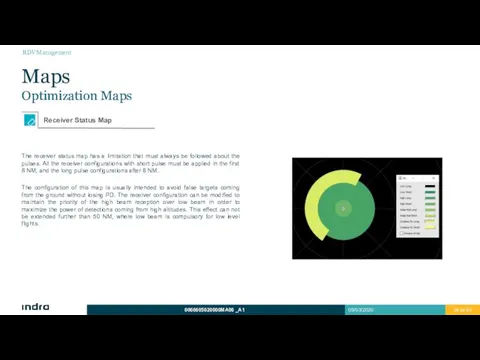
The receiver status map has a limitation that must always be
The receiver status map has a limitation that must always be
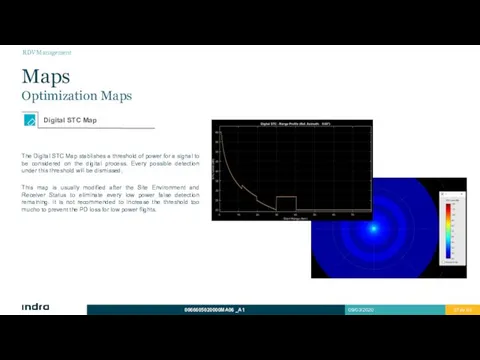
The Digital STC Map stablishes a threshold of power for a
The Digital STC Map stablishes a threshold of power for a
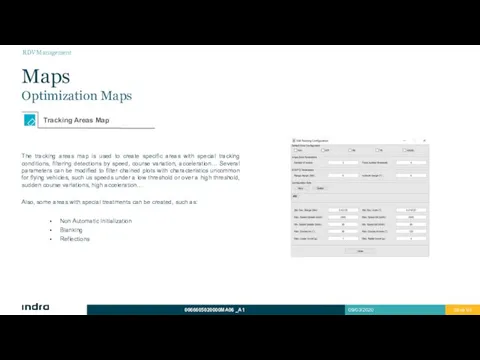
The tracking areas map is used to create specific areas with
The tracking areas map is used to create specific areas with
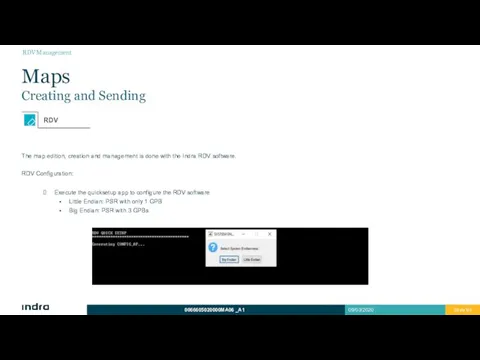
The map edition, creation and management is done with the Indra
The map edition, creation and management is done with the Indra
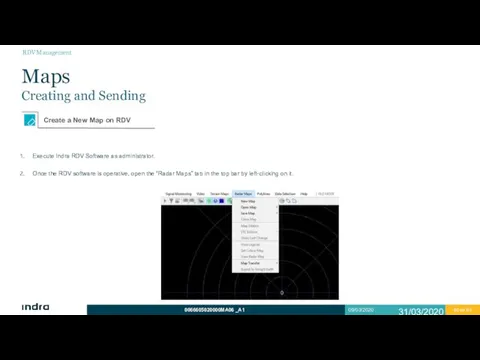
Execute Indra RDV Software as administrator.
Once the RDV software is operative,
Execute Indra RDV Software as administrator.
Once the RDV software is operative,
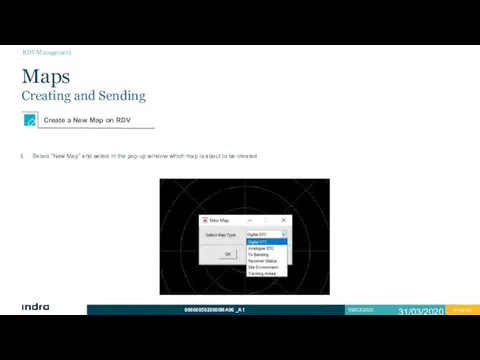
Select “New Map” and select in the pop-up window which map
Select “New Map” and select in the pop-up window which map
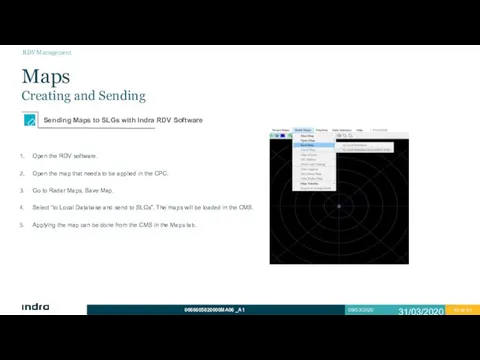
Open the RDV software.
Open the map that needs to be applied
Open the RDV software.
Open the map that needs to be applied
Monitoring
RDV
Monitoring
RDV
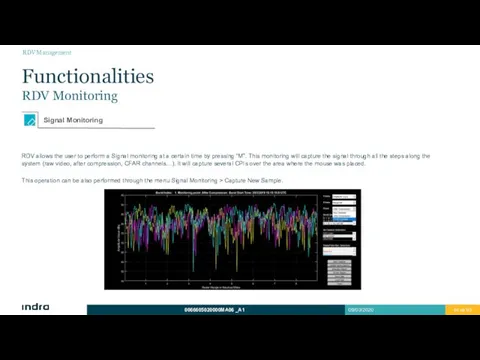
RDV allows the user to perform a Signal monitoring at a
RDV allows the user to perform a Signal monitoring at a
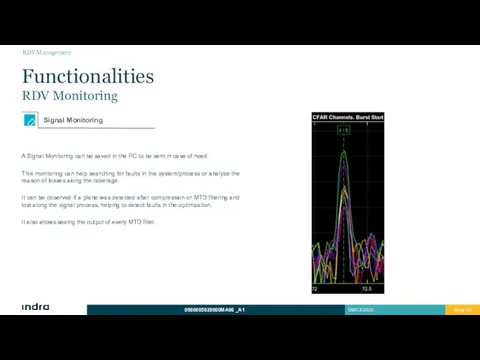
A Signal Monitoring can be saved in the PC to be
A Signal Monitoring can be saved in the PC to be
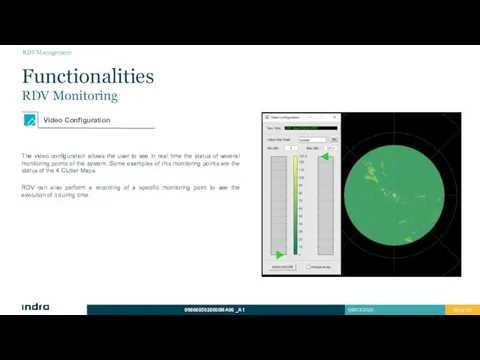
The video configuration allows the user to see in real time
The video configuration allows the user to see in real time
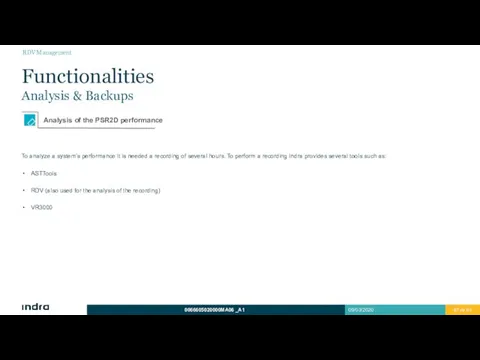
To analyze a system’s performance it is needed a recording of
To analyze a system’s performance it is needed a recording of
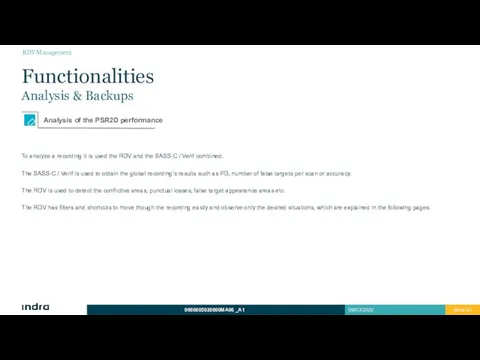
To analyze a recording it is used the RDV and the
To analyze a recording it is used the RDV and the
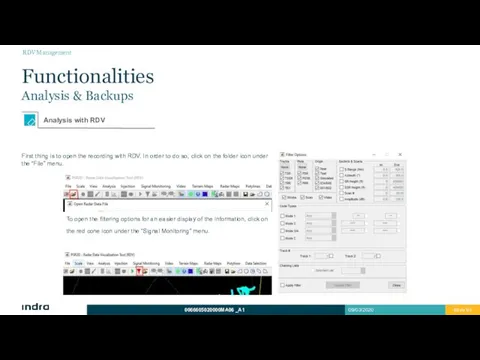
First thing is to open the recording with RDV. In order
First thing is to open the recording with RDV. In order
The following shortcuts allow the user to navigate faster through the
The following shortcuts allow the user to navigate faster through the
RDV can also perform several types of analysis with a recording.
The
RDV can also perform several types of analysis with a recording.
The
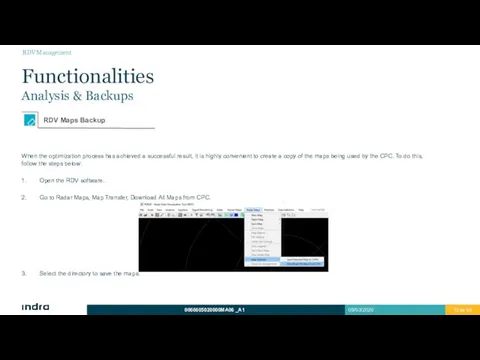
When the optimization process has achieved a successful result, it is
When the optimization process has achieved a successful result, it is
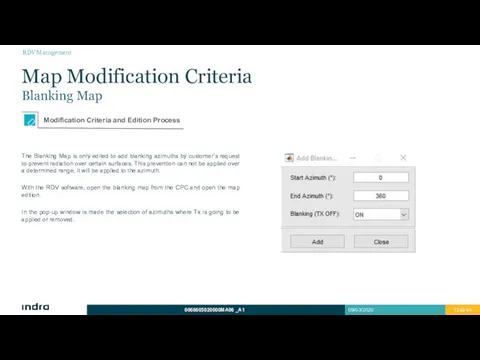
The Blanking Map is only edited to add blanking azimuths by
The Blanking Map is only edited to add blanking azimuths by
The modification of this map is related with a low Pd
The modification of this map is related with a low Pd
To modify the default map, the following steps must be followed:
Open
To modify the default map, the following steps must be followed:
Open
Analog STC Map
Maps Modification Criteria
Analog STC Map
Maps Modification Criteria
This map is not usually modified, because the Indra PSR sensor
This map is not usually modified, because the Indra PSR sensor
The Analog STC Map is edited by the creation and application
The Analog STC Map is edited by the creation and application
These STC Laws can be manually edited to fit the requirements.
Once
These STC Laws can be manually edited to fit the requirements.
Once
The Receiver Status Map usually stays as default. In some circumstances
The Receiver Status Map usually stays as default. In some circumstances
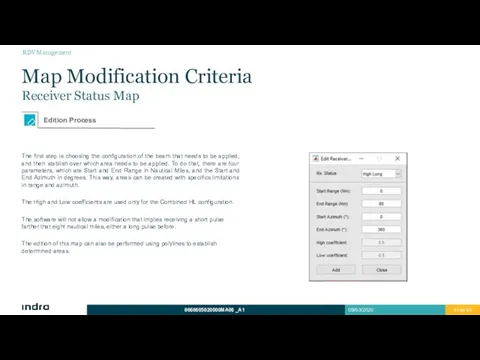
The first step is choosing the configuration of the beam that
The first step is choosing the configuration of the beam that
The Digital STC Map is meant to stablish thresholds for those
The Digital STC Map is meant to stablish thresholds for those
When creating a new Digital STC Map, some global parameters must
When creating a new Digital STC Map, some global parameters must
This is the default profile of the Digital STC:
RDV Management
Map Modification
This is the default profile of the Digital STC:
RDV Management
Map Modification
Once this parameters have been set (in case of editing the
Once this parameters have been set (in case of editing the
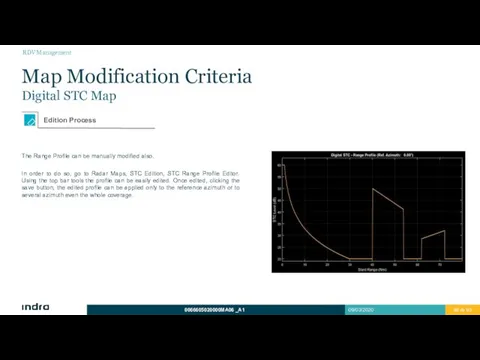
The Range Profile can be manually modified also.
In order to do
The Range Profile can be manually modified also.
In order to do
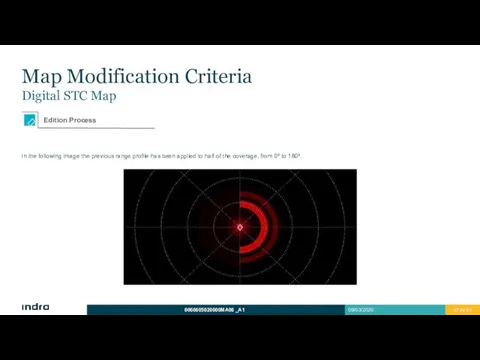
In the following image the previous range profile has been applied
In the following image the previous range profile has been applied
The application of the different possibilities in the Tracking zones is
The application of the different possibilities in the Tracking zones is
The type of area applied depends on the type of false
The type of area applied depends on the type of false
To edit this map there are several tips to count on:
Several
To edit this map there are several tips to count on:
Several
To create a Tracking zone proceed like the following steps:
Open the
To create a Tracking zone proceed like the following steps:
Open the
Add the desired areas following the previous steps.
Once finished, apply the
Add the desired areas following the previous steps.
Once finished, apply the
 Обработка детали по управляющей программе
 викторина
 Лучевая диагностика в нефрологии и урологии
 Momente
 Особенности развития ребенка с нарушением интеллекта в раннем возрасте
 Труд людей весной. 1 класс
 Вести со всей планеты
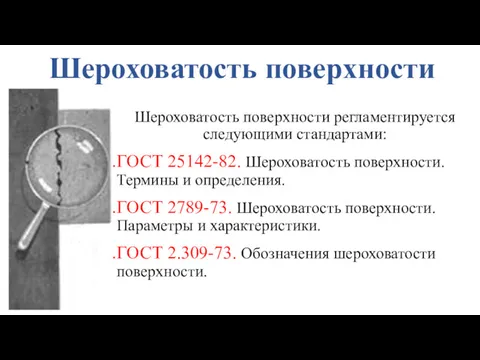 Шероховатость поверхности
 Аутоиммунные энцефалиты
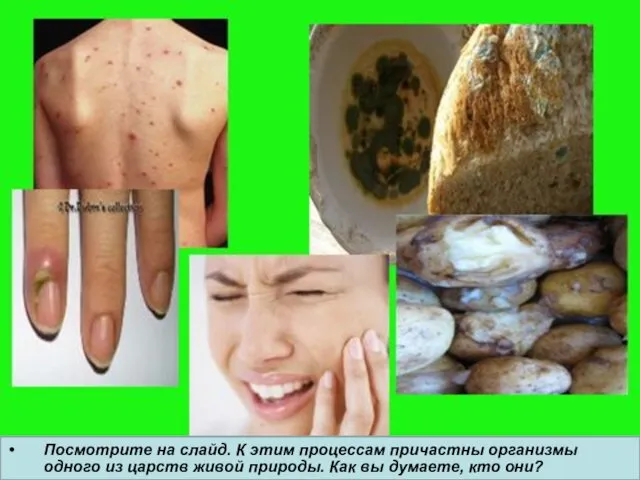 Царство бактерии
 Как родилась книга.
 Классный час с презентацией на тему Олимпиада 2014
 Основы журналистики
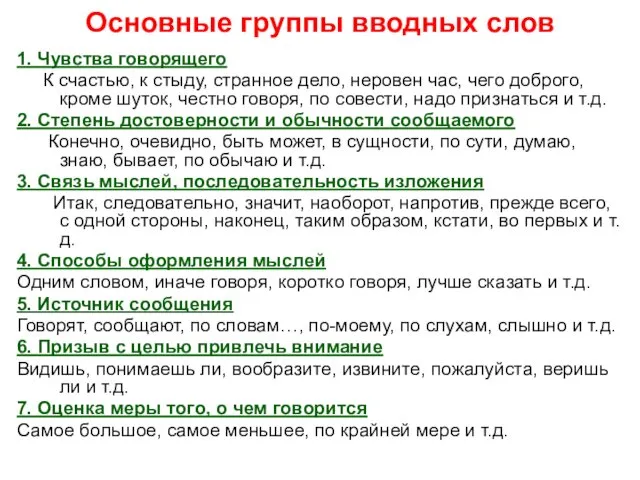 Основные группы вводных слов
 Холодильники
 Принцип работы цифрового фотоаппарата
 Дополнительный_материал_11.45_15.02.2024_118afd64
 ЛОЛ Веснушки при МБОУ Весеннинской ООШ – участники Всероссийской акции Внимание, дети!.
 Каковы причины Первой мировой войны?
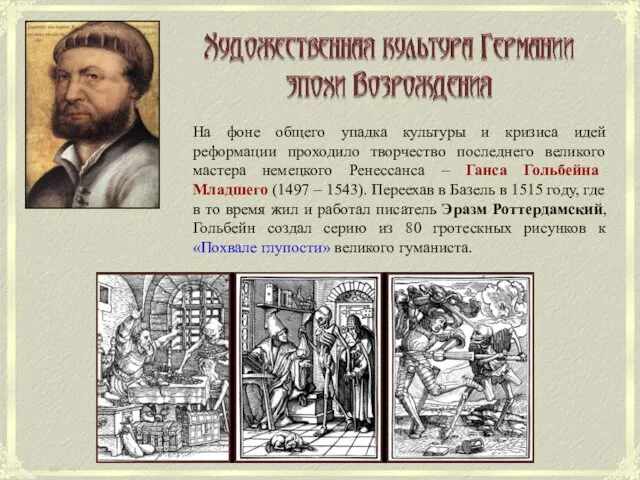 Ганс Гольбейн Младший
 Газонефтеводопроявление (ГНВП)
 Питание и режим рек.
 9_Презентация задание вода
 - 4 ЛЕКЦИИ-Функции и методы менеджмента
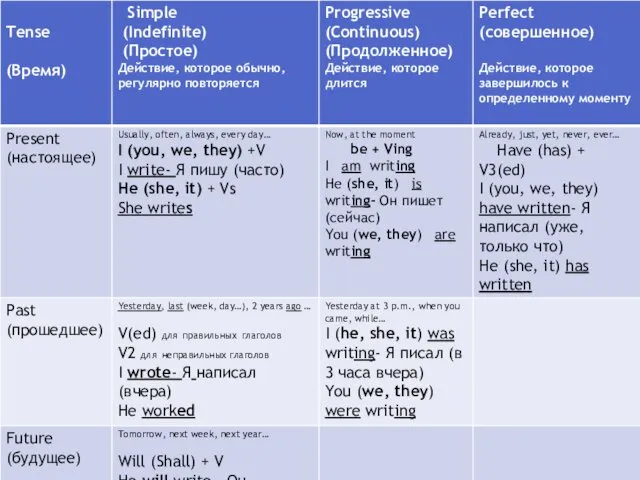 Tense Simple (Indefinite) (Простое), Progressive (Continuous) (Продолженное)
 Диггерство. Понятие диггерство
 Метапредметные результаты освоения ООП
 Описание опыта работы по теме: Развитие познавательной активности учащихся на уроках химии