- Securitization and credit crises

Содержание
- 2. Credit risk transfer instruments Loan Sales Securitization Credit Derivatives Traditional Distress debt Sovereign debt Pass –
- 3. AGENDA: SECURITIZATION The Pass -Through Security (PTS) Collateralized Mortgage Obligation (CMO) Mortgage-Backed Bonds (MBBs) CREDIT CRISIS
- 4. I. SECURITIZATION Securitization is a process of packaging and selling of loans and other assets backed
- 5. The Pass-Through Security Government National Mortgage Association (GNMA) Sponsors MBS programs and acts as a guarantor.
- 6. Major Benefits of Securitisation: lower cost of funding due to the enhanced rating stemming from mixed
- 7. Incentives and Mechanics of Pass-Through Security Creation Example: Assume that Bank has 1000 new residential mortgages
- 8. Mechanics of Pass-Through Security Creation Bank pays annual insurance premium to the FDIC. Assume the deposit
- 9. GNMA Pass-Through process: Creation of the Asset backed security (ABS) Mortgage credit insurance Bank Mortgages 2.
- 10. Calculation of a constant monthly payment of borrowers: Size of the pool: PV = $100 000
- 11. Payment schedule Fully amortized mortgages:
- 12. GNMA Pass-Through process The bank aggregates the payments for mortgages and passes funds through to GNMA
- 13. Further Incentives The attractiveness of these bonds to investors. In particular, investors in these bonds are
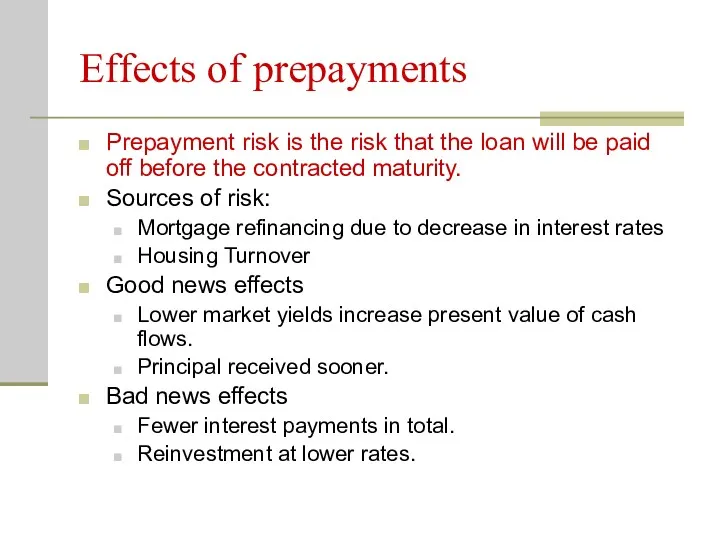
- 14. Effects of prepayments Prepayment risk is the risk that the loan will be paid off before
- 15. Asset Backed Security (continued)
- 16. The Waterfall Equity Tranche 1st loss 2nd loss, if 1st loss is more than 5% 3d
- 17. Collateralized Mortgage Obligations (ABS CMO) were created to manage the prepayment risk Assets Senior Tranche (80%)
- 18. Collateralized Mortgage Obligation (CMO) Prepayment effects differ across tranches (classes) R Class Improves marketability of the
- 19. Mortgage-Backed Bonds (MBBs) Normally remain on the balance sheet. No direct link between the cash flows
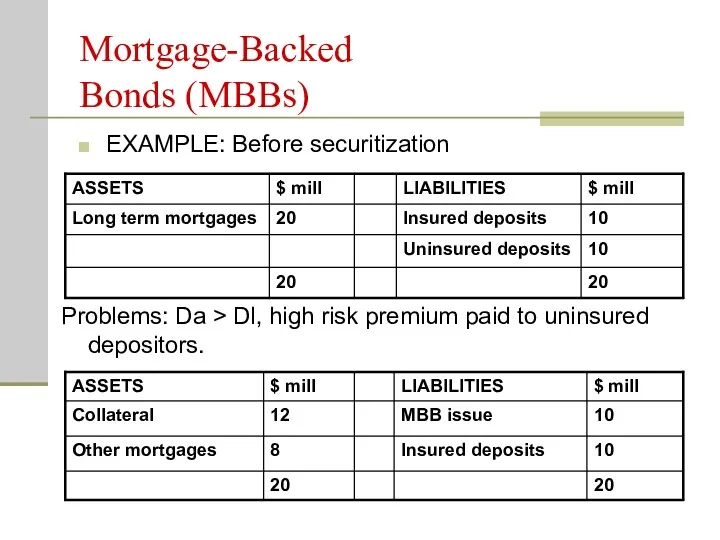
- 20. Mortgage-Backed Bonds (MBBs) EXAMPLE: Before securitization Problems: Da > Dl, high risk premium paid to uninsured
- 21. Mortgage-Backed Bonds (MBBs) Weaknesses: Tied up mortgages on the balance sheet for a long time; Increases
- 22. Securitization of other assets CARDs Various receivables, loans, junk bonds, ARMs. Can all assets be securitized?
- 23. U.S. Real Estate Prices, 1987 to 2009: S&P/Case-Shiller Composite-10 Index Credit Crisis 2007
- 24. What happened… Relaxation of Mortgage standards Starting in 2000, mortgage originators in the US relaxed their
- 25. What happened... Mortgages were packaged in financial products and sold to investors: The most important thing
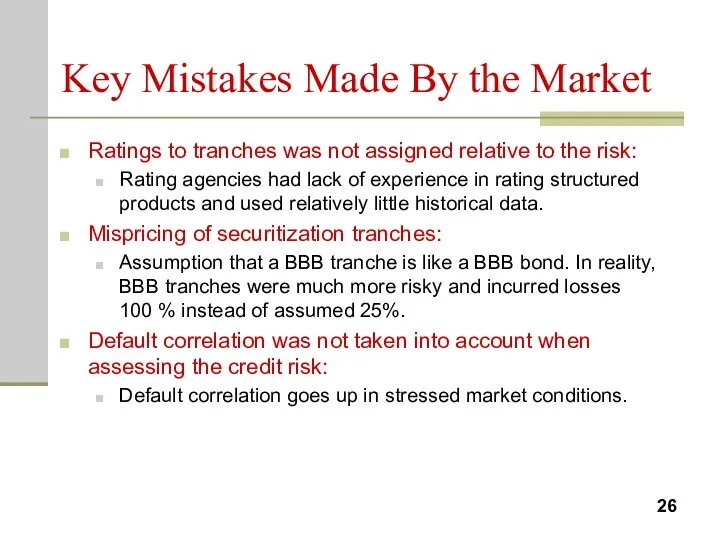
- 26. Key Mistakes Made By the Market Ratings to tranches was not assigned relative to the risk:
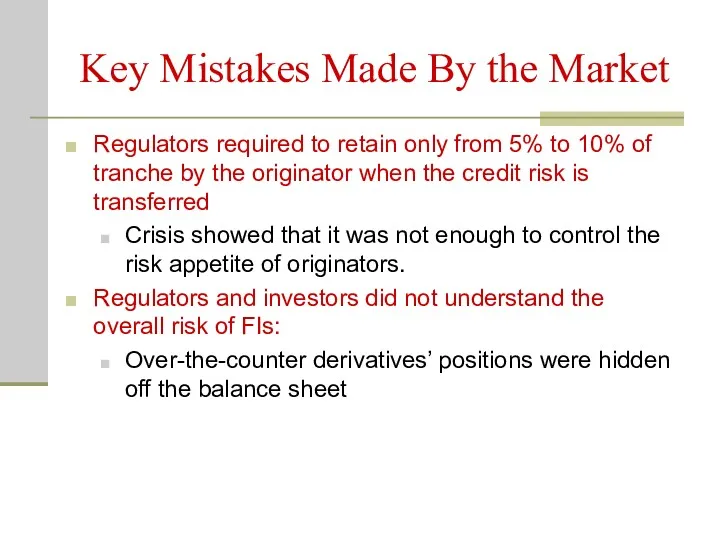
- 27. Key Mistakes Made By the Market Regulators required to retain only from 5% to 10% of
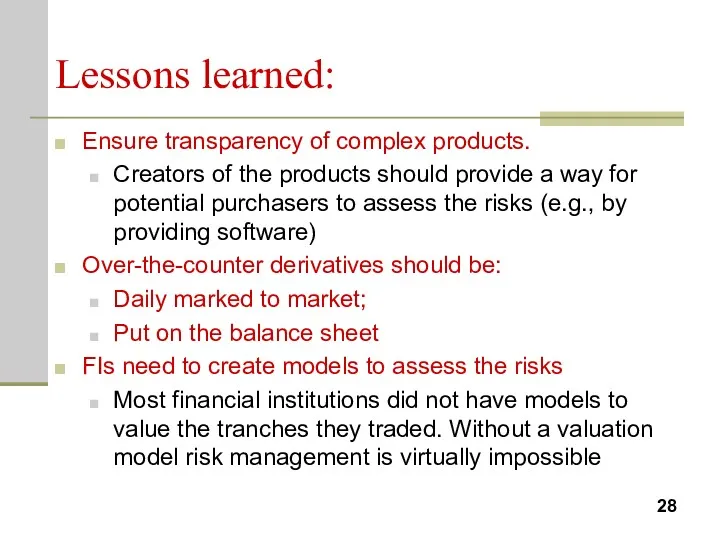
- 28. Lessons learned: Ensure transparency of complex products. Creators of the products should provide a way for
- 29. Lessons learned: More emphasis on stress testing More emphasis on stress testing and managerial judgement; less
- 30. Major Reasons of the Financial Crisis in Kazakhstan Financing of the high credit growth through external
- 31. Why Financial Crisis in Kazakhstan was not so severe as in developed countries? Proportion of foreign
- 32. Real Estate Price Dynamic in Kazakhstan
- 33. Structural changes in Kazakhstani banking industry since 2008.
- 34. Concentration ratios of top five Kazakhstani banks Source: www.afn.kz
- 35. Market share of local bank vs market share of banks with foreign ownership Source: www.afn.kz All
- 37. Скачать презентацию
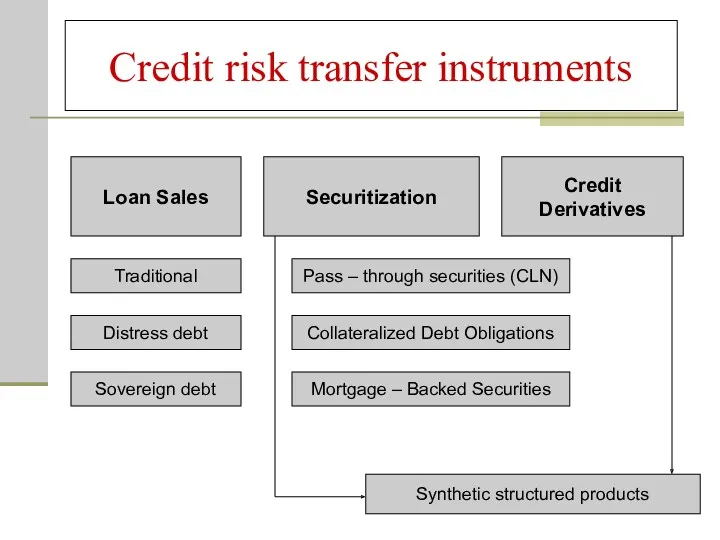
Credit risk transfer instruments
Loan Sales
Securitization
Credit Derivatives
Traditional
Distress debt
Sovereign debt
Pass
Credit risk transfer instruments
Loan Sales
Securitization
Credit Derivatives
Traditional
Distress debt
Sovereign debt
Pass
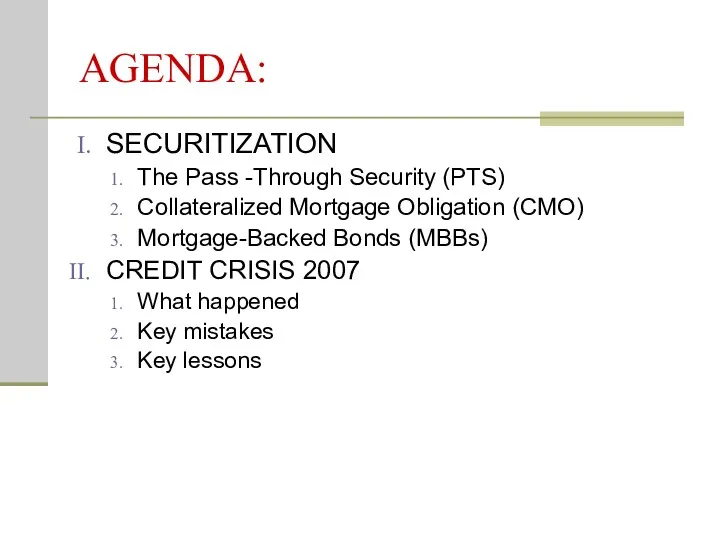
AGENDA:
SECURITIZATION
The Pass -Through Security (PTS)
Collateralized Mortgage Obligation (CMO)
Mortgage-Backed Bonds (MBBs)
CREDIT CRISIS
AGENDA:
SECURITIZATION
The Pass -Through Security (PTS)
Collateralized Mortgage Obligation (CMO)
Mortgage-Backed Bonds (MBBs)
CREDIT CRISIS
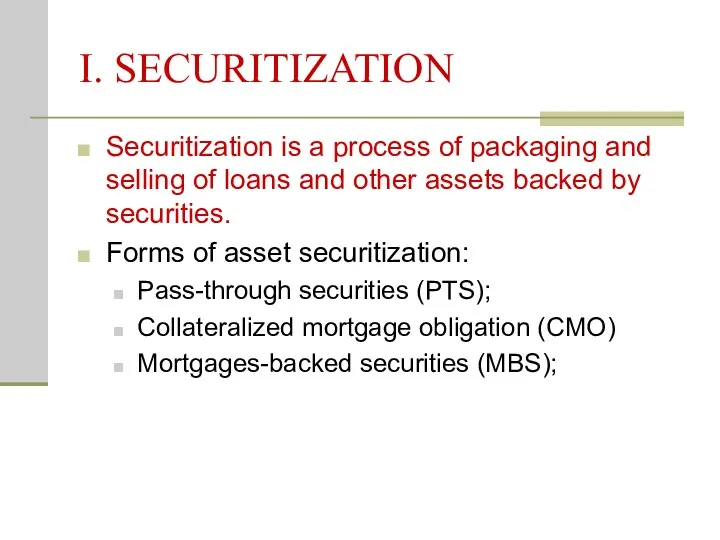
I. SECURITIZATION
Securitization is a process of packaging and selling of loans
I. SECURITIZATION
Securitization is a process of packaging and selling of loans
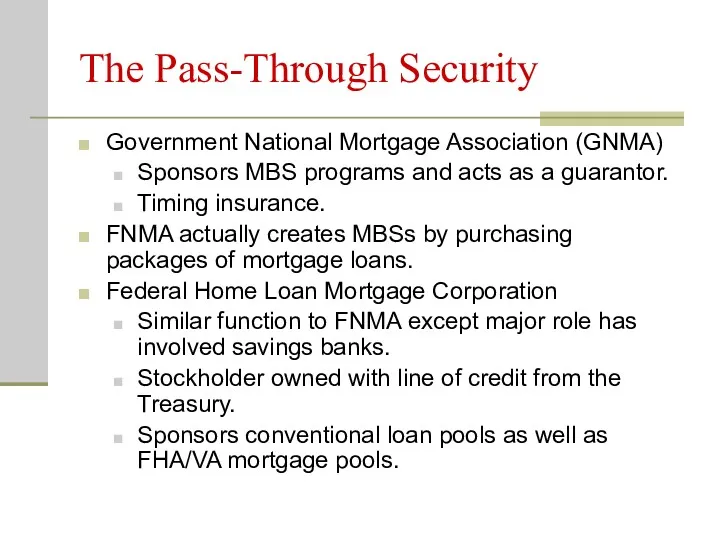
The Pass-Through Security
Government National Mortgage Association (GNMA)
Sponsors MBS programs and acts
The Pass-Through Security
Government National Mortgage Association (GNMA)
Sponsors MBS programs and acts
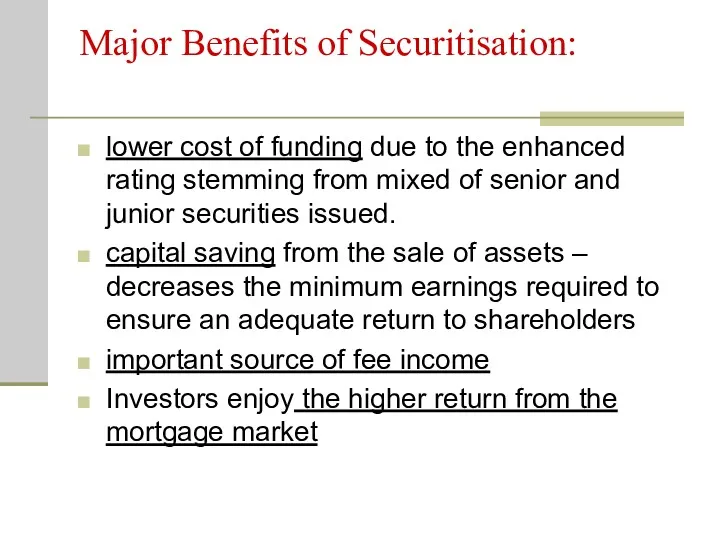
Major Benefits of Securitisation:
lower cost of funding due to the enhanced
Major Benefits of Securitisation:
lower cost of funding due to the enhanced
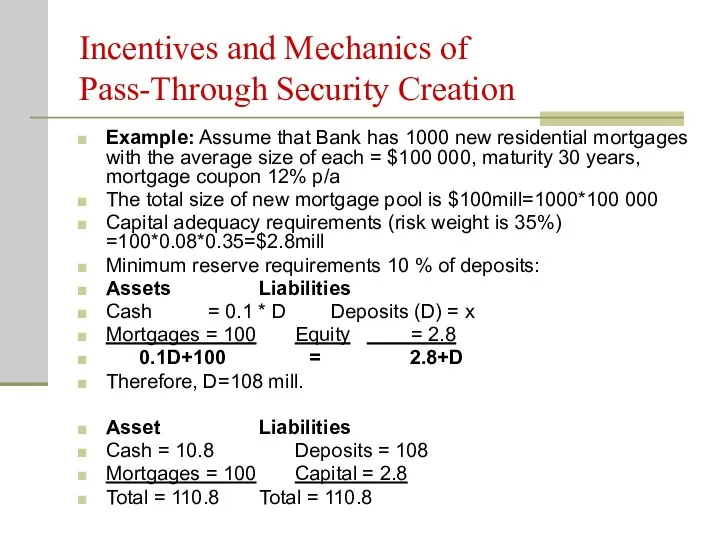
Incentives and Mechanics of
Pass-Through Security Creation
Example: Assume that Bank has
Incentives and Mechanics of
Pass-Through Security Creation
Example: Assume that Bank has
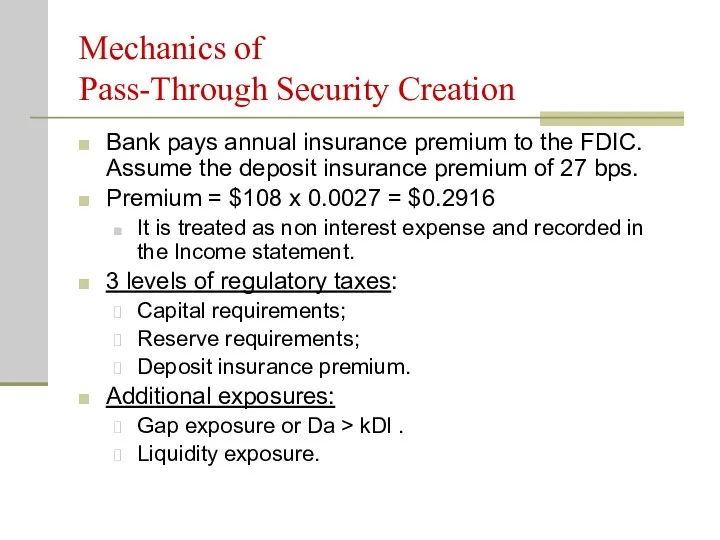
Mechanics of
Pass-Through Security Creation
Bank pays annual insurance premium to the
Mechanics of
Pass-Through Security Creation
Bank pays annual insurance premium to the
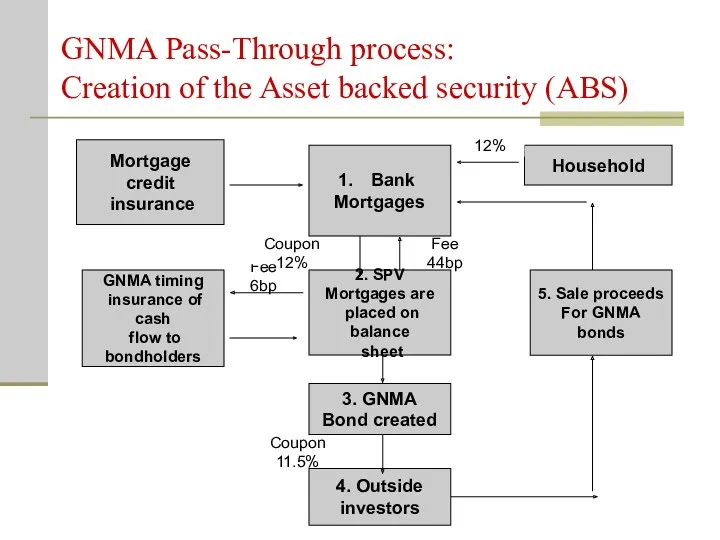
GNMA Pass-Through process:
Creation of the Asset backed security (ABS)
Mortgage credit
insurance
Bank
Mortgages
2.
GNMA Pass-Through process:
Creation of the Asset backed security (ABS)
Mortgage credit
insurance
Bank
Mortgages
2.
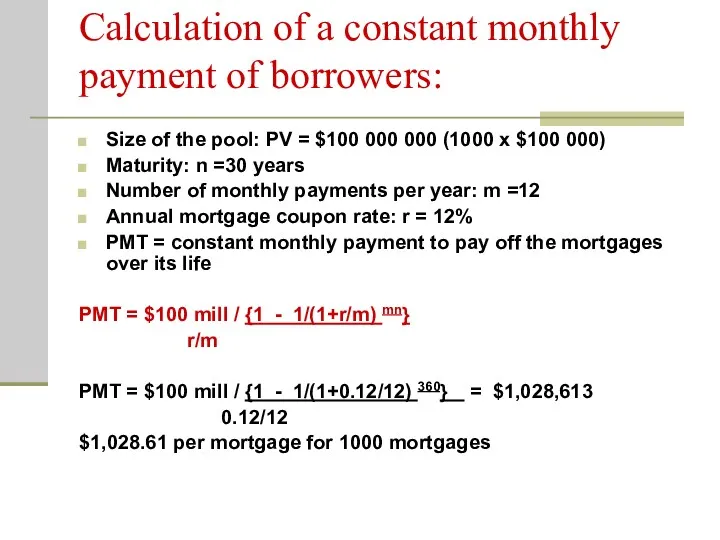
Calculation of a constant monthly payment of borrowers:
Size of the
Calculation of a constant monthly payment of borrowers:
Size of the
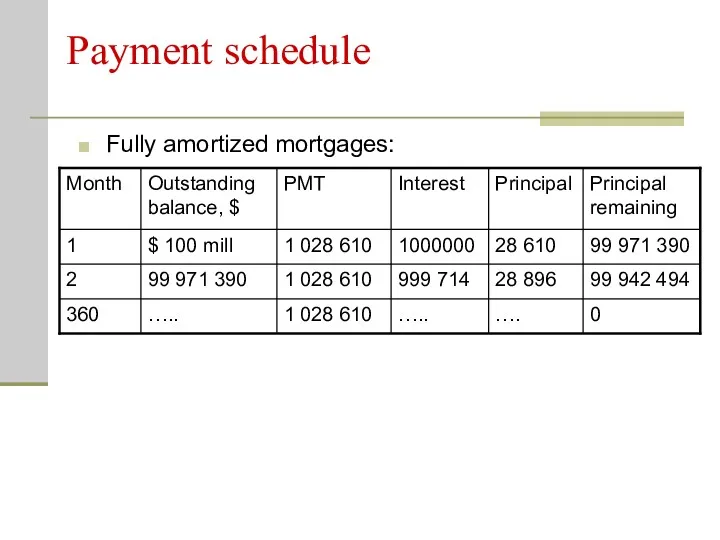
Payment schedule
Fully amortized mortgages:
Payment schedule
Fully amortized mortgages:
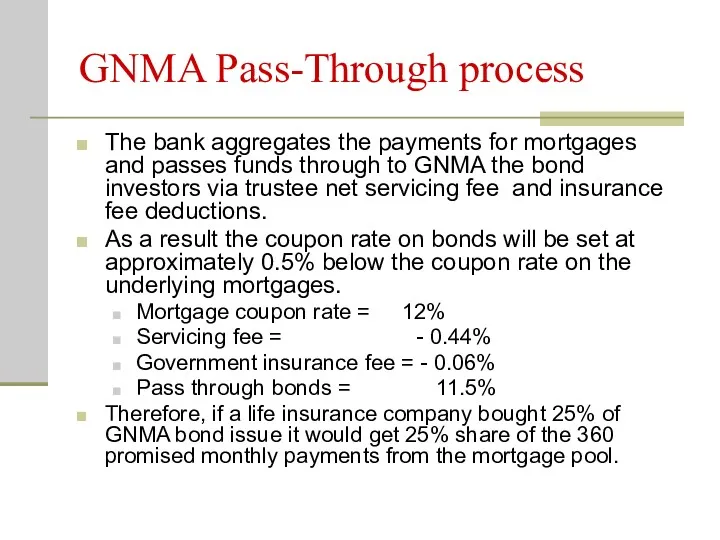
GNMA Pass-Through process
The bank aggregates the payments for mortgages and passes
GNMA Pass-Through process
The bank aggregates the payments for mortgages and passes
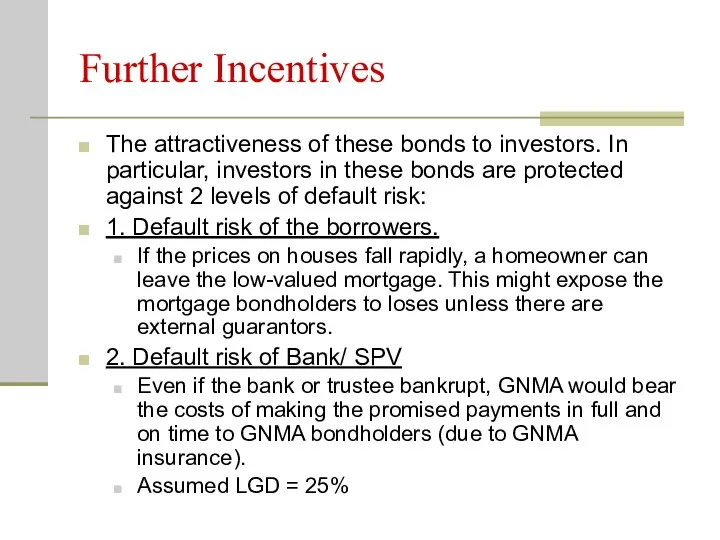
Further Incentives
The attractiveness of these bonds to investors. In particular, investors
Further Incentives
The attractiveness of these bonds to investors. In particular, investors
Effects of prepayments
Prepayment risk is the risk that the loan will
Effects of prepayments
Prepayment risk is the risk that the loan will
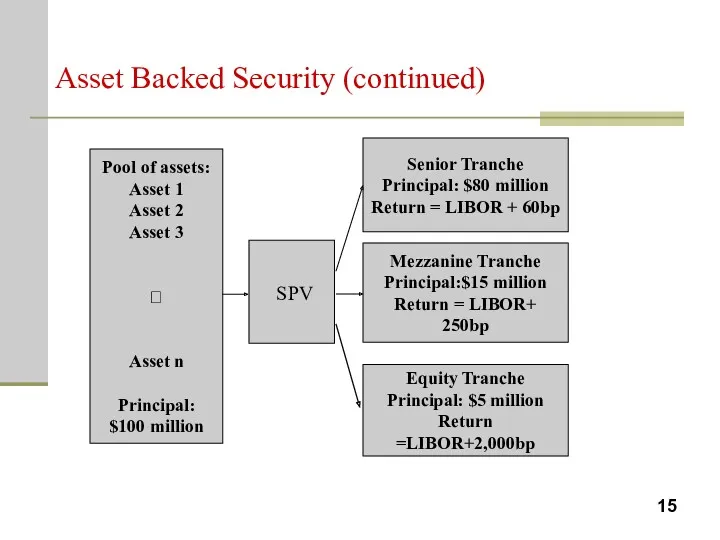
Asset Backed Security (continued)
Asset Backed Security (continued)
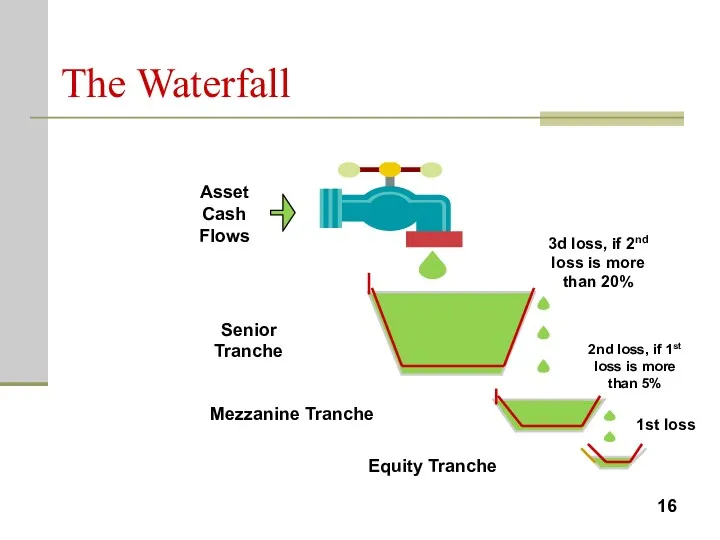
The Waterfall
Equity Tranche
1st loss
2nd loss, if 1st loss is more than
The Waterfall
Equity Tranche
1st loss
2nd loss, if 1st loss is more than
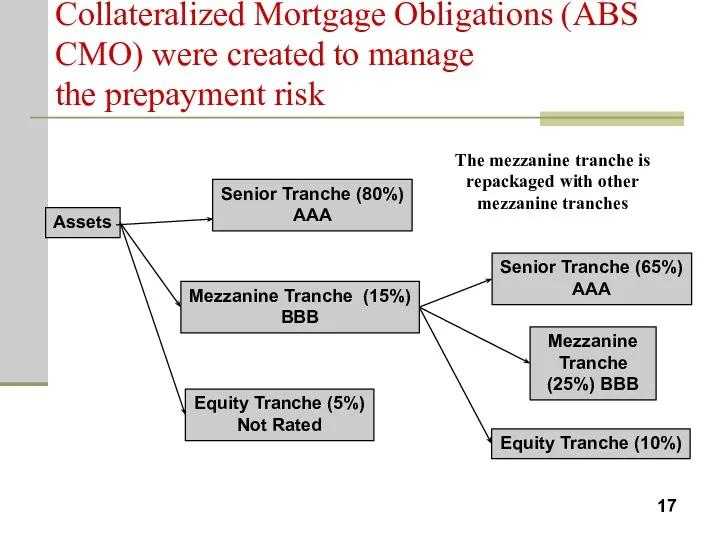
Collateralized Mortgage Obligations (ABS CMO) were created to manage
the prepayment
Collateralized Mortgage Obligations (ABS CMO) were created to manage the prepayment
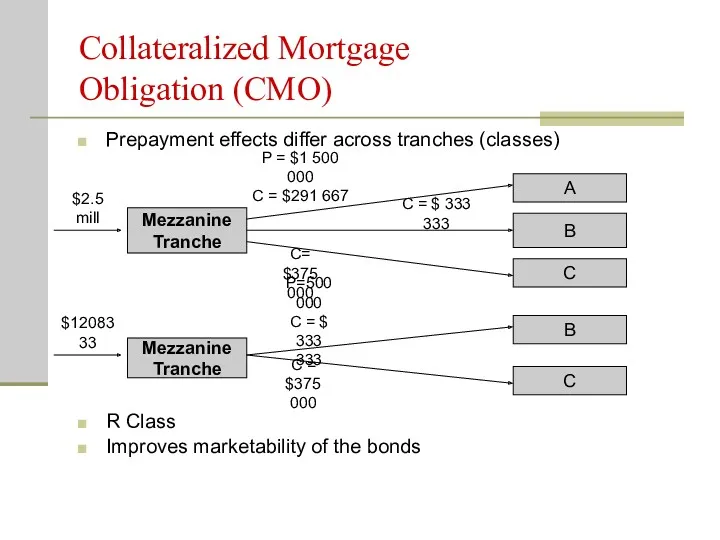
Collateralized Mortgage
Obligation (CMO)
Prepayment effects differ across tranches (classes)
R Class
Improves marketability
Collateralized Mortgage
Obligation (CMO)
Prepayment effects differ across tranches (classes)
R Class
Improves marketability
Mortgage-Backed
Bonds (MBBs)
Normally remain on the balance sheet.
No direct link between
Mortgage-Backed
Bonds (MBBs)
Normally remain on the balance sheet.
No direct link between
Mortgage-Backed
Bonds (MBBs)
EXAMPLE: Before securitization
Problems: Da > Dl, high risk
Mortgage-Backed
Bonds (MBBs)
EXAMPLE: Before securitization
Problems: Da > Dl, high risk
Mortgage-Backed
Bonds (MBBs)
Weaknesses:
Tied up mortgages on the balance sheet for a
Mortgage-Backed
Bonds (MBBs)
Weaknesses:
Tied up mortgages on the balance sheet for a
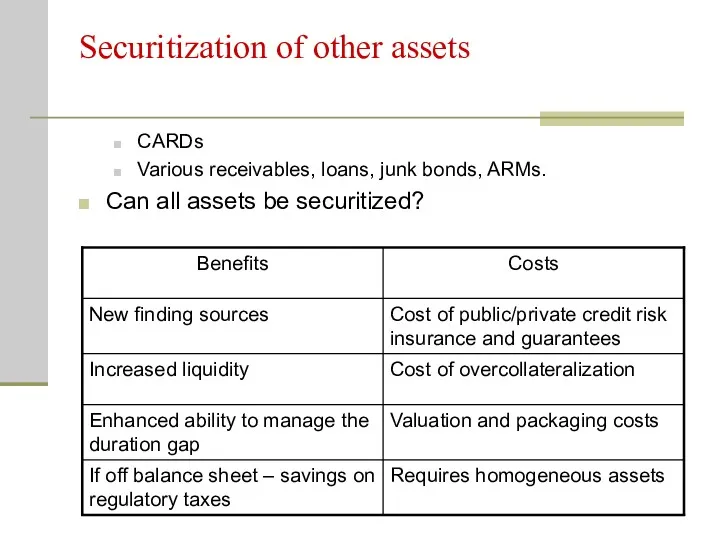
Securitization of other assets
CARDs
Various receivables, loans, junk bonds, ARMs.
Can all assets
Securitization of other assets
CARDs
Various receivables, loans, junk bonds, ARMs.
Can all assets
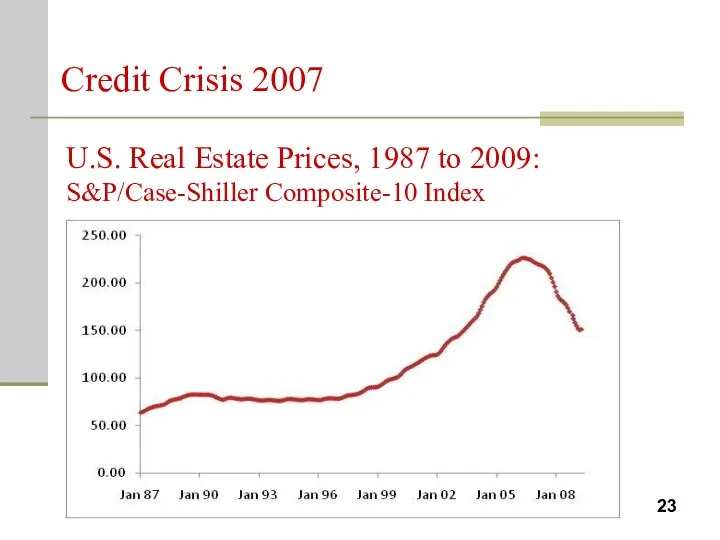
U.S. Real Estate Prices, 1987 to 2009: S&P/Case-Shiller Composite-10 Index
Credit Crisis
U.S. Real Estate Prices, 1987 to 2009: S&P/Case-Shiller Composite-10 Index
Credit Crisis
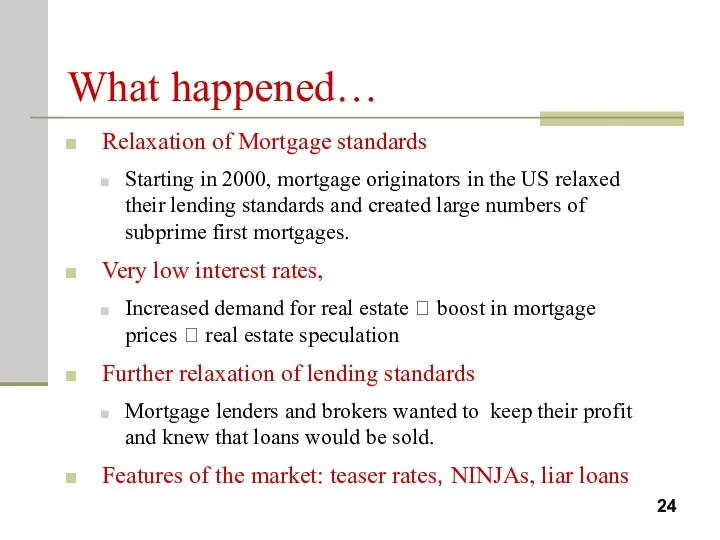
What happened…
Relaxation of Mortgage standards
Starting in 2000, mortgage originators in the
What happened…
Relaxation of Mortgage standards
Starting in 2000, mortgage originators in the
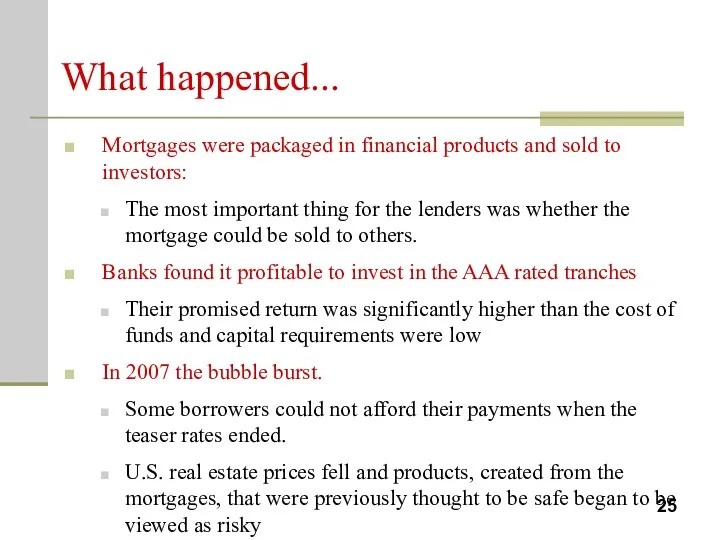
What happened...
Mortgages were packaged in financial products and sold to investors:
The
What happened...
Mortgages were packaged in financial products and sold to investors:
The
Key Mistakes Made By the Market
Ratings to tranches was not assigned
Key Mistakes Made By the Market
Ratings to tranches was not assigned
Key Mistakes Made By the Market
Regulators required to retain only from
Key Mistakes Made By the Market
Regulators required to retain only from
Lessons learned:
Ensure transparency of complex products.
Creators of the products should
Lessons learned:
Ensure transparency of complex products.
Creators of the products should
Lessons learned:
More emphasis on stress testing
More emphasis on stress testing and
Lessons learned:
More emphasis on stress testing
More emphasis on stress testing and
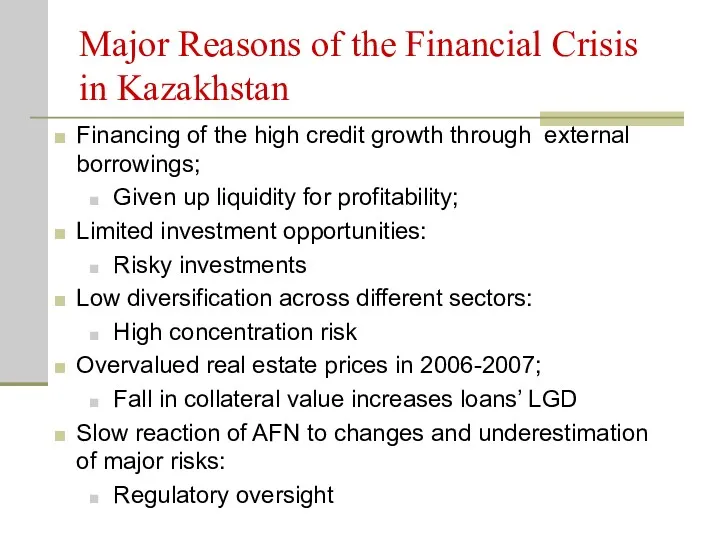
Major Reasons of the Financial Crisis
in Kazakhstan
Financing of the high
Major Reasons of the Financial Crisis
in Kazakhstan
Financing of the high
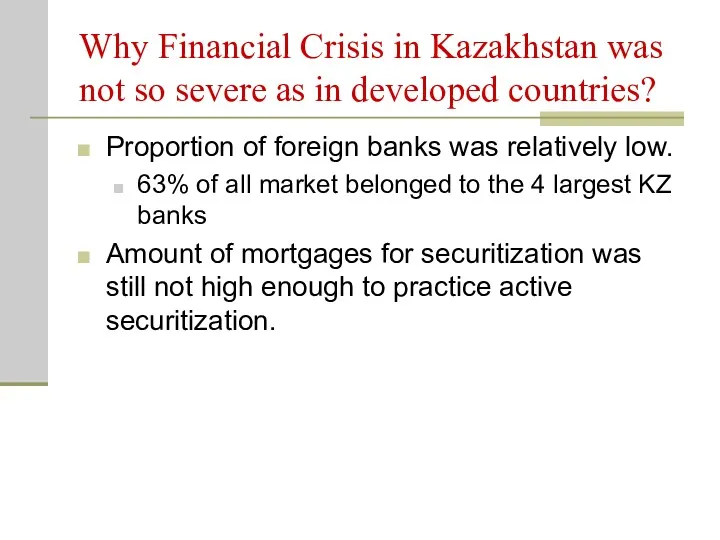
Why Financial Crisis in Kazakhstan was not so severe as in
Why Financial Crisis in Kazakhstan was not so severe as in
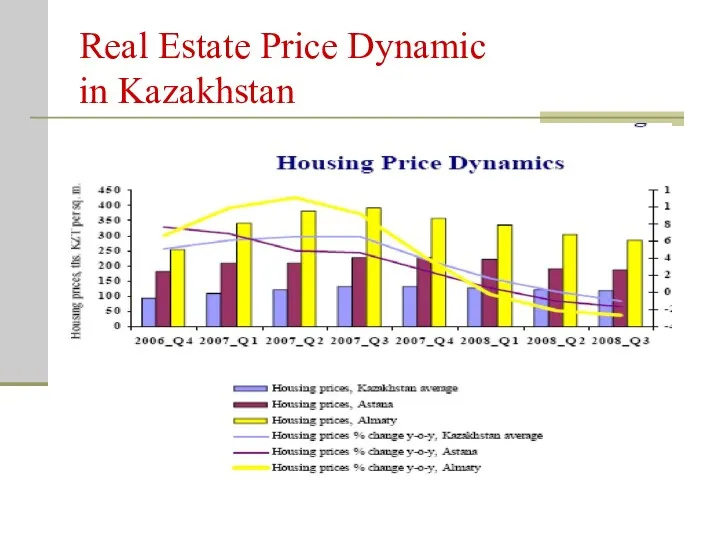
Real Estate Price Dynamic
in Kazakhstan
Real Estate Price Dynamic
in Kazakhstan
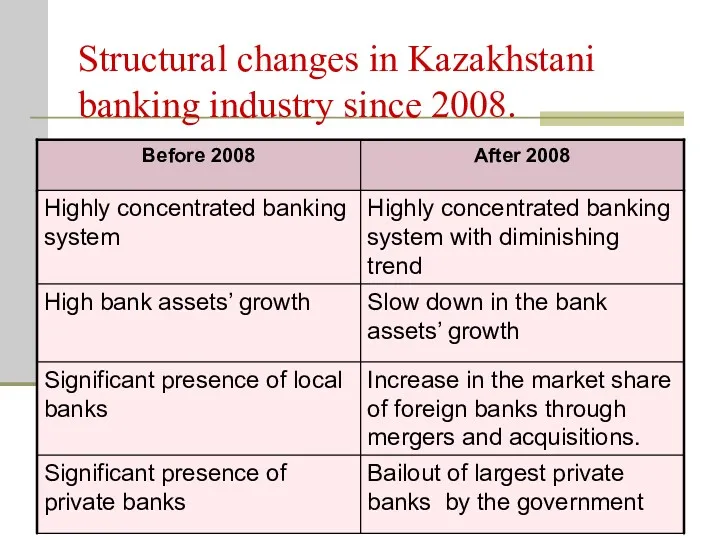
Structural changes in Kazakhstani banking industry since 2008.
Structural changes in Kazakhstani banking industry since 2008.

Concentration ratios of top five Kazakhstani banks
Source: www.afn.kz
Concentration ratios of top five Kazakhstani banks
Source: www.afn.kz
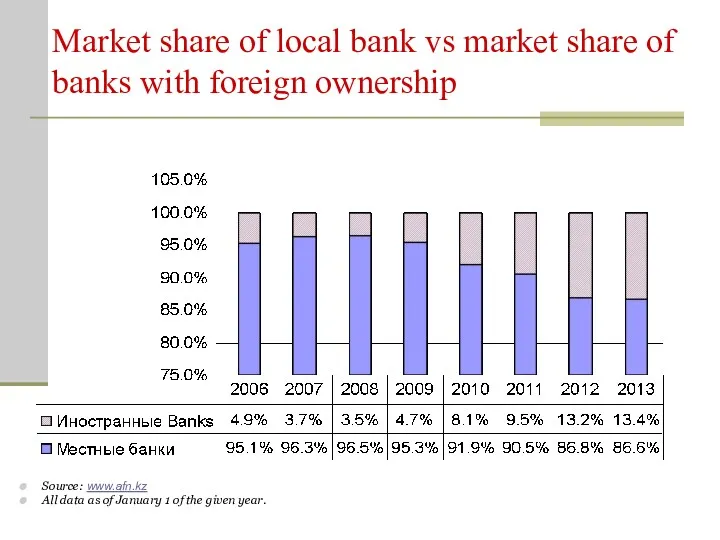
Market share of local bank vs market share of banks with
Market share of local bank vs market share of banks with
 Полимеры в нашей жизни
 Методы биометрической диагностики зубочелюстных аномалий у детей
 Презентация. Игровые технологии на занятиях в ДОУ.
 Психологическая помощь детям и подросткам с отклонениями в развитии. Виды психологической помощи
 Шаблоны пазлов
 Презентация 8 марта для старшего дошкольного возраста
 Проект. Адаптационный клуб В детский сад с улыбкой
 Результаты ОГЭ и ЕГЭ по обществознанию. МБОУ СОШ №39 г.Чебоксары ЧР
 С 8 Марта
 Культура СССР в годы Великой Отечественной войны
 Машиностроение
 Я хочу знать русский язык
 Юридическая ответственность и ее задачи. Лекция №7
 Дыхательная система человека. Эволюция органов дыхания
 Summer holidays and activities flashcards
 Параллельный перенос
 Оценка качества зданий. Показатели качества зданий. Обследование зданий
 Clothes (4)
 Это мы
 Простое оштукатуривание стен строительного склада цементным раствором и ремонт облицовки пола керамической метлахской плиткой
 Инновационные технологии развития музыкальной культуры старших дошкольников в воспитательном пространстве праздника
 Интерактивное ТВ
 Шаблон 9 мая. Зима
 Выступление
 Superheroes. Comparisons
 США. Интегрированный урок английский язык и география
 Принципы управления А. Файоля и Э. Деминга
 Тоталитаризм. Отрицательные черты