- Transport modes in European city in a European city 1960 - 2000

Содержание
- 2. The chart shows components of GDP in the UK from 1992 to 2000.
- 3. The pie charts show the electricity generated in Germany and France from all sources and renewables
- 4. The pie chart shows the amount of money that a children's charity located in the USA
- 5. The illustrations show how chocolate is produced.
- 6. The illustrations show fish canning process.
- 7. The line graph shows thefts per thousand vehicles in four European countries between 1990 and 1999.
- 9. Скачать презентацию
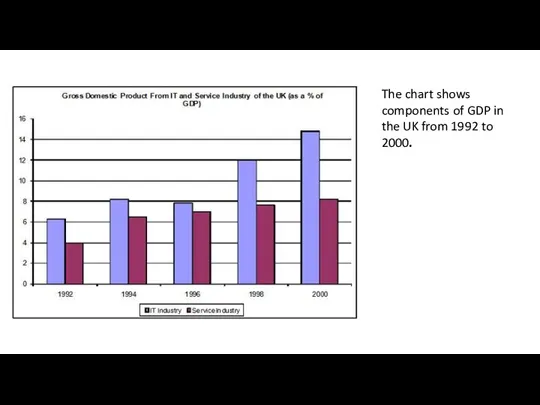
The chart shows components of GDP in the UK from 1992
The chart shows components of GDP in the UK from 1992
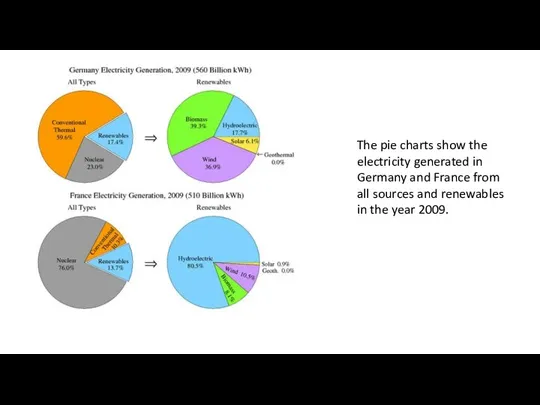
The pie charts show the electricity generated in Germany and France
The pie charts show the electricity generated in Germany and France
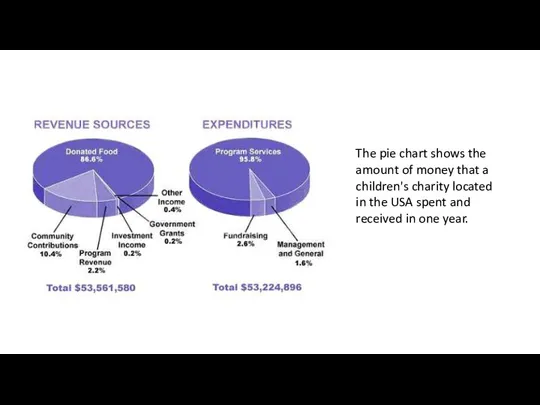
The pie chart shows the amount of money that a children's
The pie chart shows the amount of money that a children's
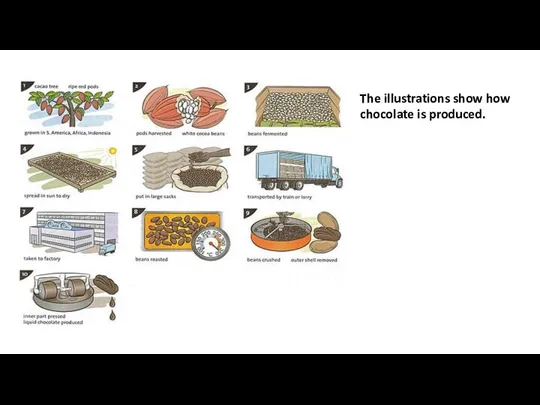
The illustrations show how chocolate is produced.
The illustrations show how chocolate is produced.
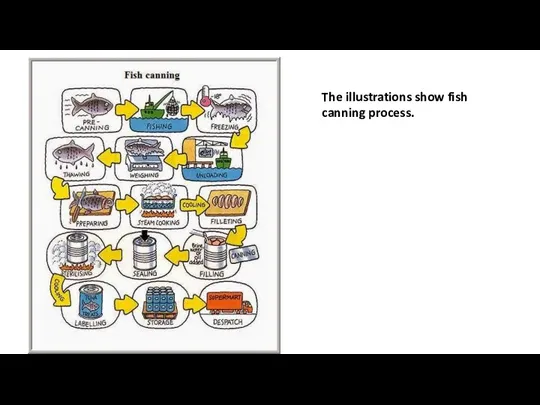
The illustrations show fish canning process.
The illustrations show fish canning process.
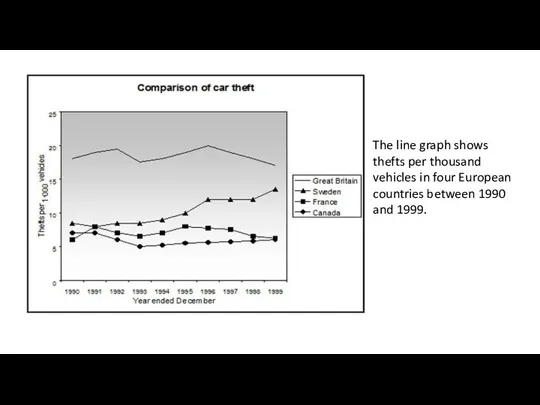
The line graph shows thefts per thousand vehicles in four European
The line graph shows thefts per thousand vehicles in four European
 Prezentatsia
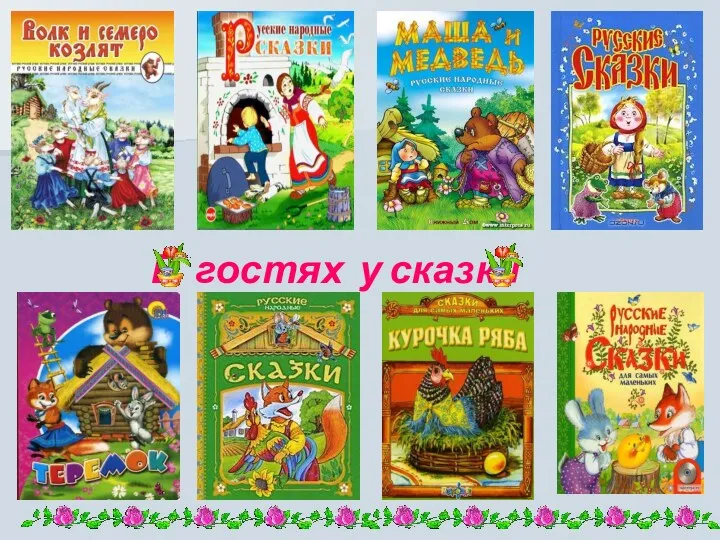 Образовательная ситуация с использованием информационно-коммуникационных технологий В гостях у сказки для детей средней группы.
 Родительный, дательный, творительный и предложный падежи имен прилагательных женского рода
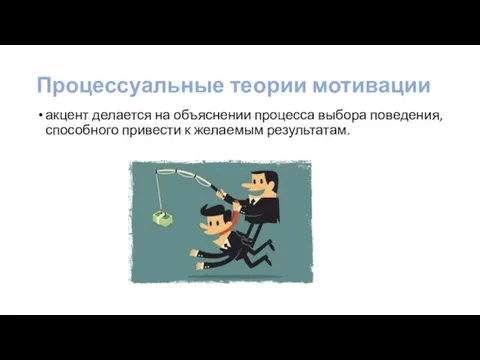 Процессуальные теории мотивации
 Шаблоны для изготовления презнтаций на зимнюют тематику.
 Проект: Этих дней не смолкнет слава
 Бизнес-план. Индивидуальное предприятие
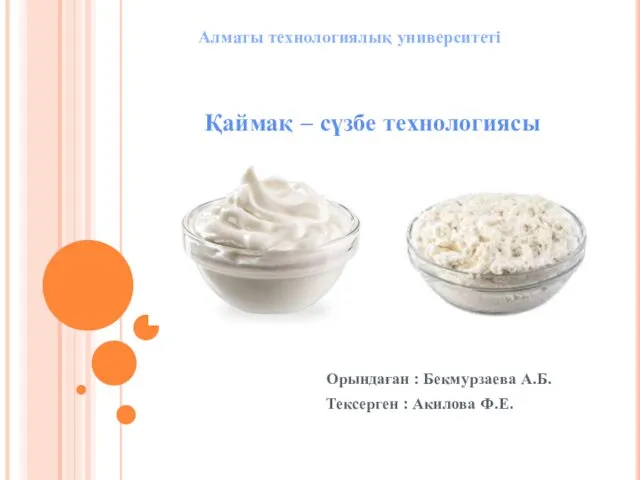 Қаймақ технологиясы оларды нормалау және гомогенизациялау
 Операция Зёрнышко (презентация)
 Принцип действия и схема рт-252 рт-253 рт-255
 Лист. Общие понятия о листе, его развитие, анатомическое строение, видоизменения, морфология и классификация
 Викторина История Олимпийских игр
 Обобщение опыта по теме Психология общения
 Доклад на РМО воспитателей разновозрастных групп по теме: Система мониторинга реализации ООП ДОУ
 Технические каналы утечки информации
 Участие медсестры в подготовке к инструментальным методам исследования
 Резцы. Классификация резцов
 Умная теплица
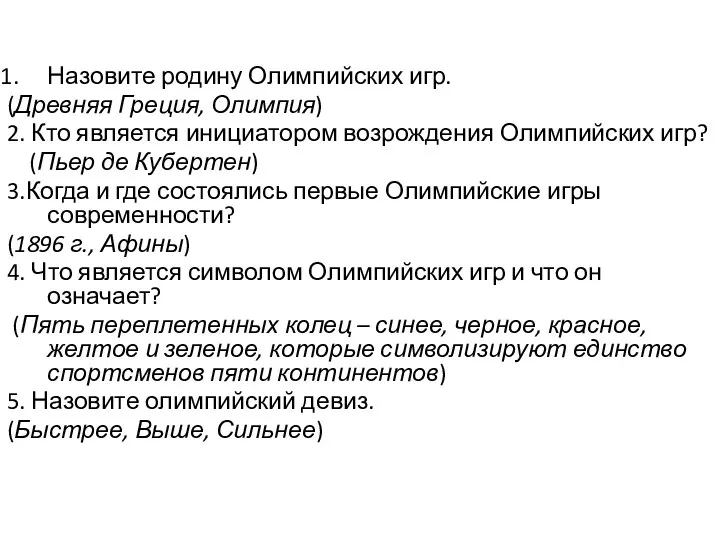 Зимняя олимпиада 2014
 День Святой Троицы (Пятидесятница)
 Драматургия танца
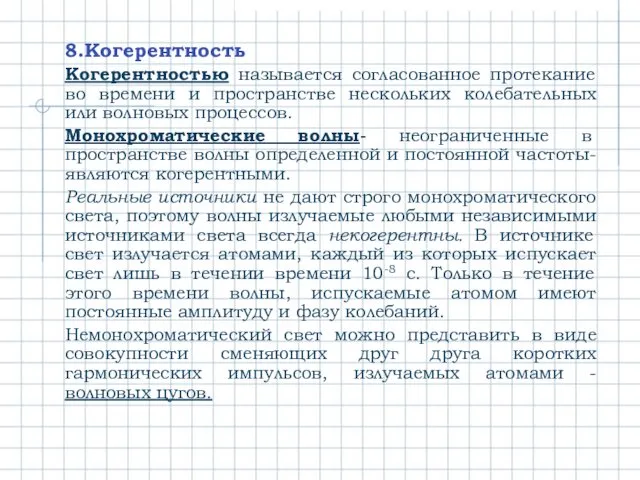 Когерентность. Монохроматические волны
 Современное климатическое оборудование
 Мои ученики
 Конспект интегрированного занятия по развитию речи для детей младшего дошкольного возраста с использованием мнемотехники и ИКТ
 Методическая разработка Презентация ко Дню Победы Поклонимся великим тем годам... Диск Диск Диск Диск
 Кім ақылды кім шапшаң кім тапқыр. Таныстыру
 Антон Павлович Чехов