- Juvenile Offenders and Victims: 2006 National Report

Содержание
- 2. In 2003, public and private facilities held 32% more delinquents and 32% fewer status offenders than
- 3. Public facilities drive the trend for the delinquency population; private facilities drive the trend for status
- 4. Between 1991 and 2003, the detained delinquency population in public and private facilities increased 38%
- 5. The number of committed delinquents held in public or private facilities as part of a court-ordered
- 6. In 2003, the national detention rate was 83 juvenile offenders in custody for every 100,000 juveniles
- 7. In 2003, the national commitment rate was 219 juvenile offenders in custody for every 100,000 juveniles
- 8. Although national custody rates declined from 1997 to 2003, not all states experienced a decline
- 9. More than half of the states had lower commitment rates in 2003 than in 1997
- 10. New Hampshire, Oregon, and Colorado had the highest proportions of person offenders in the custody population;
- 11. Massachusetts and North Carolina had the highest proportions of person offenders among detained juveniles; Connecticut and
- 12. Oregon and New Hampshire had the highest proportions of person offenders among committed juveniles; Mississippi, Nebraska,
- 13. The number of male offenders in custody increased 23% from 1991 to 2003
- 14. The number of female offenders in custody increased 52% from 1991 to 2003
- 15. In nearly all states, females represented a relatively small proportion of juvenile offenders in residential placement
- 16. Between 1991 and 2003, detained youth constituted about one-quarter of all male delinquents in residential placement
- 17. Between 1991 and 2003, detained youth constituted more than one-third of all female delinquents in residential
- 18. In every state except Vermont, the custody rate for black juvenile offenders exceeded the rate for
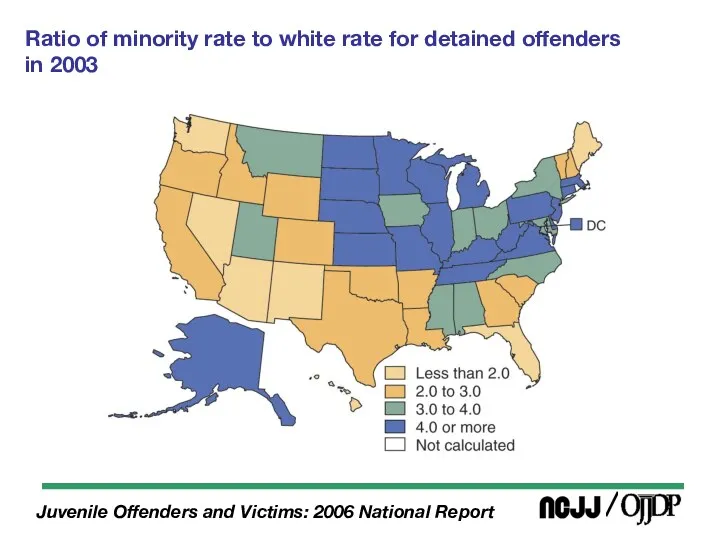
- 19. Ratio of minority rate to white rate for detained offenders in 2003
- 20. Ratio of minority rate to white rate for committed offenders in public facilities in 2003
- 21. In 2003, 34% of committed offenders but just 3% of detained offenders remained in placement 6
- 22. Males tended to stay in facilities longer than females in 2003
- 23. Half of detained white offenders remained in custody after 14 days; half of detained minority offenders
- 24. 2003 time-in-placement patterns largely overlapped for detained youth held for property, drug, public order, and status
- 25. In 2003, committed person offenders were in placement longer than other types of offenders
- 26. Compared with youth in the general population, at all ages, higher proportions of youth who are
- 27. On a typical day in 2004, about 7,000 persons younger than 18 were inmates in jails
- 28. Between 1996 and 2002, the number of new admissions of youth younger than 18 to state
- 29. The population of older inmates grew 16% between 1997 and 2004
- 30. The population of inmates younger than age 18 fell 54% between 1997 and 2004
- 32. Скачать презентацию
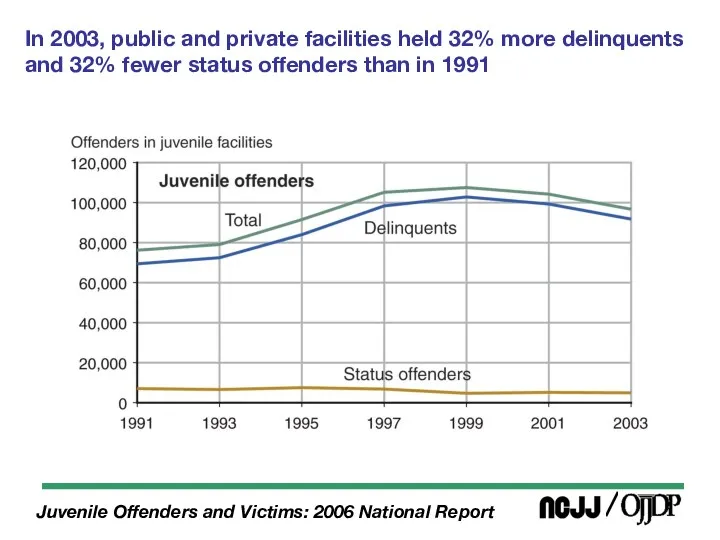
In 2003, public and private facilities held 32% more delinquents and
In 2003, public and private facilities held 32% more delinquents and
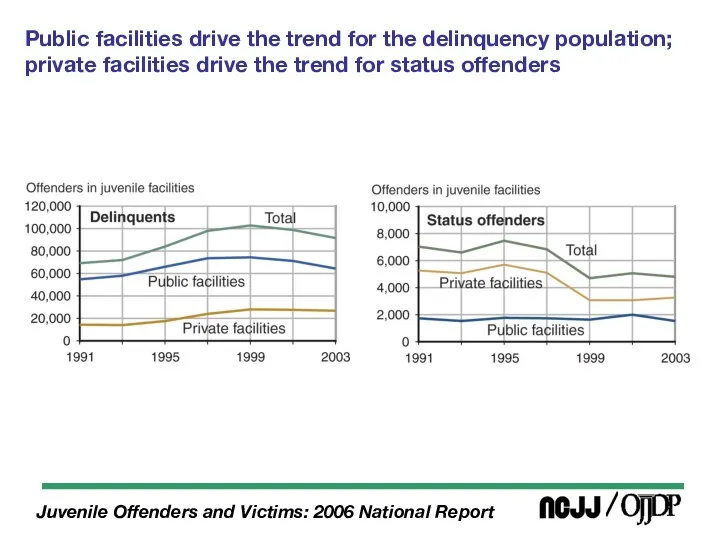
Public facilities drive the trend for the delinquency population; private facilities
Public facilities drive the trend for the delinquency population; private facilities
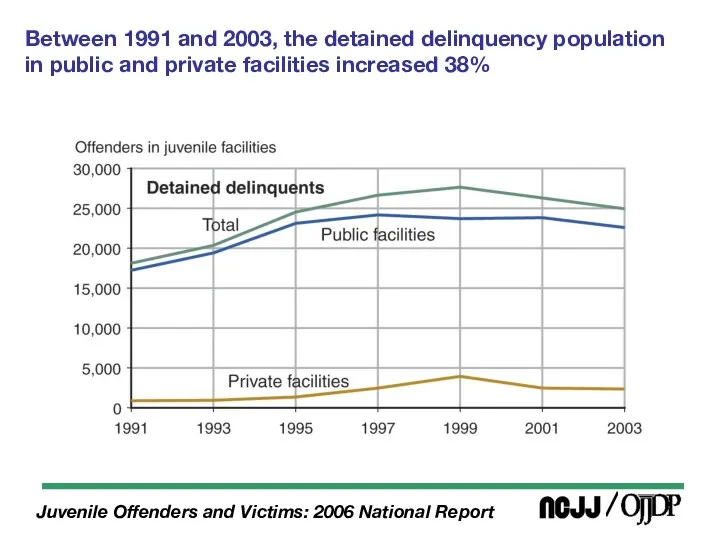
Between 1991 and 2003, the detained delinquency population in public and
Between 1991 and 2003, the detained delinquency population in public and
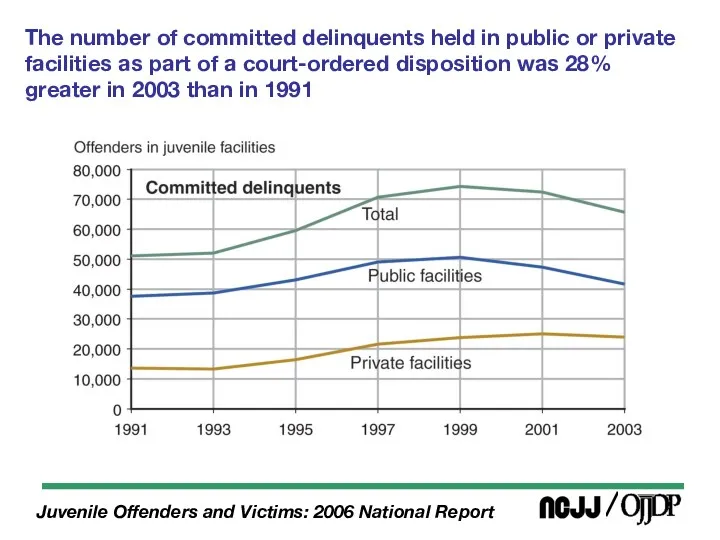
The number of committed delinquents held in public or private facilities
The number of committed delinquents held in public or private facilities
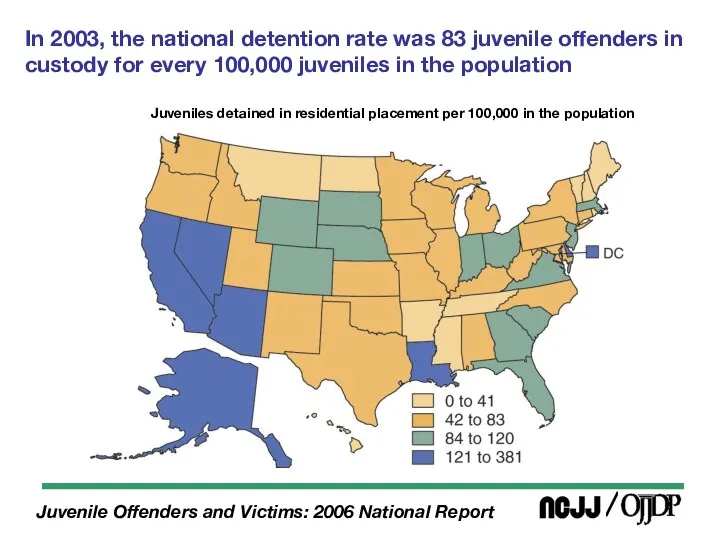
In 2003, the national detention rate was 83 juvenile offenders in
In 2003, the national detention rate was 83 juvenile offenders in
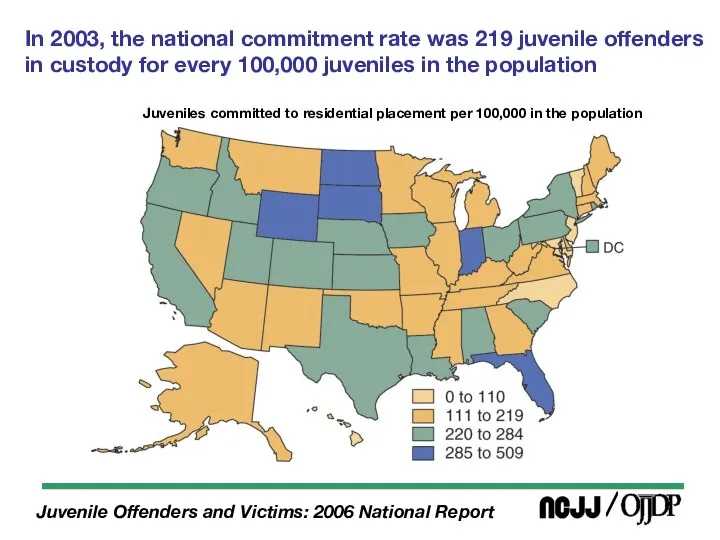
In 2003, the national commitment rate was 219 juvenile offenders in
In 2003, the national commitment rate was 219 juvenile offenders in
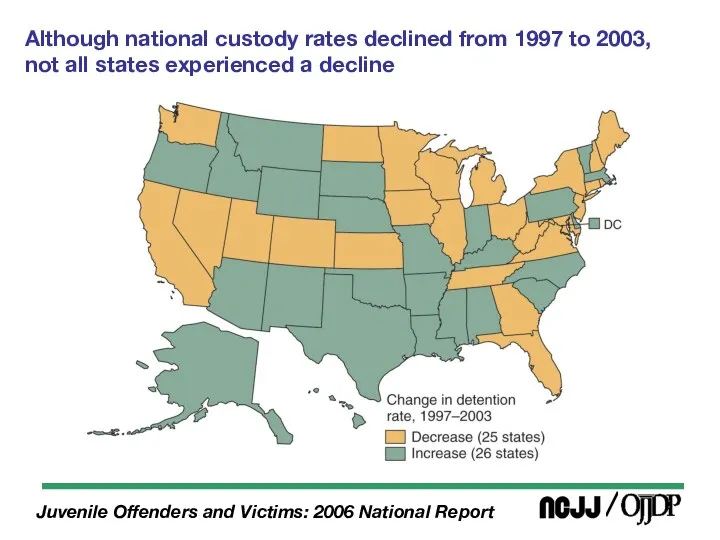
Although national custody rates declined from 1997 to 2003, not all
Although national custody rates declined from 1997 to 2003, not all
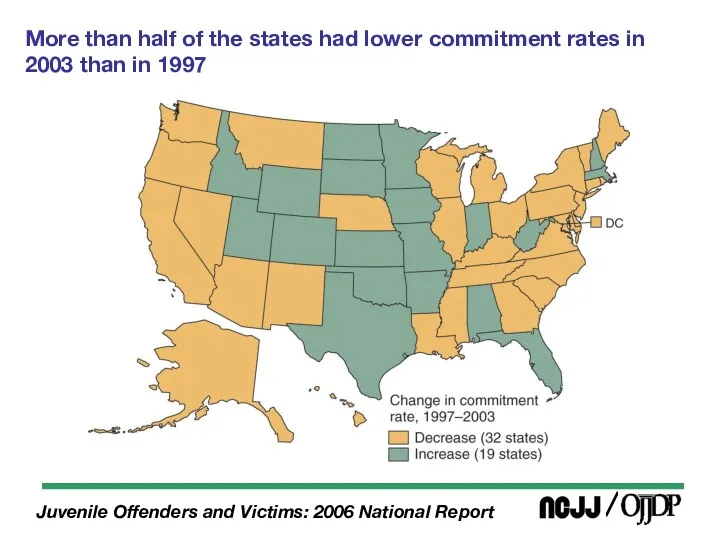
More than half of the states had lower commitment rates in
More than half of the states had lower commitment rates in
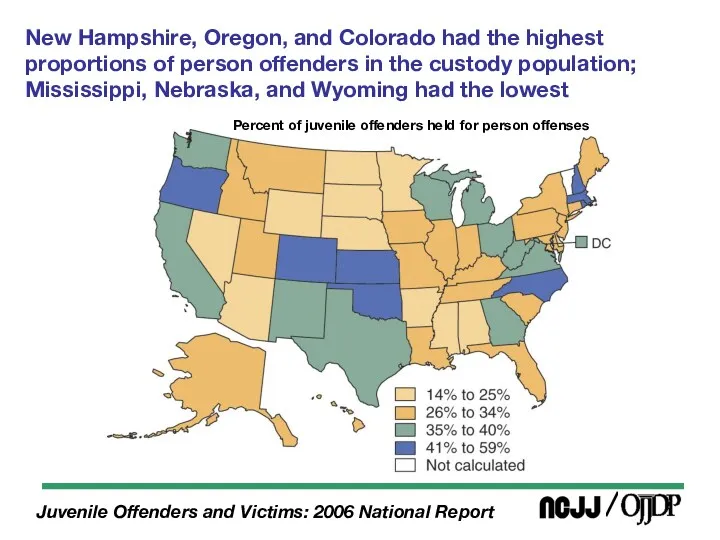
New Hampshire, Oregon, and Colorado had the highest proportions of person
New Hampshire, Oregon, and Colorado had the highest proportions of person
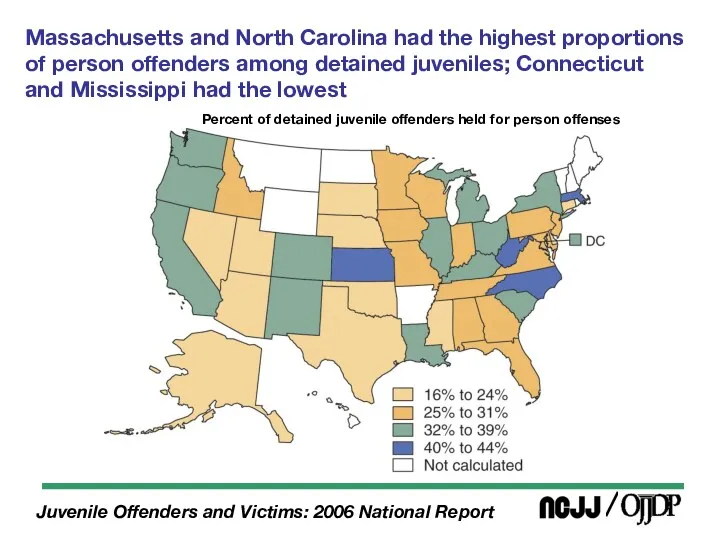
Massachusetts and North Carolina had the highest proportions of person offenders
Massachusetts and North Carolina had the highest proportions of person offenders
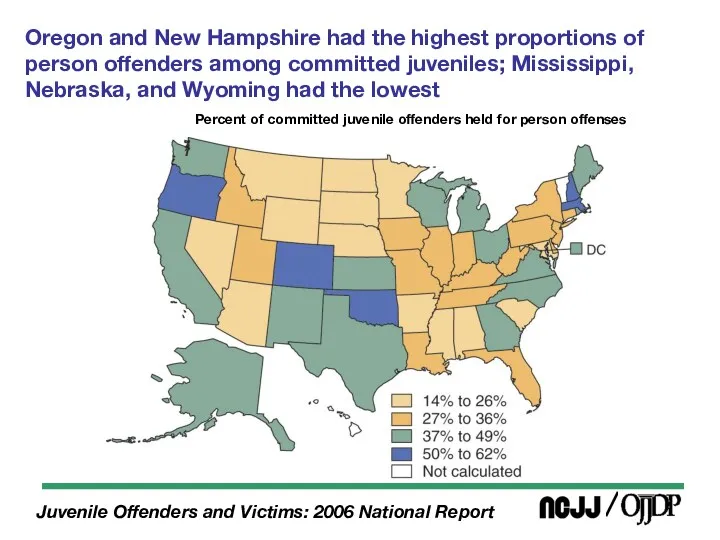
Oregon and New Hampshire had the highest proportions of person offenders
Oregon and New Hampshire had the highest proportions of person offenders
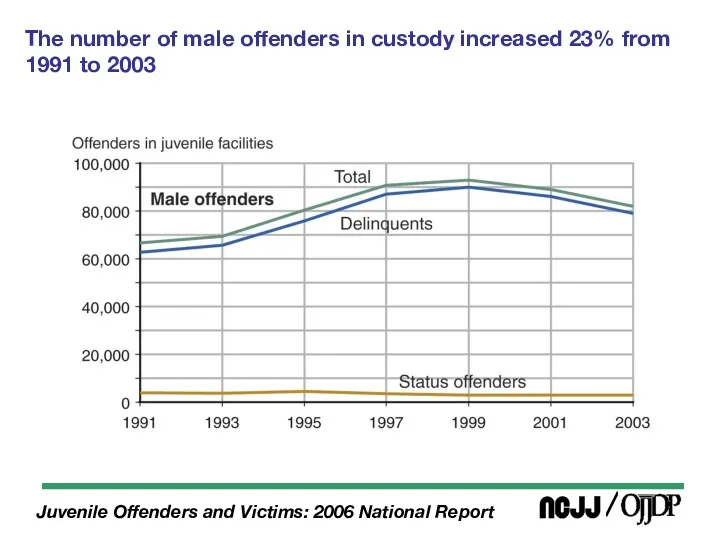
The number of male offenders in custody increased 23% from 1991
The number of male offenders in custody increased 23% from 1991
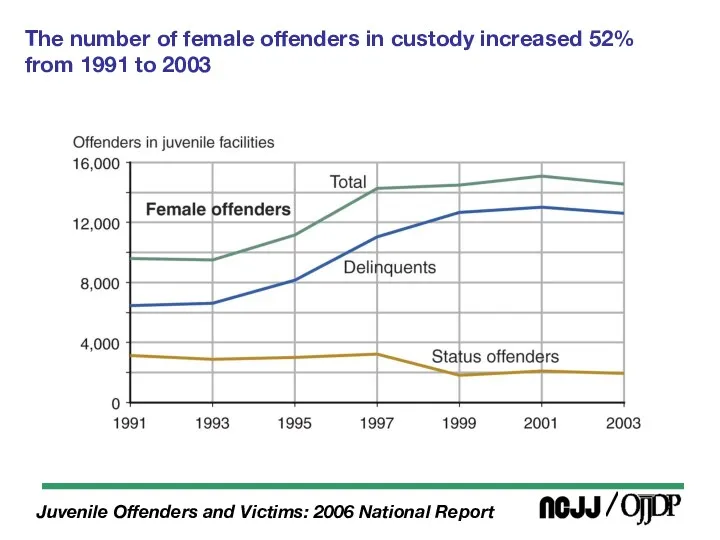
The number of female offenders in custody increased 52% from 1991
The number of female offenders in custody increased 52% from 1991
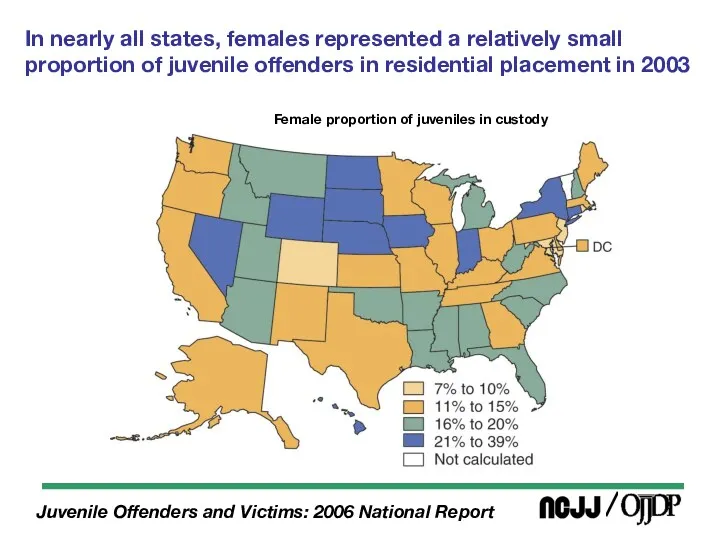
In nearly all states, females represented a relatively small proportion of
In nearly all states, females represented a relatively small proportion of
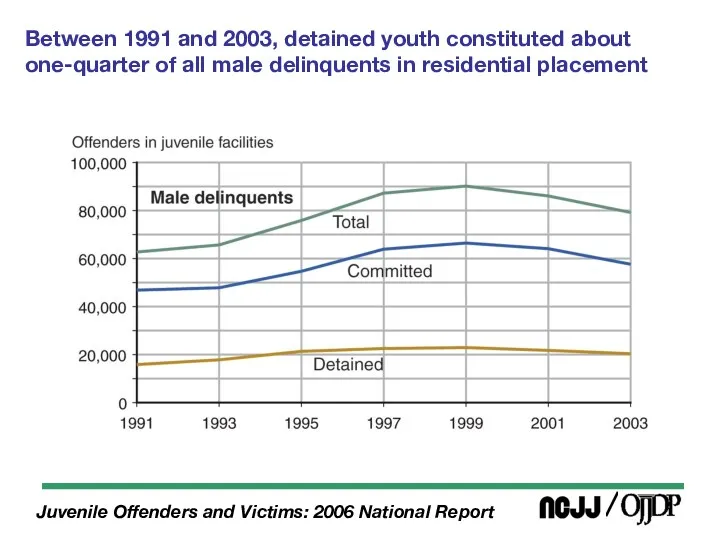
Between 1991 and 2003, detained youth constituted about one-quarter of all
Between 1991 and 2003, detained youth constituted about one-quarter of all
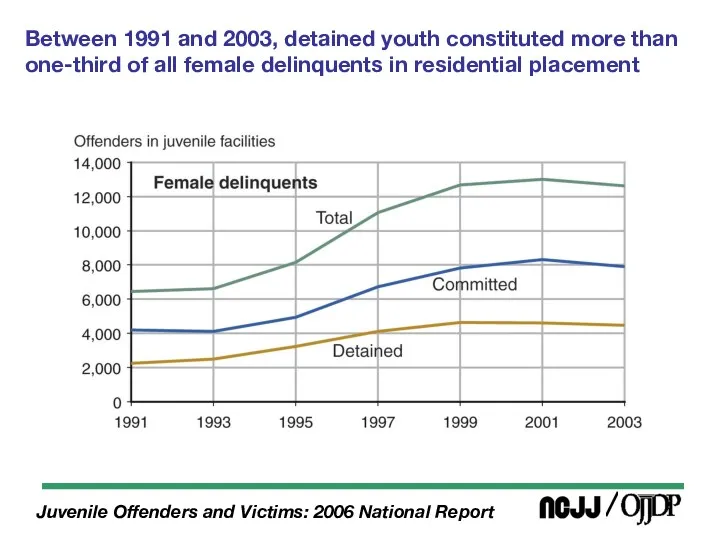
Between 1991 and 2003, detained youth constituted more than one-third of
Between 1991 and 2003, detained youth constituted more than one-third of
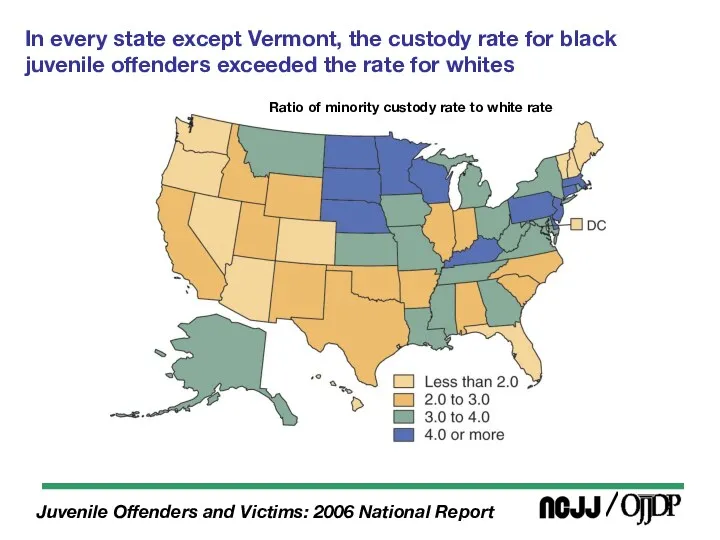
In every state except Vermont, the custody rate for black juvenile
In every state except Vermont, the custody rate for black juvenile
Ratio of minority rate to white rate for detained offenders
in
Ratio of minority rate to white rate for detained offenders in
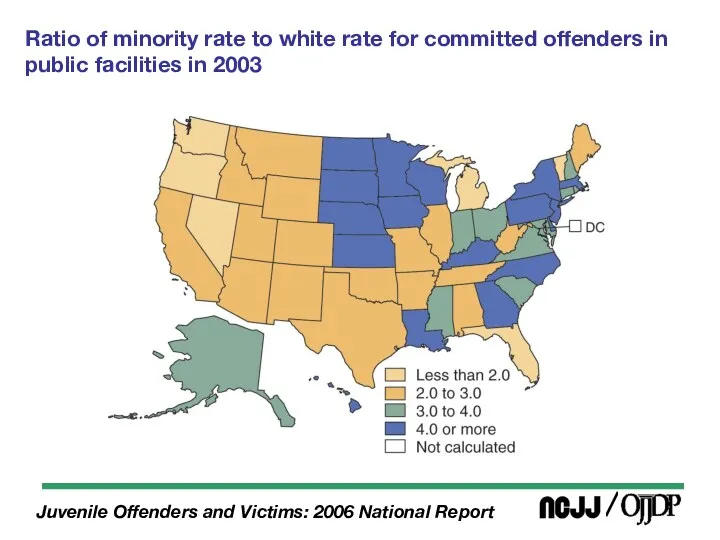
Ratio of minority rate to white rate for committed offenders in
Ratio of minority rate to white rate for committed offenders in
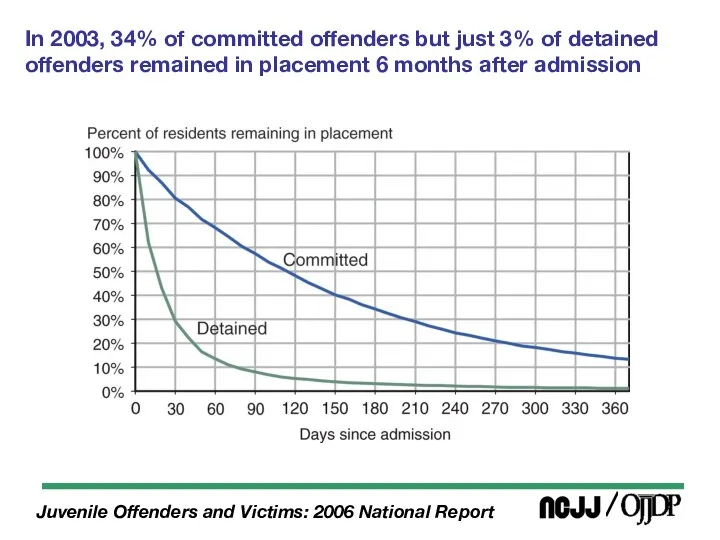
In 2003, 34% of committed offenders but just 3% of detained
In 2003, 34% of committed offenders but just 3% of detained
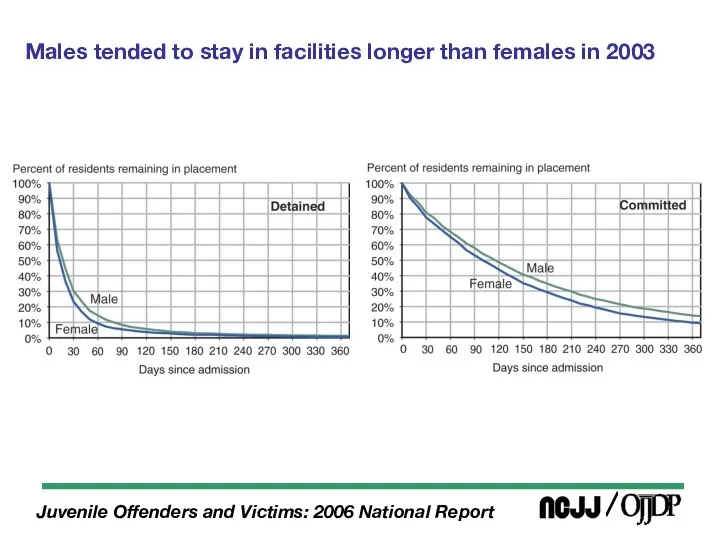
Males tended to stay in facilities longer than females in 2003
Males tended to stay in facilities longer than females in 2003
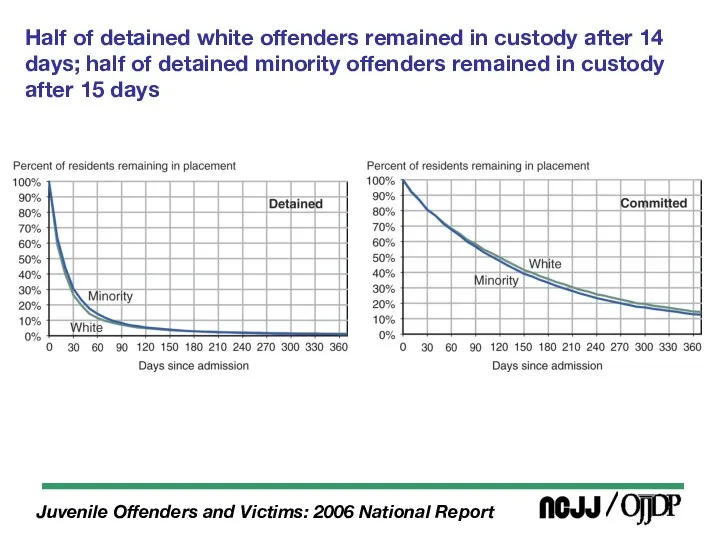
Half of detained white offenders remained in custody after 14 days;
Half of detained white offenders remained in custody after 14 days;
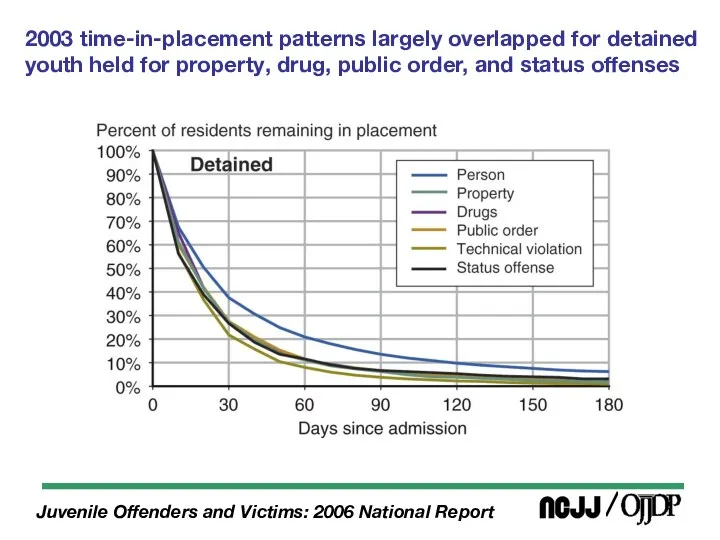
2003 time-in-placement patterns largely overlapped for detained
youth held for property,
2003 time-in-placement patterns largely overlapped for detained youth held for property,
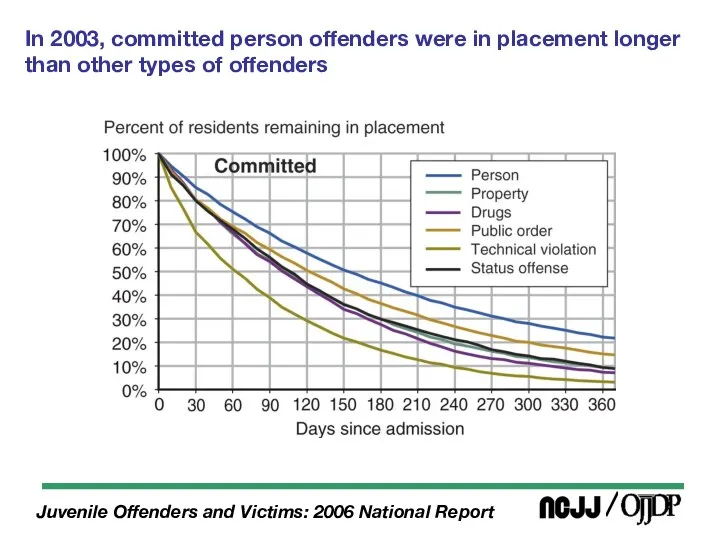
In 2003, committed person offenders were in placement longer than other
In 2003, committed person offenders were in placement longer than other
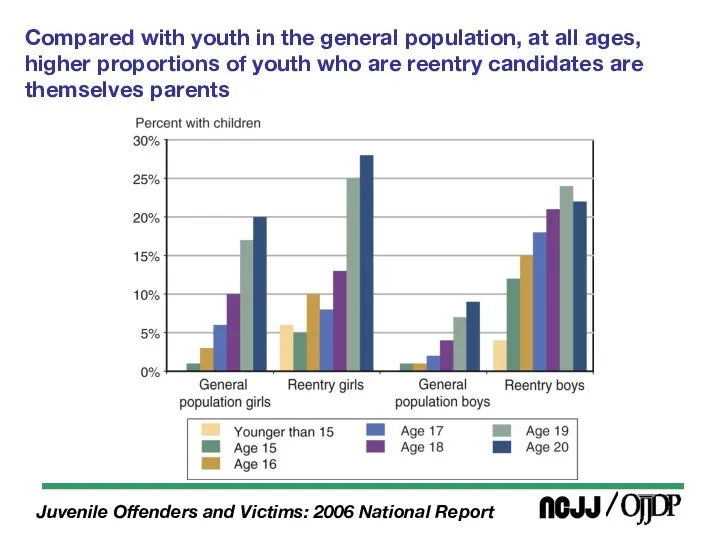
Compared with youth in the general population, at all ages, higher
Compared with youth in the general population, at all ages, higher
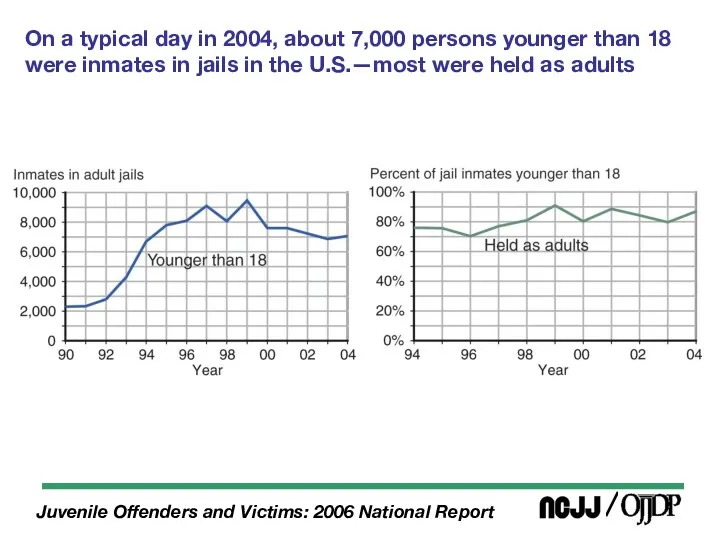
On a typical day in 2004, about 7,000 persons younger than
On a typical day in 2004, about 7,000 persons younger than
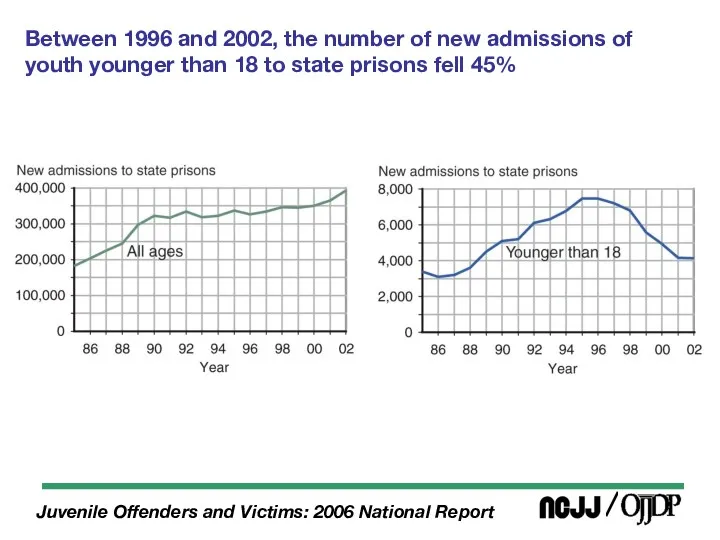
Between 1996 and 2002, the number of new admissions of youth
Between 1996 and 2002, the number of new admissions of youth
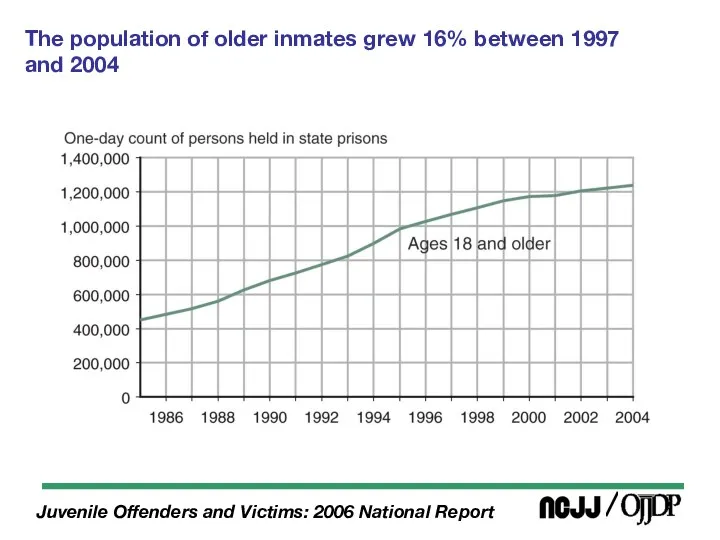
The population of older inmates grew 16% between 1997
and 2004
The population of older inmates grew 16% between 1997
and 2004
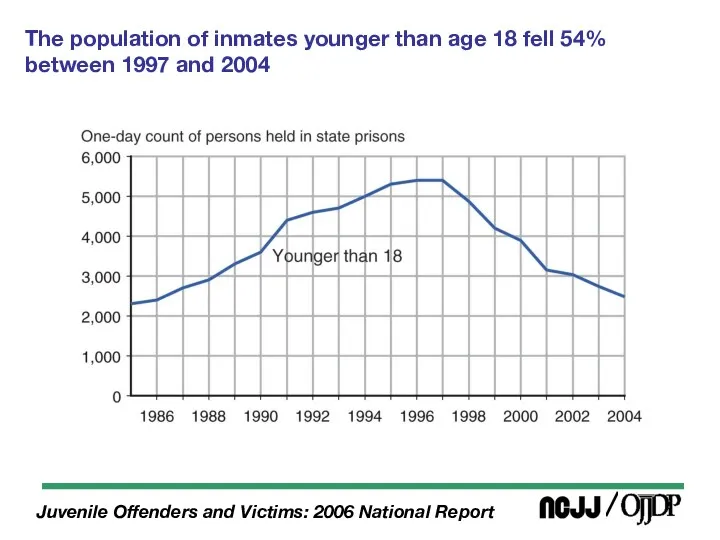
The population of inmates younger than age 18 fell 54% between
The population of inmates younger than age 18 fell 54% between
 Кафедра уголовного права Уголовный закон. Действие уголовного закона
 Қылмыстық сот ісін жүргізу саласындағы халықаралық ынтымақтастық
 Характеристика отдельных следственных действий. Осмотр
 Международный трибунал по бывшей Югославии
 Конвенция о правах ребенка в картинках
 Стандартизация. Функции и методы стандартизации
 Общество с ограниченной ответственностью
 Правові, теоретичні та організаційні основи охорони праці. Тема 7
 Насилие над детьми
 Правила гармонизации и унификации права
 Правовой режим коммерческой тайны
 Правове регулювання кредитованих відносин
 Мы гордимся своей страной
 Роль кадастров в рыночных отношениях. Задачи,цель и способы ведения ГКН на различных административно-территориальных уровнях
 Правовая статистика
 Распорядительная документация и методы её составления
 Сохранение наследия и нормирование. Государственный список историко-культурных ценностей. Охранные зоны памятников архитектуры
 Обстоятельства, исключающие преступность деяния
 Соотношение понятий субъект преступления и личность преступника
 Гражданско-правовой договор
 Исполнительная власть в системе разделения властей Российской Федерации
 Программа кандидата на пост Председателя Студенческого научного общества
 Оформление прав на прочие объекты интеллектуальной собственности
 Гражданское общество и правовое государство
 Уголовное право
 Контрактная система в сфере государственных и муниципальных закупок
 Современные методы работы со следами в криминалистике (учебные пособия)
 Правовое государство