- Describing charts

Содержание
- 3. describing charts • The pie chart is about ... • The bar chart deals with ...
- 4. describing charts It highlights ... • ... has the largest (number of) ... • ... has
- 5. describing charts • The number ... increases/goes up/grows by ... • The number ... decreases/goes down/sinks
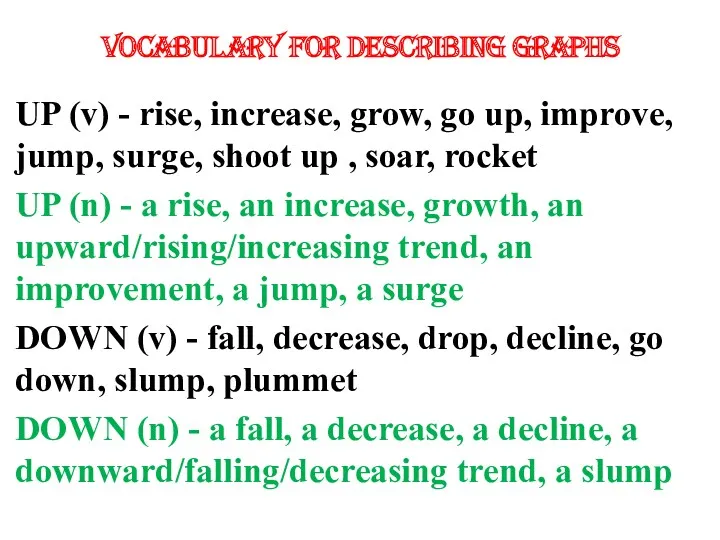
- 6. Vocabulary for describing graphs UP (v) - rise, increase, grow, go up, improve, jump, surge, shoot
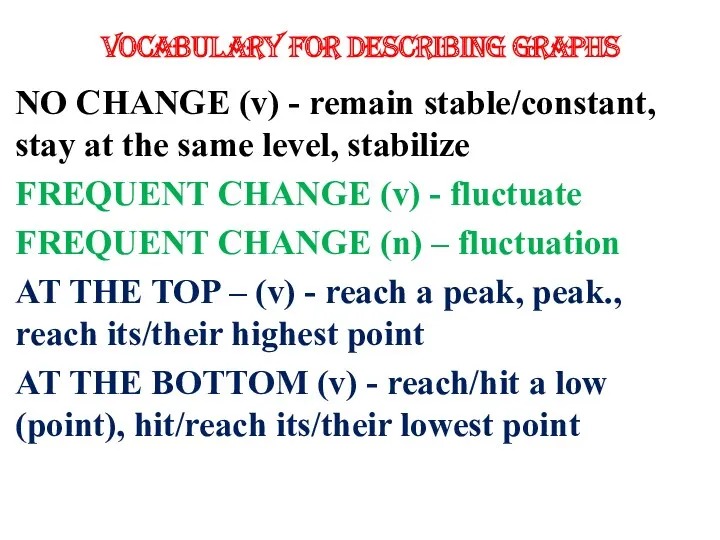
- 7. Vocabulary for describing graphs NO CHANGE (v) - remain stable/constant, stay at the same level, stabilize
- 8. A d j e c t i v e s dramatic, considerable, sharp, significant, moderate, slight,
- 10. Скачать презентацию
describing charts
• The pie chart is about ...
• The bar chart deals with
describing charts
• The pie chart is about ...
• The bar chart deals with
describing charts
It highlights ...
• ... has the largest (number of) ...
• ... has
describing charts
It highlights ...
• ... has the largest (number of) ...
• ... has
describing charts
• The number ... increases/goes up/grows by ...
• The number ... decreases/goes
describing charts
• The number ... increases/goes up/grows by ...
• The number ... decreases/goes
Vocabulary for describing graphs
UP (v) - rise, increase, grow, go up,
Vocabulary for describing graphs
UP (v) - rise, increase, grow, go up,
Vocabulary for describing graphs
NO CHANGE (v) - remain stable/constant, stay at
Vocabulary for describing graphs
NO CHANGE (v) - remain stable/constant, stay at

A d j e c t i v e s
dramatic,
considerable,
A d j e c t i v e s
dramatic,
considerable,
 Destinations in South Asia
 Game there-was-there-wasnt
 Teaching reading to beginners
 Present simple, past simple, future simple
 St. Valentine’s Day
 To be
To be School items
 Spotlight 9 1c
 Types of differentiation and identifying success criteria
 The importance of carbohydrates in animal nutrition
 The right way to write letters, resumes, advertisements
 Family relationships
 Welcome to London
 Past Tenses
 Expressive Means jf the English Language
 English Lapbook ISN Templates
 Present Simple, Past Simple, Future Simple. Spotlight 4
 Body Parts
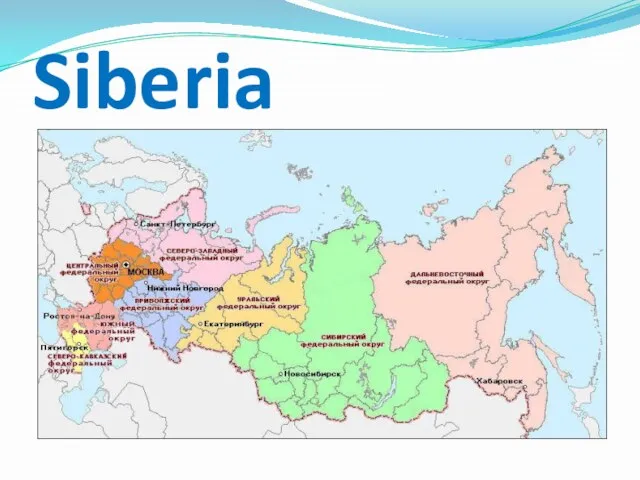 Geographical region Siberia
 International Legal English Certificate (ILEC)
 What`s on menu?
 Spotlight 4. Starter Unit (a). Back to School
 Present Tenses
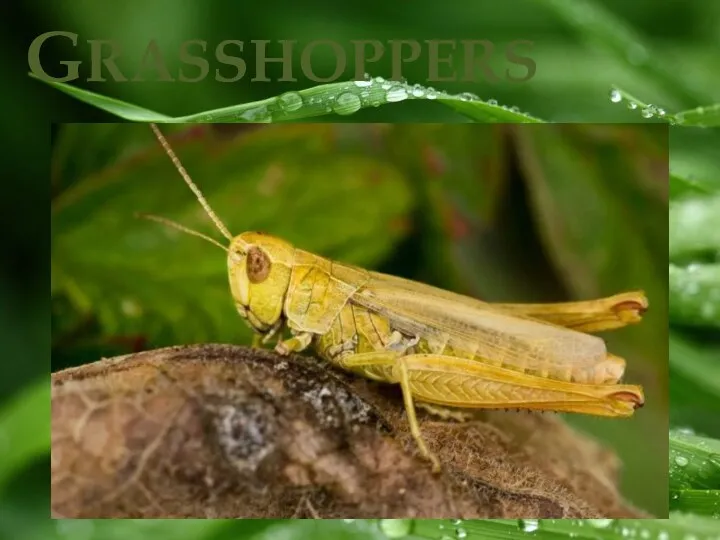 Grasshoppers
 Cover letter
 My favorite singer
 My household duties
 Будущее время