- Describing Graphs

Содержание
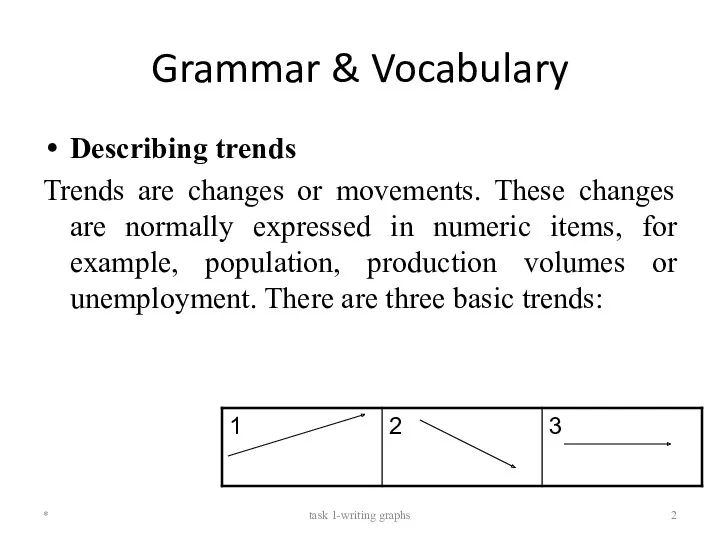
- 2. Grammar & Vocabulary Describing trends Trends are changes or movements. These changes are normally expressed in
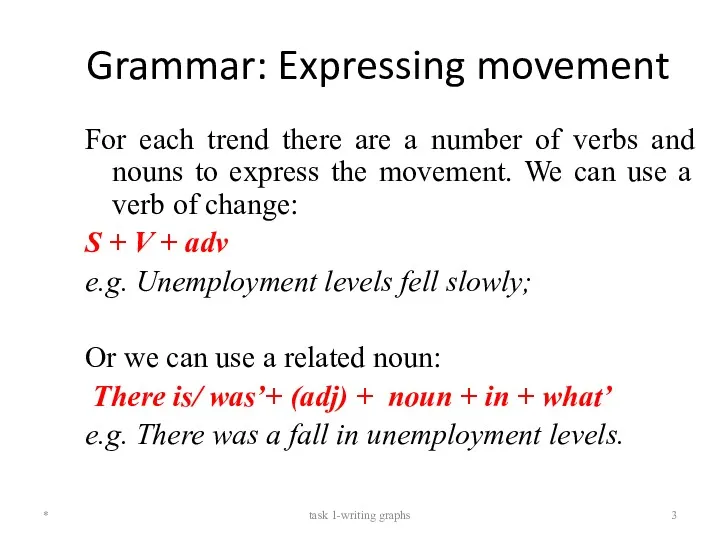
- 3. Grammar: Expressing movement For each trend there are a number of verbs and nouns to express
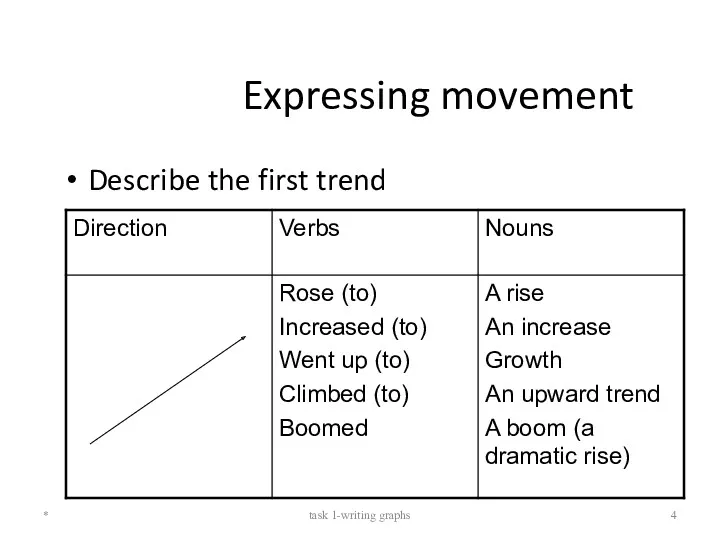
- 4. Expressing movement Describe the first trend * task 1-writing graphs
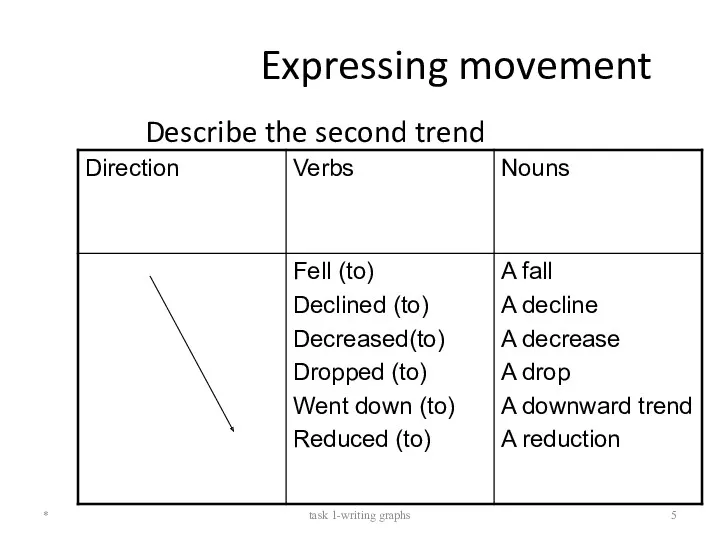
- 5. Expressing movement Describe the second trend * task 1-writing graphs
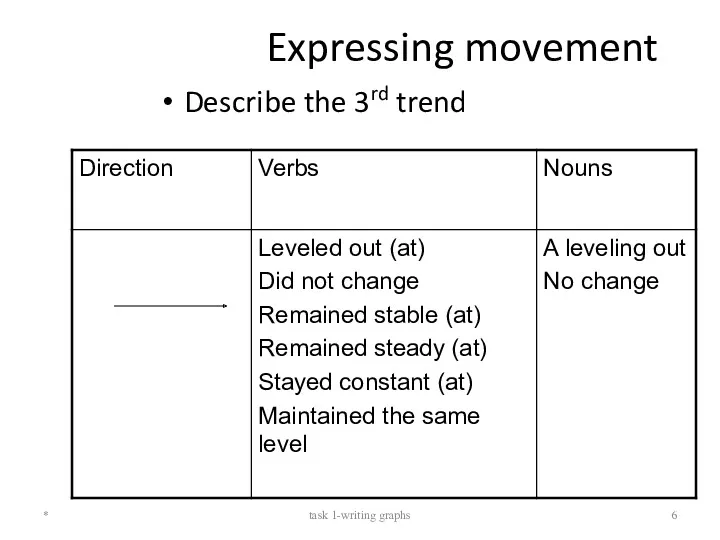
- 6. Expressing movement Describe the 3rd trend * task 1-writing graphs
- 7. Expressing movement Describe the other trends * task 1-writing graphs
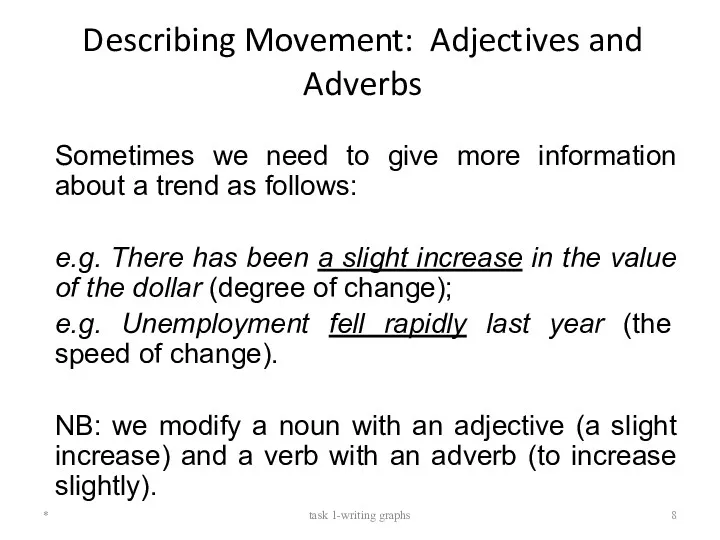
- 8. Describing Movement: Adjectives and Adverbs Sometimes we need to give more information about a trend as
- 9. Describing the degree of change * task 1-writing graphs
- 10. Describing the speed of change * task 1-writing graphs
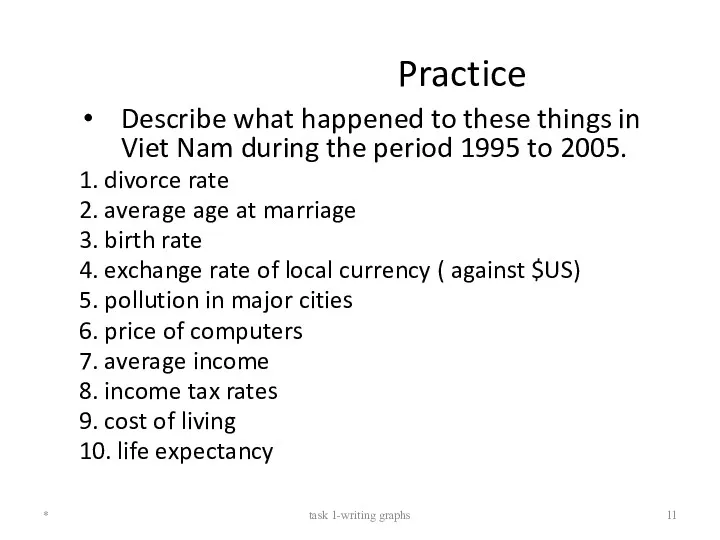
- 11. Practice Describe what happened to these things in Viet Nam during the period 1995 to 2005.
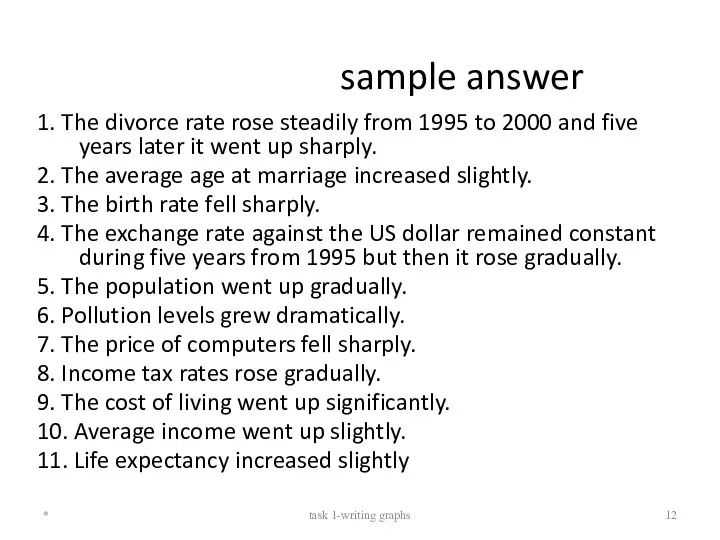
- 12. sample answer 1. The divorce rate rose steadily from 1995 to 2000 and five years later
- 13. Examples: Line Graphs * task 1-writing graphs
- 14. Examples: Bar Graphs * task 1-writing graphs
- 15. Examples: Bar Graphs (2) * task 1-writing graphs
- 16. Sample Task You should spend about 20 minutes on this task. Write a report for a
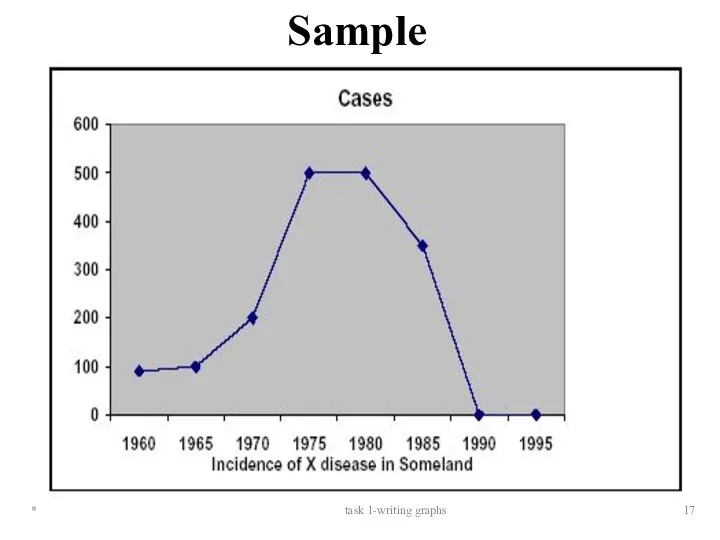
- 17. * task 1-writing graphs Sample
- 18. Guidelines for writing task Selecting information =>summarizing the graph by dividing it into its main parts
- 19. Introduction Use two standard opening sentences to describe your graph. Sentence one should define what the
- 20. Body & conclusion Describing the graph in detail Decide on the most clear and logical order
- 22. Скачать презентацию
Grammar & Vocabulary
Describing trends
Trends are changes or movements. These changes are
Grammar & Vocabulary
Describing trends
Trends are changes or movements. These changes are
Grammar: Expressing movement
For each trend there are a number of verbs
Grammar: Expressing movement
For each trend there are a number of verbs
Expressing movement
Describe the first trend
*
task 1-writing graphs
Expressing movement
Describe the first trend
*
task 1-writing graphs
Expressing movement
Describe the second trend
*
task 1-writing graphs
Expressing movement
Describe the second trend
*
task 1-writing graphs
Expressing movement
Describe the 3rd trend
*
task 1-writing graphs
Expressing movement
Describe the 3rd trend
*
task 1-writing graphs

Expressing movement
Describe the other trends
*
task 1-writing graphs
Expressing movement
Describe the other trends
*
task 1-writing graphs
Describing Movement: Adjectives and Adverbs
Sometimes we need to give more
Describing Movement: Adjectives and Adverbs
Sometimes we need to give more
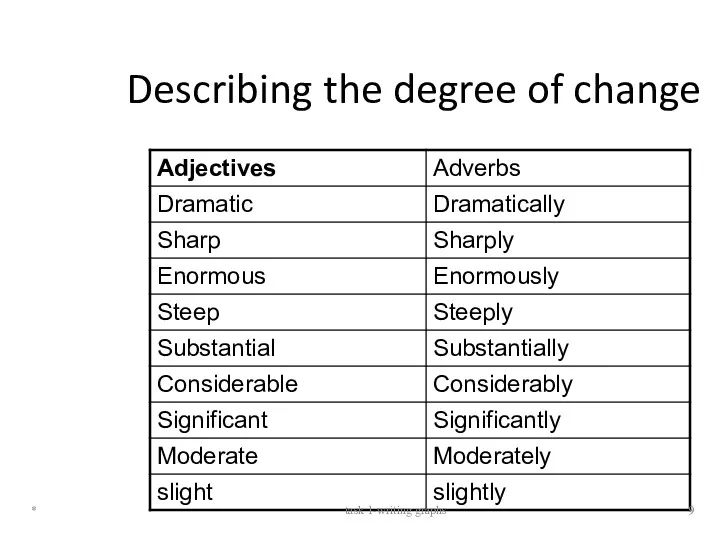
Describing the degree of change
*
task 1-writing graphs
Describing the degree of change
*
task 1-writing graphs

Describing the speed of change
*
task 1-writing graphs
Describing the speed of change
*
task 1-writing graphs
Practice
Describe what happened to these things in Viet Nam during the
Practice
Describe what happened to these things in Viet Nam during the
sample answer
1. The divorce rate rose steadily from 1995 to 2000
sample answer
1. The divorce rate rose steadily from 1995 to 2000
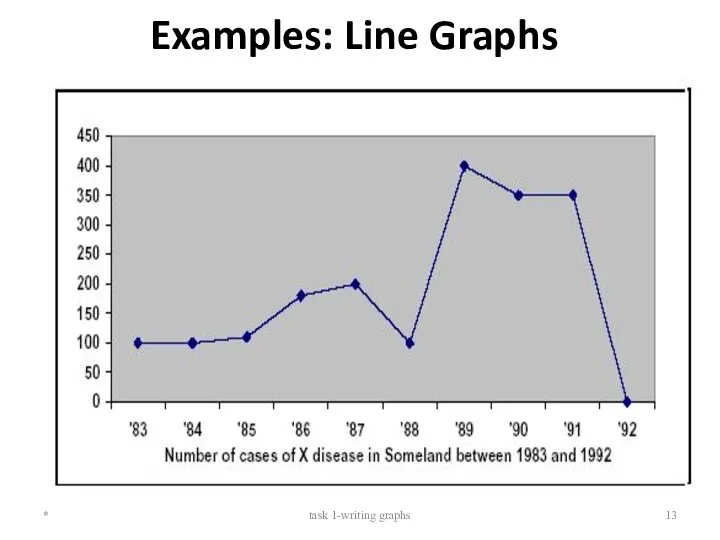
Examples: Line Graphs
*
task 1-writing graphs
Examples: Line Graphs
*
task 1-writing graphs
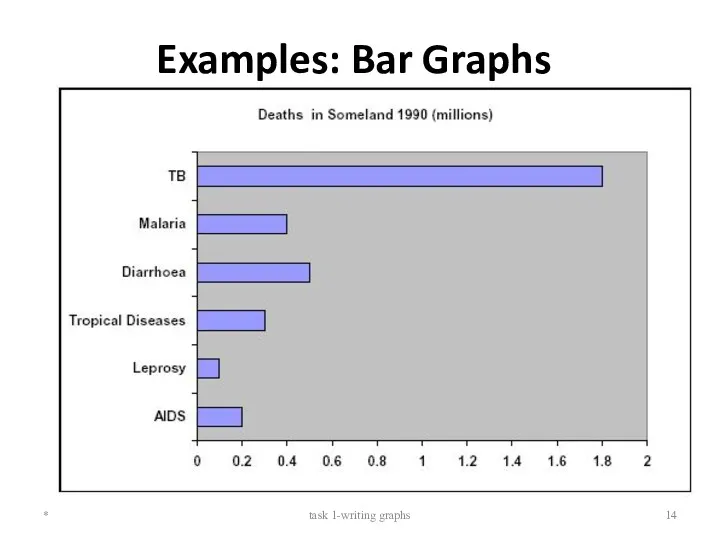
Examples: Bar Graphs
*
task 1-writing graphs
Examples: Bar Graphs
*
task 1-writing graphs

Examples: Bar Graphs (2)
*
task 1-writing graphs
Examples: Bar Graphs (2)
*
task 1-writing graphs
Sample Task
You should spend about 20 minutes on this task. Write
Sample Task
You should spend about 20 minutes on this task. Write
*
task 1-writing graphs
Sample
*
task 1-writing graphs
Sample
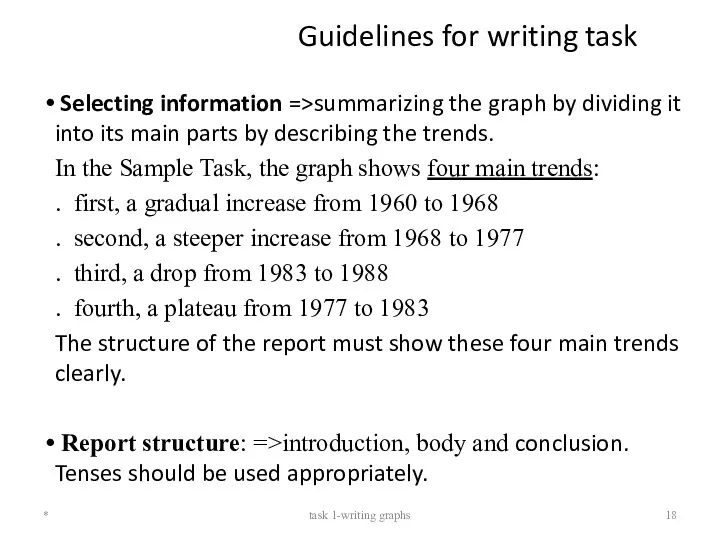
Guidelines for writing task
Selecting information =>summarizing the graph by dividing
Guidelines for writing task
Selecting information =>summarizing the graph by dividing

Introduction
Use two standard opening sentences to describe your graph. Sentence
Introduction
Use two standard opening sentences to describe your graph. Sentence
Body & conclusion
Describing the graph in detail
Decide on the most
Body & conclusion
Describing the graph in detail
Decide on the most
 History of Money
 Fire class
 English alphabet
 My family
 Correction of the essay #2
 Основы перевода. Перевод фразеологизмов
 Parenting styles and outcomes
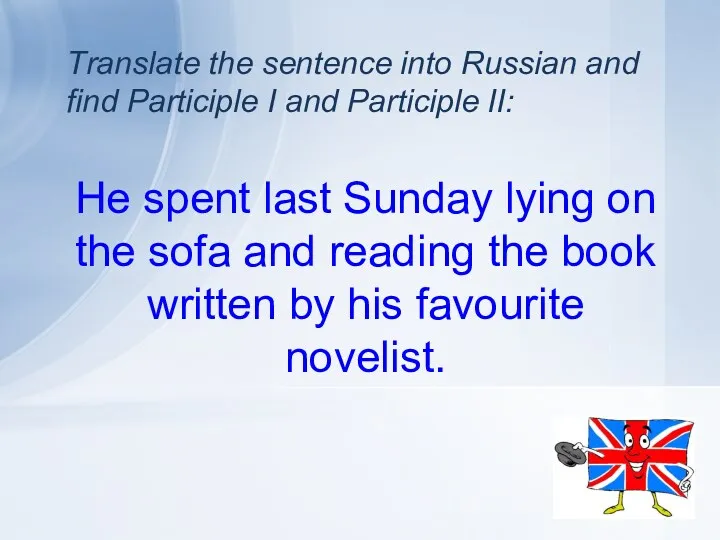 Тranslate the sentence into Russian and find Participle I and Participle II
 Неправильные глаголы
 Reading cards. Phonics
 Who wants to be a millionaire
 Twenty one pilots
 Modern English language. Early Modern English
 Do you believe these jobs exist
 Cinema. Movies
 Financial information
 Past simple and irregular verbs
 The tatars
 How are you?
 Italian food
 General review of Great Britain
 Teaching Reading
 Наречия too и enough
 Future simple
 Environment
 Shanghai Cooperation Organization (SCO)
 I can do
 Знакомство с английским языком