- How Has the Aral Sea Changed Over Time

Содержание
- 2. As shown in these satellite images, the Aral Sea dramatically changed in size from August 2000
- 3. The Aral Sea in central Asia is drying up. Rivers that once flowed into the lake
- 4. This photo shows abandoned boats in the now dry parts of the Aral Sea. Photo Credit:
- 5. Research Question: How has the Aral Sea changed over time? Prediction: We think that the loss
- 6. We used ImageJ to analyze NASA MODIS satellite images from the World of Change collection at
- 7. Import all eleven images into ImageJ to create a stack Animate the stack to observe the
- 8. Use the free hand selection tool to measure the area of the lake in each image.
- 9. In 1960, the width across the Aral Sea was 235.625 km. By 2009, that width was
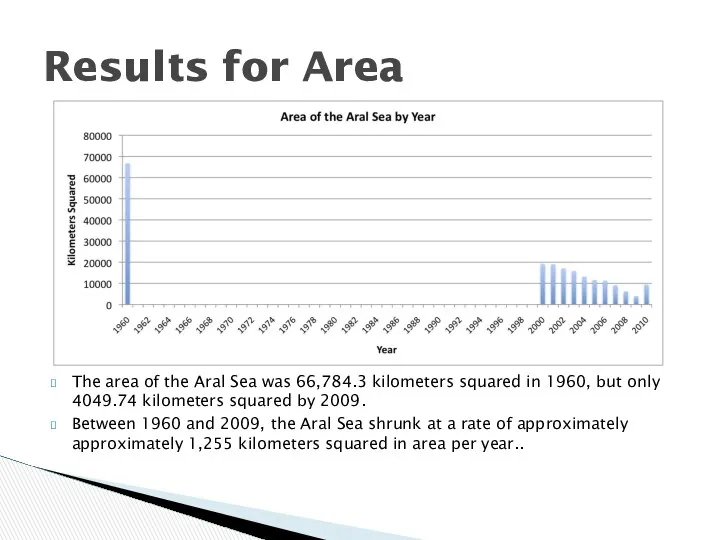
- 10. The area of the Aral Sea was 66,784.3 kilometers squared in 1960, but only 4049.74 kilometers
- 11. In 1960, the width across the Aral Sea was 235.625 km. By 2009, that width was
- 12. Based upon the data we collected and the graphs we produced, Aral Sea is shrinking at
- 13. Through the years, the distance loss across the left side of the lake is less than
- 15. Скачать презентацию
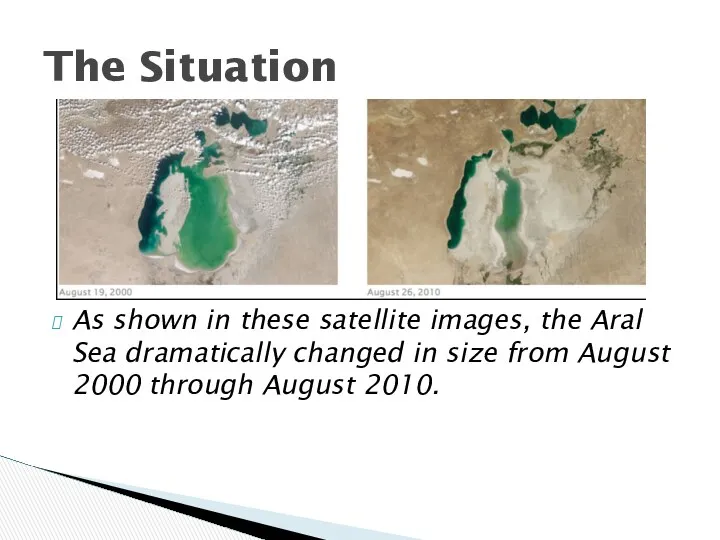
As shown in these satellite images, the Aral Sea dramatically changed
As shown in these satellite images, the Aral Sea dramatically changed
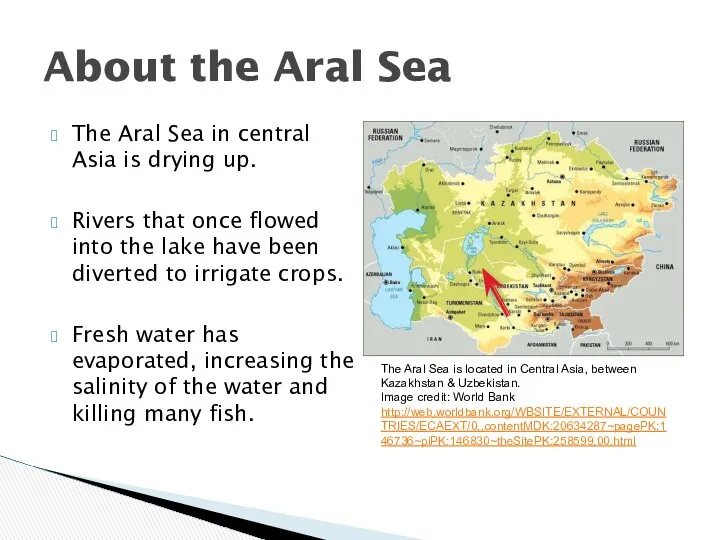
The Aral Sea in central Asia is drying up.
Rivers that
The Aral Sea in central Asia is drying up.
Rivers that
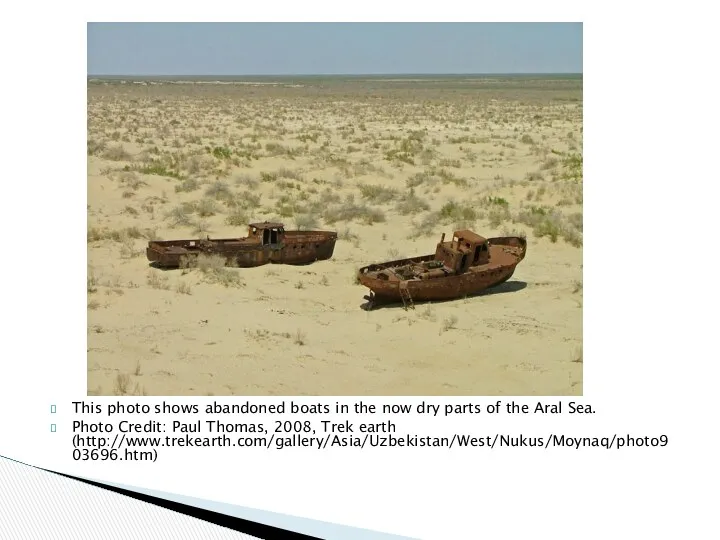
This photo shows abandoned boats in the now dry parts of
This photo shows abandoned boats in the now dry parts of
Research Question: How has the Aral Sea changed over time?
Prediction: We
Research Question: How has the Aral Sea changed over time?
Prediction: We
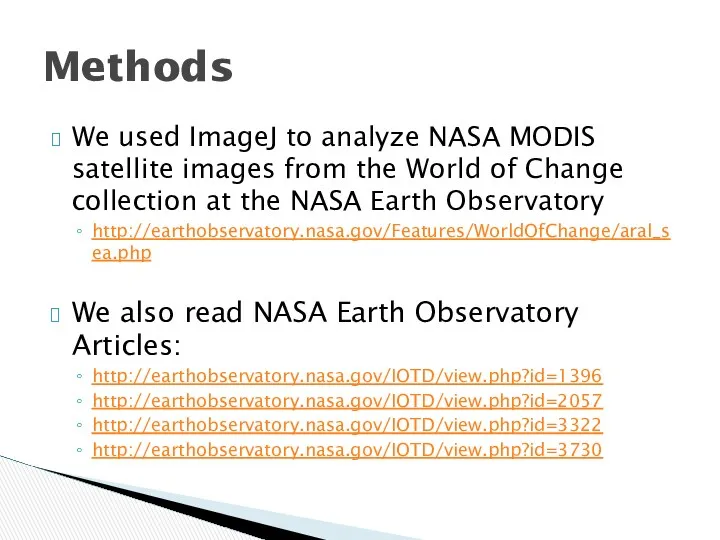
We used ImageJ to analyze NASA MODIS satellite images from the
We used ImageJ to analyze NASA MODIS satellite images from the
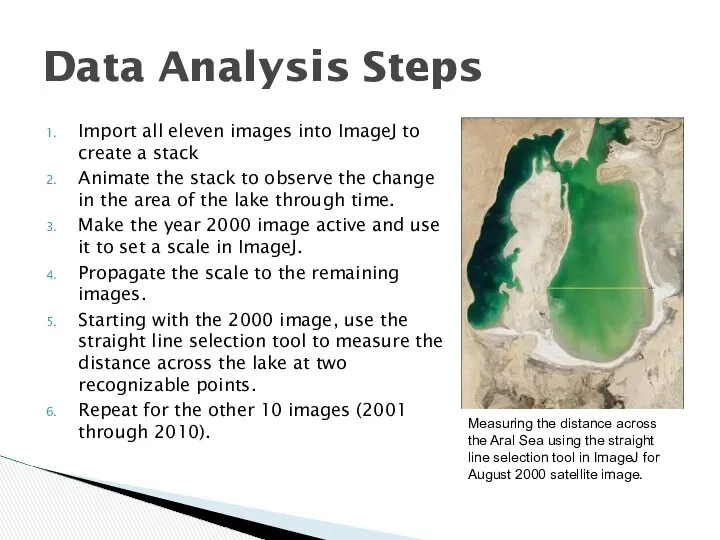
Import all eleven images into ImageJ to create a stack
Animate the
Import all eleven images into ImageJ to create a stack
Animate the
Use the free hand selection tool to measure the area of
Use the free hand selection tool to measure the area of
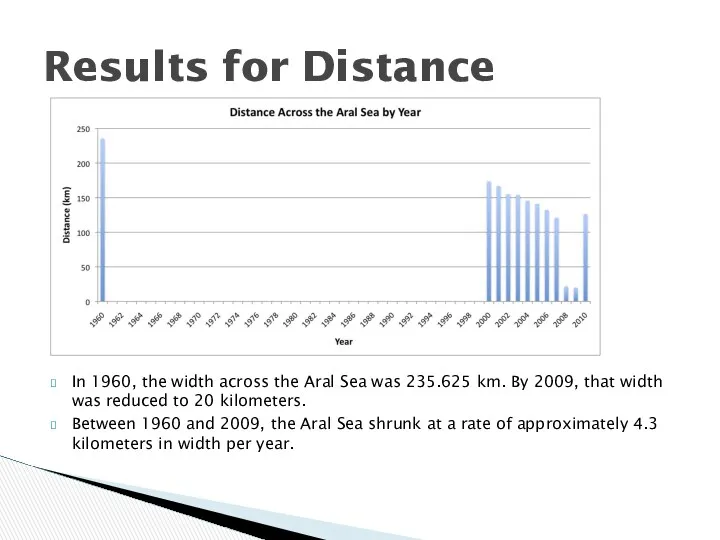
In 1960, the width across the Aral Sea was 235.625 km.
In 1960, the width across the Aral Sea was 235.625 km.
The area of the Aral Sea was 66,784.3 kilometers squared in
The area of the Aral Sea was 66,784.3 kilometers squared in
In 1960, the width across the Aral Sea was 235.625 km.
In 1960, the width across the Aral Sea was 235.625 km.
Based upon the data we collected and the graphs we produced,
Based upon the data we collected and the graphs we produced,
Through the years, the distance loss across the left side of
Through the years, the distance loss across the left side of
 London
 Around town
 Asking and Giving directions
 Past progressive tense
 Устная часть по английскому языку Основного Государственного Экзамена (ОГЭ)
 Грамматические вопросы перевода (структура предложения, артикль, глаголы в пассивном залоге, инфинитив и инфинитивные обороты)
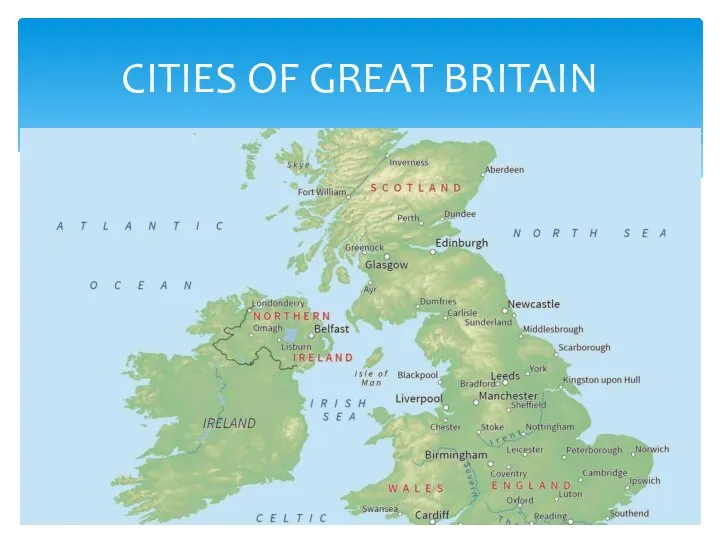 Cities Of Great Britain
 Saint Patrick's day
 Тренажёр. ЕГЭ. Устная часть. Task 3
 Clothes
 Fitness. A sound mind in a sound body
 How old are you?
 How to get a job
 Говорение (монологическая речь)
 The Object Model
 My home
 klass_po_teme
 Venezuela (Bolivarian Republic of Venezuela)
 Famous people of Great Britain
 Alexander Ovechkin
 Change of guard
 Winter holidays. Is It for the rich only?
 Harry Potter (game)
 Daily Routines
 Direct and reported speech (Прямая и косвенная речь)
 The water cycle
 Present simple - to be
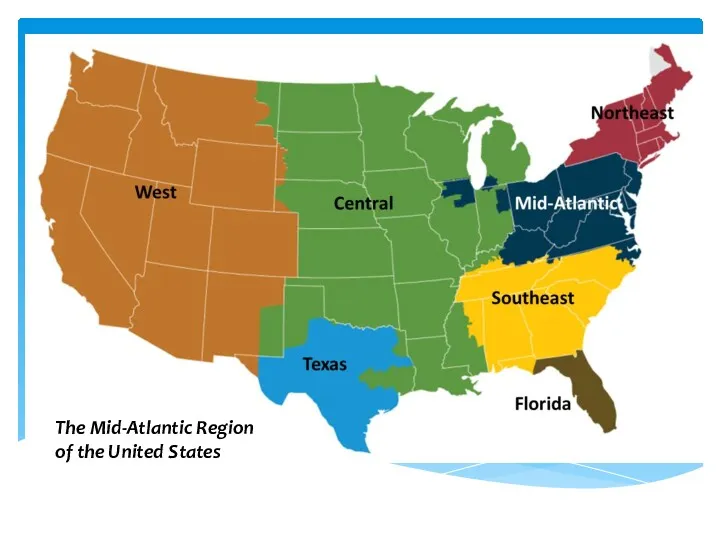 The Mid-Atlantic Region of the United States