- Implementation of business excellence models

Содержание
- 2. Introduction: The function of the selected organization
- 3. BE Module Used: EFQM
- 4. Pillar 1: Leadership Shortcomings and further improvement. There is Organization well define Vision with Strategy, notice
- 5. Pillar 1: Leadership Shortcomings and further improvement. Second-line leaders defined but not well coach and qualified.
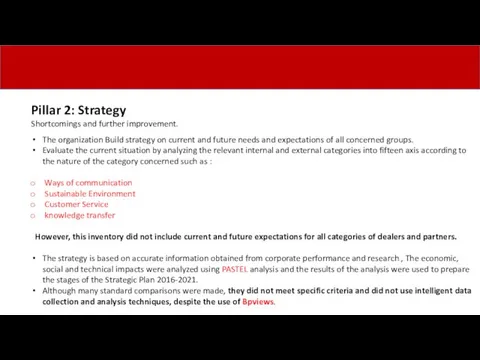
- 6. Pillar 2: Strategy Shortcomings and further improvement. The organization Build strategy on current and future needs
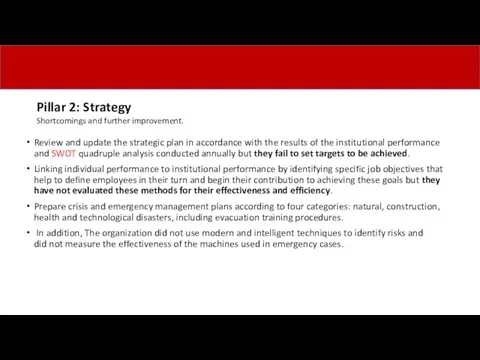
- 7. Review and update the strategic plan in accordance with the results of the institutional performance and
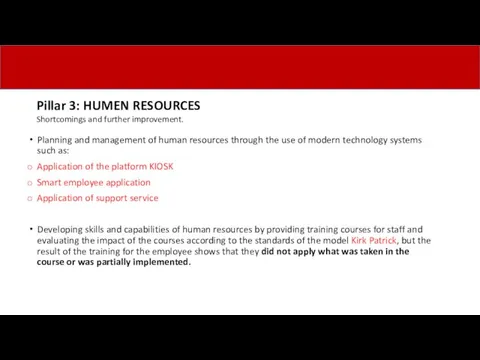
- 8. Planning and management of human resources through the use of modern technology systems such as: Application
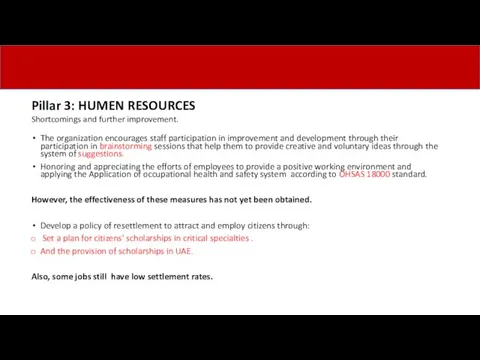
- 9. The organization encourages staff participation in improvement and development through their participation in brainstorming sessions that
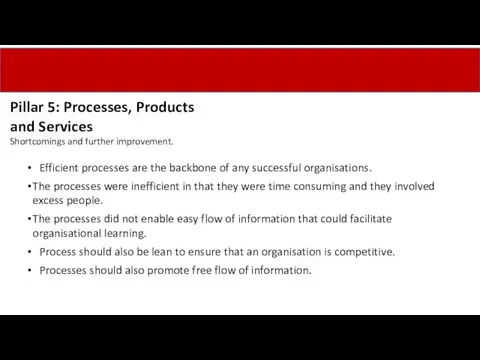
- 10. Pillar 5: Processes, Products and Services Shortcomings and further improvement. Efficient processes are the backbone of
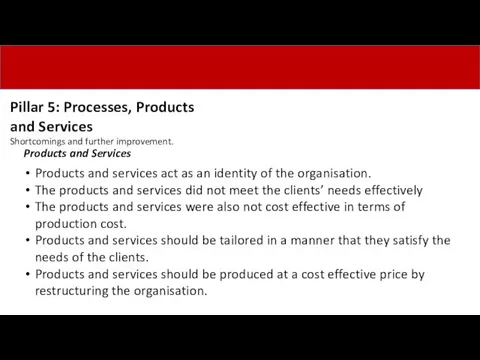
- 11. Pillar 5: Processes, Products and Services Shortcomings and further improvement. Products and Services Products and services
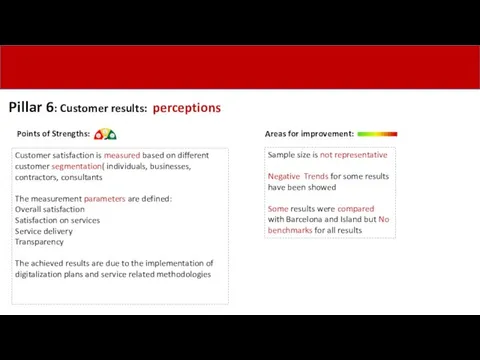
- 12. Pillar 6: Customer results: perceptions Areas for improvement: Sample size is not representative Negative Trends for
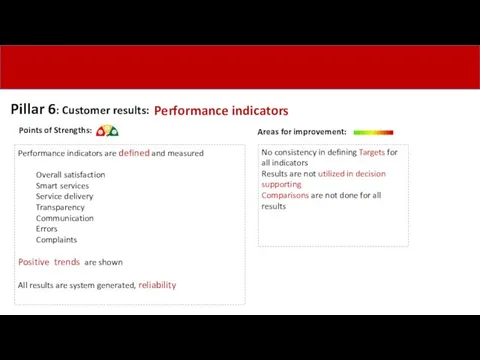
- 13. Pillar 6: Customer results: Performance indicators Areas for improvement: No consistency in defining Targets for all
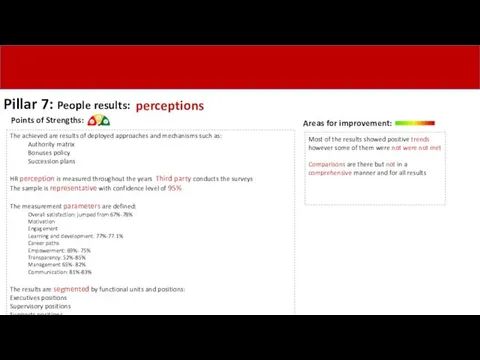
- 14. Pillar 7: People results: The achieved are results of deployed approaches and mechanisms such as: Authority
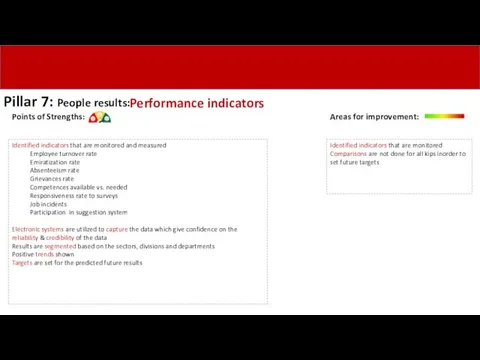
- 15. Pillar 7: People results: Performance indicators Areas for improvement: Identified indicators that are monitored and measured
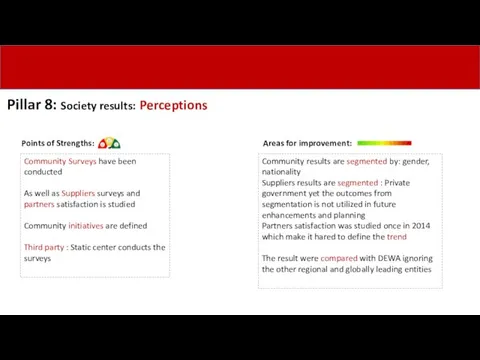
- 16. Pillar 8: Society results: Perceptions Areas for improvement: Community Surveys have been conducted As well as
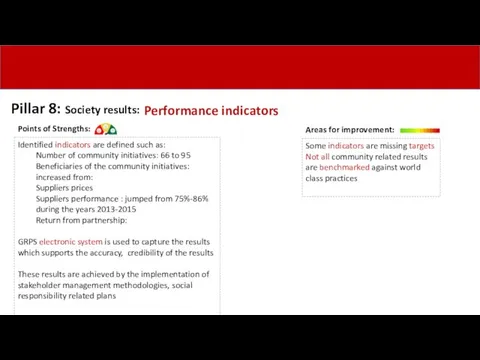
- 17. Pillar 8: Society results: Performance indicators Areas for improvement: Identified indicators are defined such as: Number
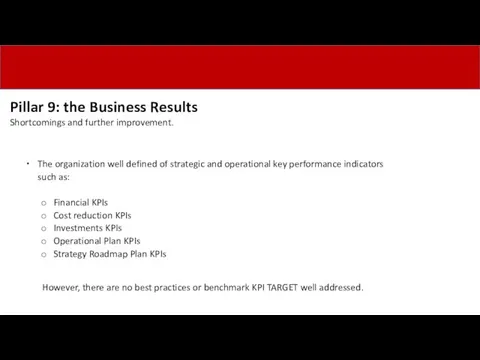
- 18. Pillar 9: the Business Results Shortcomings and further improvement. The organization well defined of strategic and
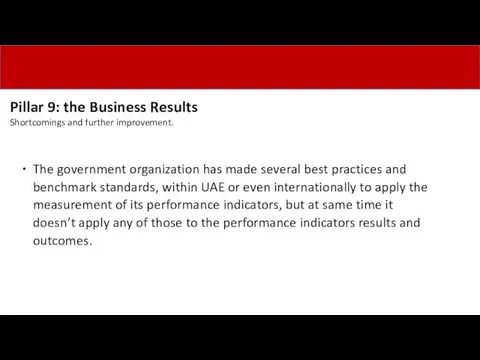
- 19. Pillar 9: the Business Results Shortcomings and further improvement. The government organization has made several best
- 21. Скачать презентацию
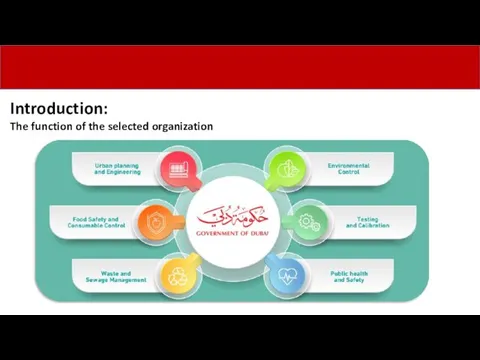
Introduction:
The function of the selected organization
Introduction:
The function of the selected organization
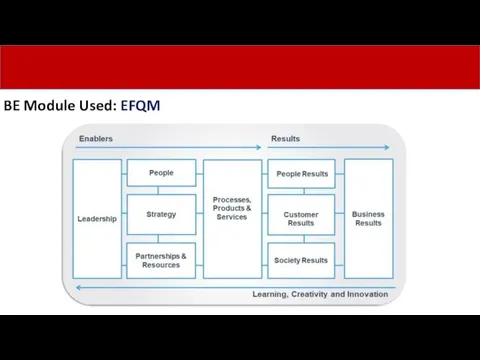
BE Module Used: EFQM
BE Module Used: EFQM
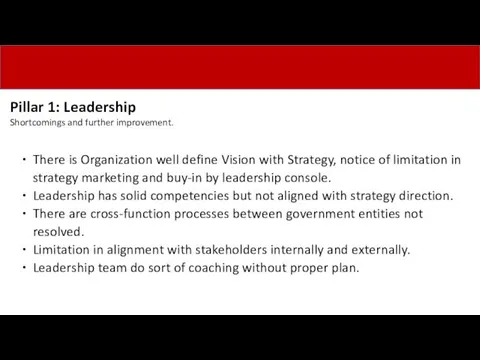
Pillar 1: Leadership
Shortcomings and further improvement.
There is Organization well define Vision
Pillar 1: Leadership
Shortcomings and further improvement.
There is Organization well define Vision
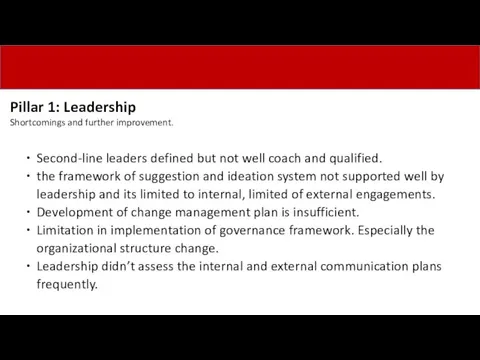
Pillar 1: Leadership
Shortcomings and further improvement.
Second-line leaders defined but not well
Pillar 1: Leadership
Shortcomings and further improvement.
Second-line leaders defined but not well
Pillar 2: Strategy
Shortcomings and further improvement.
The organization Build strategy on current
Pillar 2: Strategy
Shortcomings and further improvement.
The organization Build strategy on current
Review and update the strategic plan in accordance with the results
Review and update the strategic plan in accordance with the results
Planning and management of human resources through the use of modern
Planning and management of human resources through the use of modern
The organization encourages staff participation in improvement and development through their
The organization encourages staff participation in improvement and development through their
Pillar 5: Processes, Products and Services
Shortcomings and further improvement.
Efficient processes are
Pillar 5: Processes, Products and Services
Shortcomings and further improvement.
Efficient processes are
Pillar 5: Processes, Products and Services
Shortcomings and further improvement.
Products and Services
Products
Pillar 5: Processes, Products and Services
Shortcomings and further improvement.
Products and Services
Products
Pillar 6: Customer results:
perceptions
Areas for improvement:
Sample size is not representative
Pillar 6: Customer results:
perceptions
Areas for improvement:
Sample size is not representative
Pillar 6: Customer results:
Performance indicators
Areas for improvement:
No consistency in defining
Pillar 6: Customer results:
Performance indicators
Areas for improvement:
No consistency in defining
Pillar 7: People results:
The achieved are results of deployed approaches and
Pillar 7: People results:
The achieved are results of deployed approaches and
Pillar 7: People results:
Performance indicators
Areas for improvement:
Identified indicators that are
Pillar 7: People results:
Performance indicators
Areas for improvement:
Identified indicators that are
Pillar 8: Society results:
Perceptions
Areas for improvement:
Community Surveys have been conducted
As
Pillar 8: Society results:
Perceptions
Areas for improvement:
Community Surveys have been conducted
As
Pillar 8: Society results:
Performance indicators
Areas for improvement:
Identified indicators are defined
Pillar 8: Society results:
Performance indicators
Areas for improvement:
Identified indicators are defined
Pillar 9: the Business Results
Shortcomings and further improvement.
The organization well defined
Pillar 9: the Business Results
Shortcomings and further improvement.
The organization well defined
Pillar 9: the Business Results
Shortcomings and further improvement.
The government organization has
Pillar 9: the Business Results
Shortcomings and further improvement.
The government organization has
 English presentation Сountries, people, lifestyle: Ukraine
 Comparative adjectives
 ЕГЭ 2023. Устная часть. Variant 2
 Chapter 4, lesson 1. Inventors Change the World
 Let me introduce Canada
 Актуальные вопросы преподавания английского языка
 The role of barbarisms in literary text
 I love/ I hate: любить/ненавидеть
 Russia – Brazil
 Music in our life
 What do you like
 Ecological problems
 Present continuous (progressive). Настоящее продолженное время
 Christmas in Britain
 Toys game (7)
 Loch Ness Monster
 Federative Republic of Brazil
 Kazakhstan
 Spin Wheel Question Words
 Australia
 Upstream Upper Intermediate
 Я рисую мир. Цветной урок
 “Functional styles”. Lecture 13
 Конструкция + as … as. Конструкция - not as … as, not so …as
 CANADA
 Borrowings to English language from sanskrit
 Adverbial clauses in English
 Present Perfect Continuous