- Method Validation and Verification Protocols for Test Methods

Содержание
- 2. What is it ? Method validation & verification provides objective evidence that a test method is
- 3. When it is required ? Method Validation : in-house and modified standard methods Method Verification :
- 4. Why it is necessary ? A test method must be shown to be fit for purpose
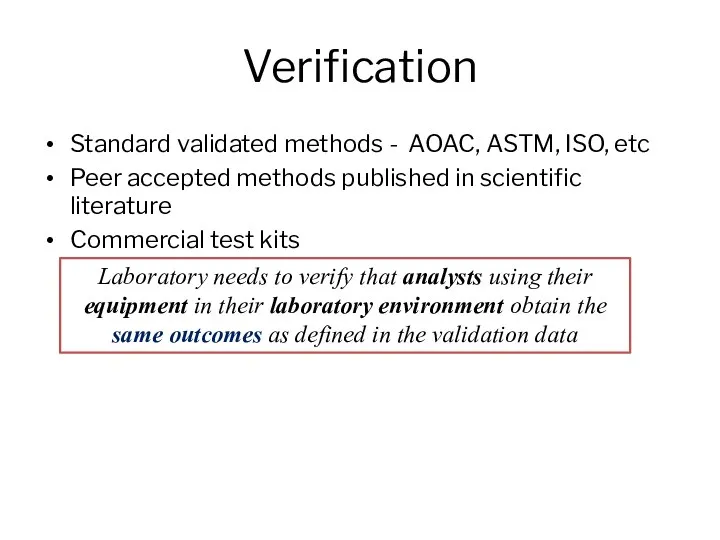
- 5. Verification Standard validated methods - AOAC, ASTM, ISO, etc Peer accepted methods published in scientific literature
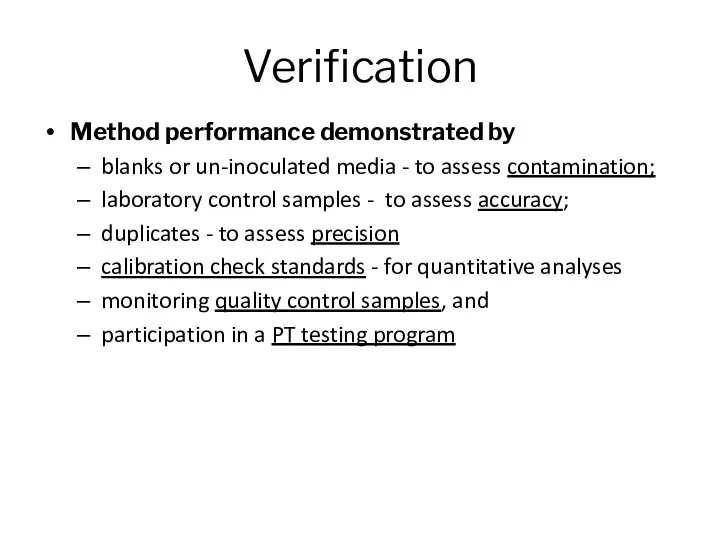
- 6. Verification Method performance demonstrated by blanks or un-inoculated media - to assess contamination; laboratory control samples
- 7. Some examples
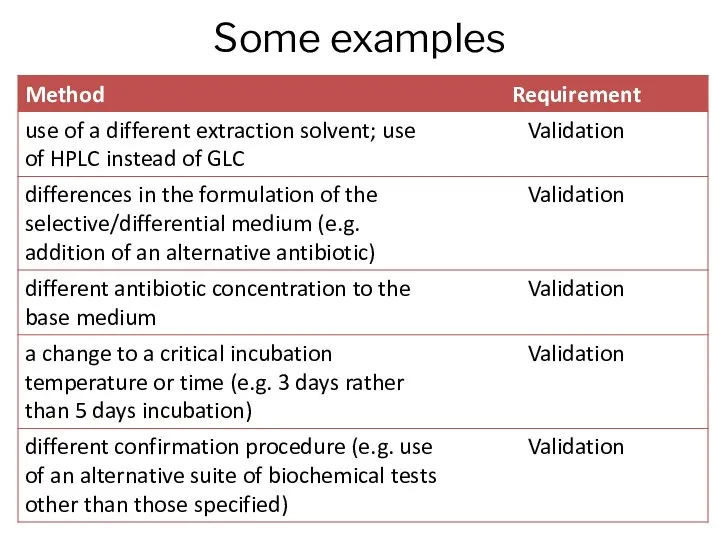
- 8. Some examples
- 9. Key parameters for verification
- 10. Validation Non-standard and in-house-developed methods Scope and validation criteria to be defined and documented Tools to
- 11. Types of Validation Comparative Validation To demonstrate equivalent performance between two methods (validated and revised analytical
- 12. Validation Two steps to specify what you intend to identify or measure to determine selected performance
- 13. Validation Parameters Linearity range Measuring interval Matrix effects Selectivity Sensitivity Accuracy . Precision Repeatability Reproducibility Trueness
- 14. Analytical Performance Characteristics Procedure Before validation, design, maintain, calibrate and validate the analytical system (protocol, conc.
- 15. 2. Linearity Test procedure : Prepare standard solutions at six concentrations, typically 25, 50, 75, 100,
- 16. 2. Linearity Acceptance criteria : The correlation coefficient for six conc. levels will be ≥ 0.999
- 17. 3. Range Test procedure : Use the data obtained during linearity and accuracy studies to assess
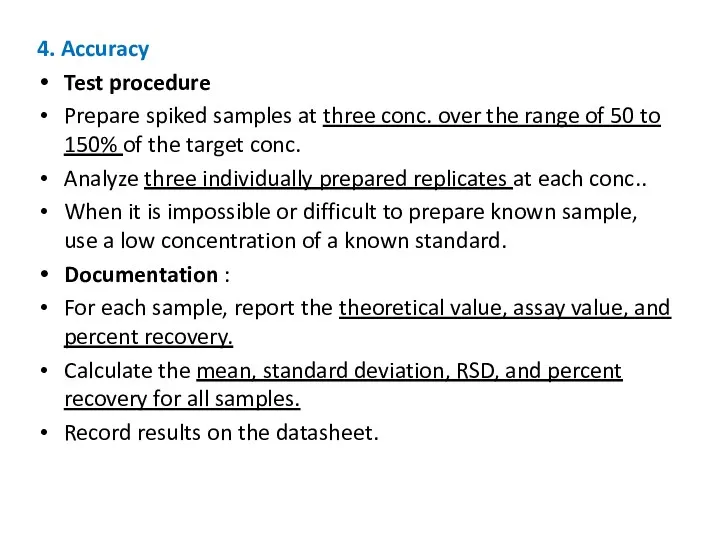
- 18. 4. Accuracy Test procedure Prepare spiked samples at three conc. over the range of 50 to
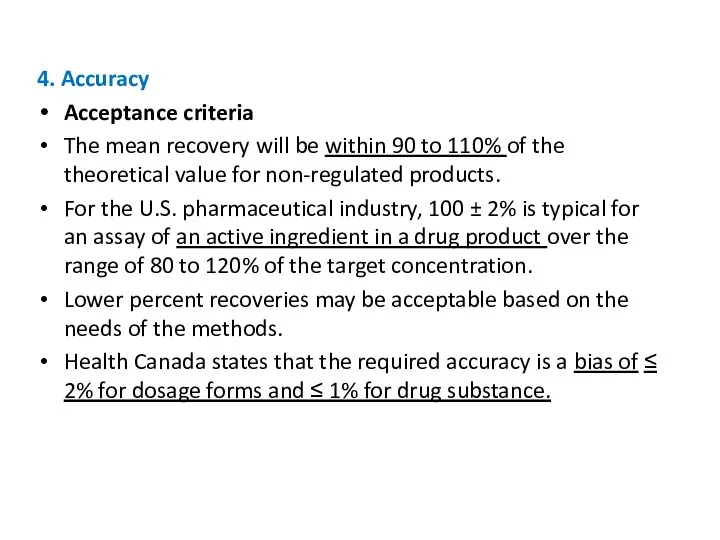
- 19. 4. Accuracy Acceptance criteria The mean recovery will be within 90 to 110% of the theoretical
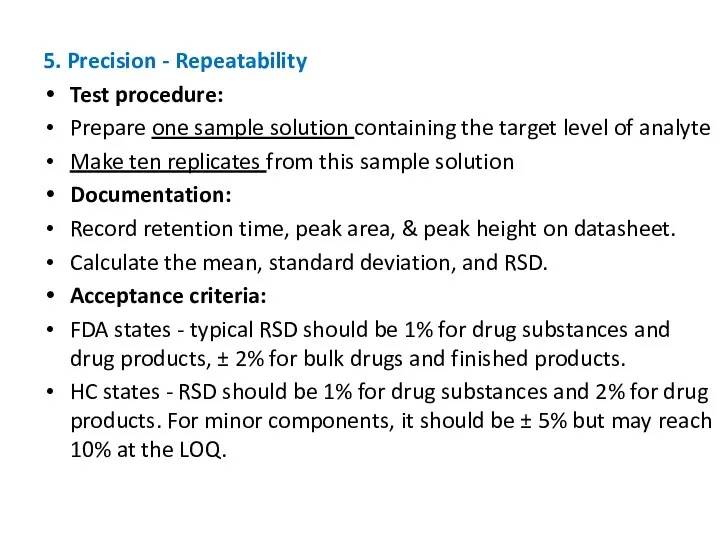
- 20. 5. Precision - Repeatability Test procedure: Prepare one sample solution containing the target level of analyte
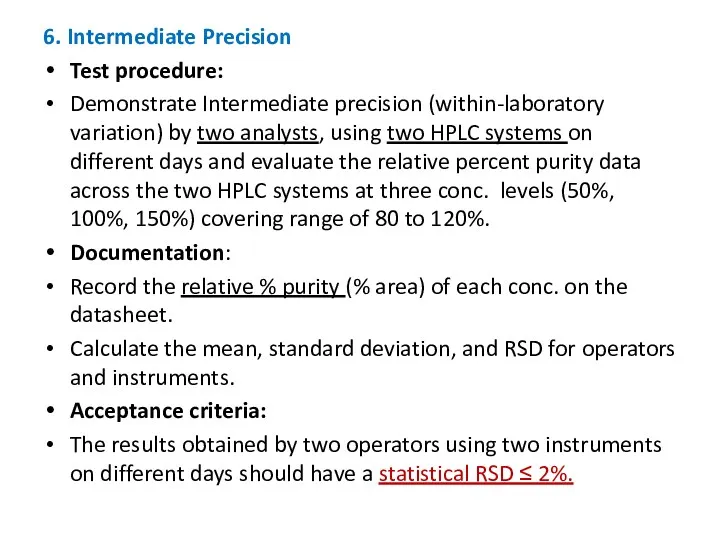
- 21. 6. Intermediate Precision Test procedure: Demonstrate Intermediate precision (within-laboratory variation) by two analysts, using two HPLC
- 22. 7. Limit of Detection Test procedure Determine the lowest concentration of the standard solution by sequentially
- 23. 8. Limit of Quantitation Test procedure Determine the lowest concentration at which an analyte in the
- 24. 8. Limit of Quantitation Acceptance criteria: The limit of quantitation for chromatographic methods is described as
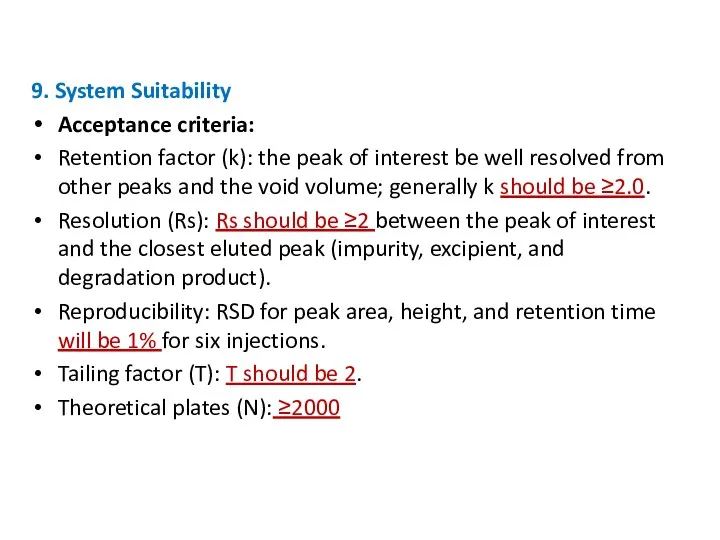
- 25. 9. System Suitability Test procedure Perform system suitability tests on both HPLC systems to determine the
- 26. 9. System Suitability Acceptance criteria: Retention factor (k): the peak of interest be well resolved from
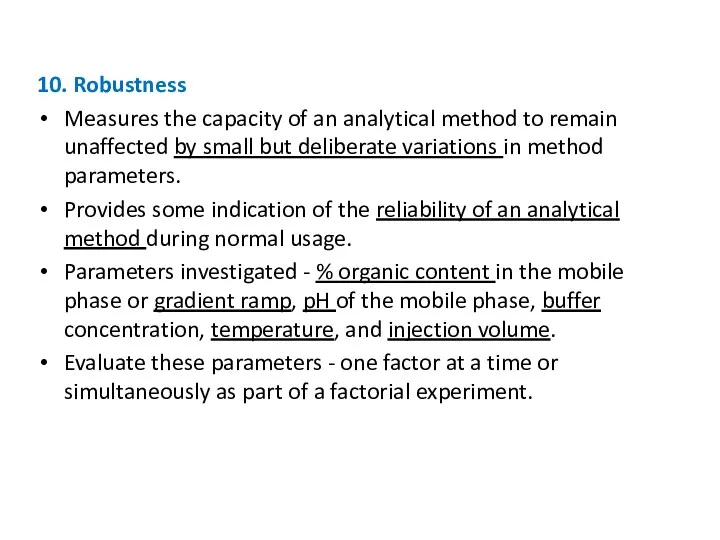
- 27. 10. Robustness Measures the capacity of an analytical method to remain unaffected by small but deliberate
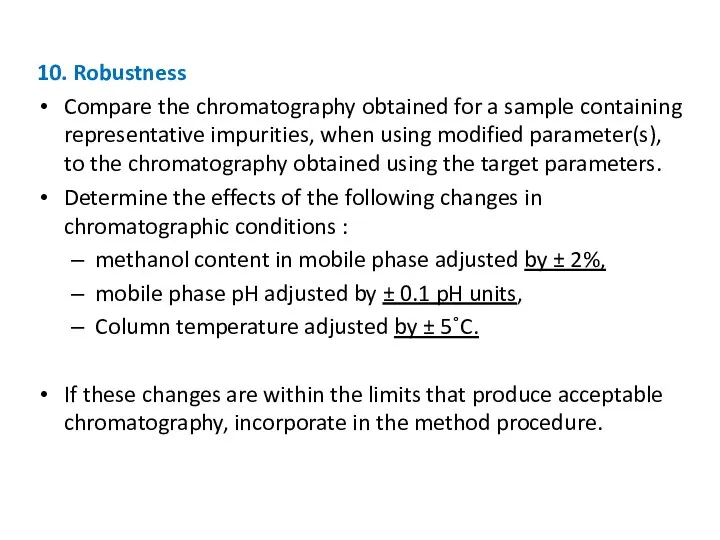
- 28. 10. Robustness Compare the chromatography obtained for a sample containing representative impurities, when using modified parameter(s),
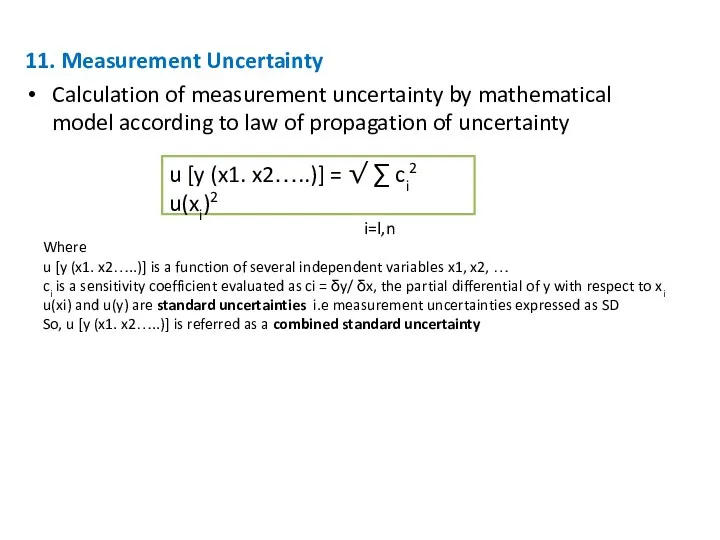
- 29. 11. Measurement Uncertainty Calculation of measurement uncertainty by mathematical model according to law of propagation of
- 30. Estimation of Uncertainty Uncertainty calculation for Chloramphenicol analysis Type A and Type B errors are the
- 31. Type A Error Type B Uncertainty due to Equipments
- 32. ii. Uncertainty due to Chemicals and CRM (Upur) iii. Due to Standard Uncertainty Glassware (Ug)
- 34. Скачать презентацию
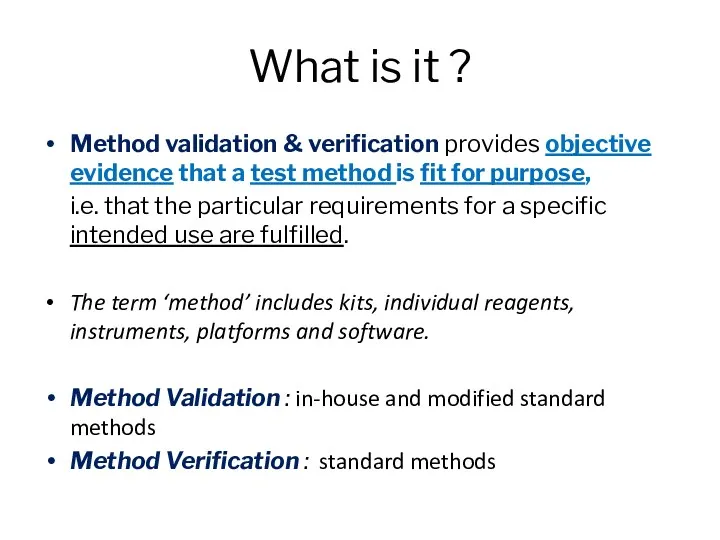
What is it ?
Method validation & verification provides objective evidence that
What is it ?
Method validation & verification provides objective evidence that
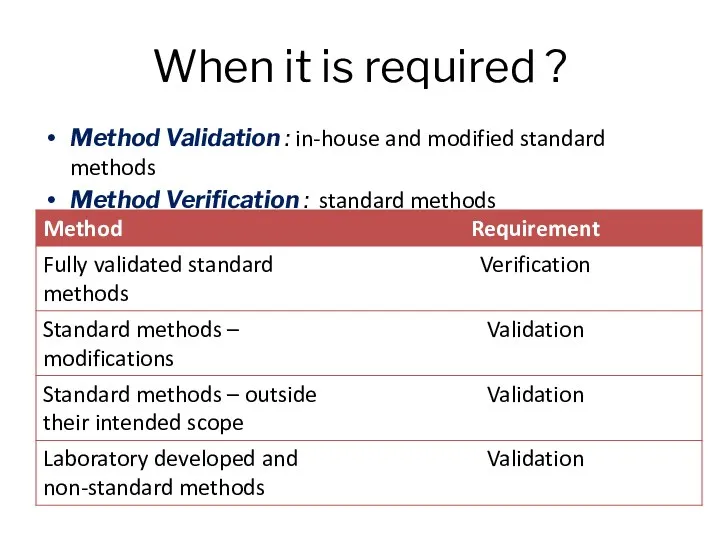
When it is required ?
Method Validation : in-house and modified standard
When it is required ?
Method Validation : in-house and modified standard
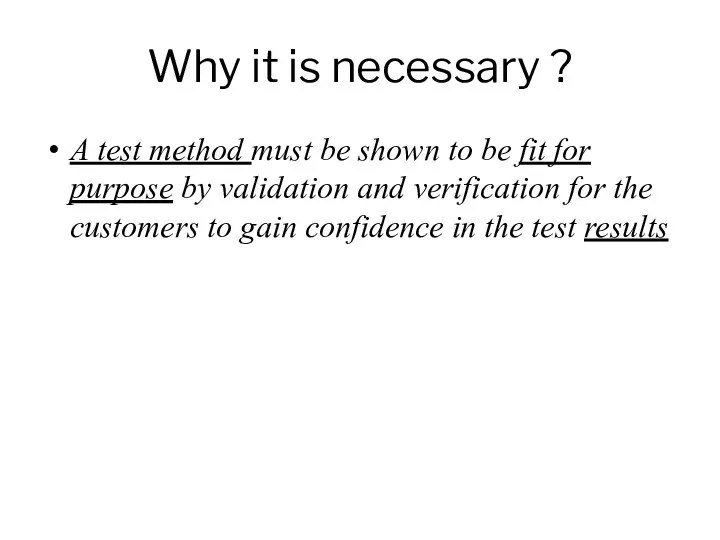
Why it is necessary ?
A test method must be shown to
Why it is necessary ?
A test method must be shown to
Verification
Standard validated methods - AOAC, ASTM, ISO, etc
Peer accepted methods
Verification
Standard validated methods - AOAC, ASTM, ISO, etc
Peer accepted methods
Verification
Method performance demonstrated by
blanks or un-inoculated media - to
Verification
Method performance demonstrated by
blanks or un-inoculated media - to
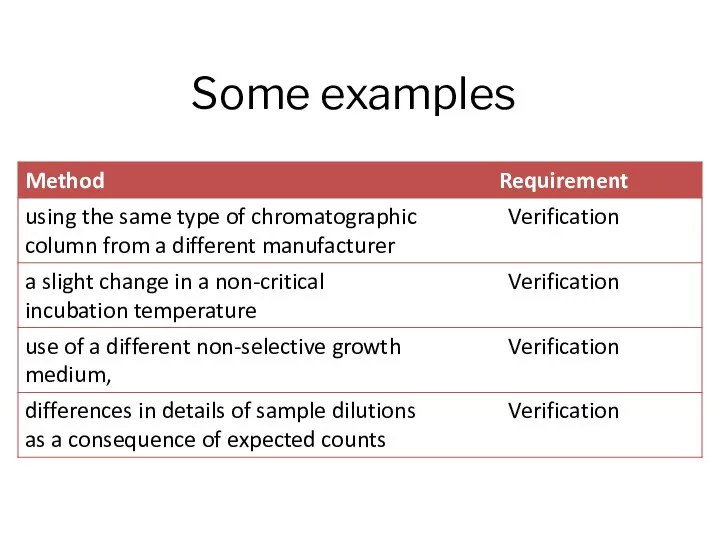
Some examples
Some examples
Some examples
Some examples
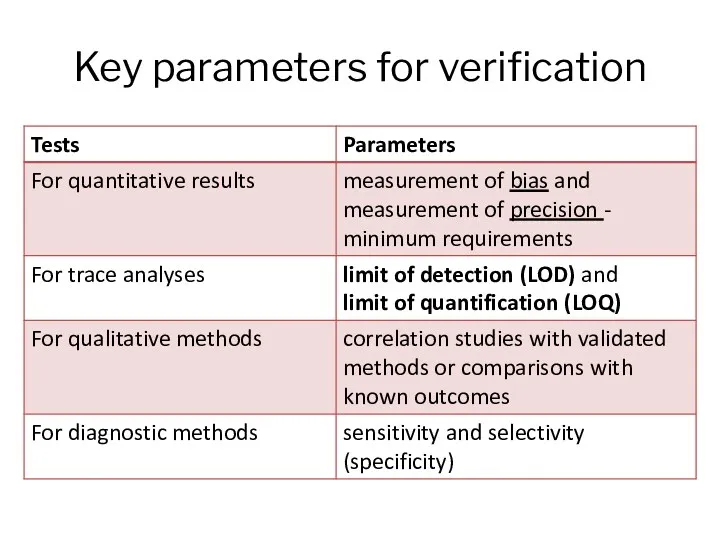
Key parameters for verification
Key parameters for verification
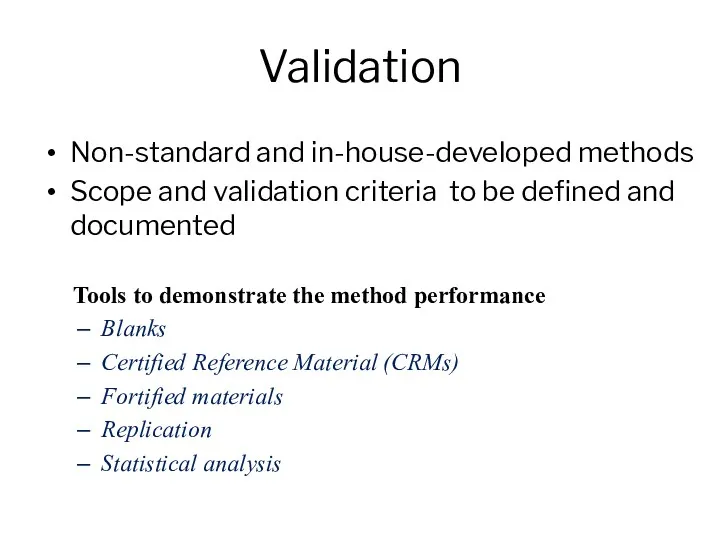
Validation
Non-standard and in-house-developed methods
Scope and validation criteria to be defined
Validation
Non-standard and in-house-developed methods
Scope and validation criteria to be defined
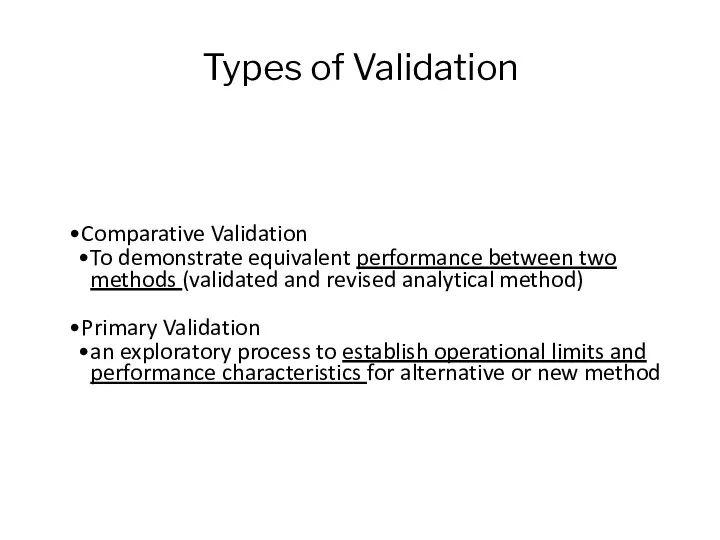
Types of Validation
Comparative Validation
To demonstrate equivalent performance between two methods (validated
Types of Validation
Comparative Validation
To demonstrate equivalent performance between two methods (validated
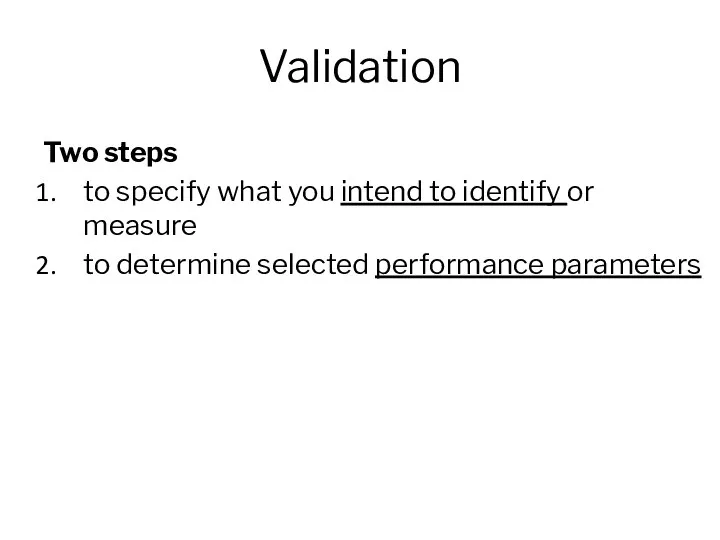
Validation
Two steps
to specify what you intend to identify or measure
to determine
Validation
Two steps
to specify what you intend to identify or measure
to determine
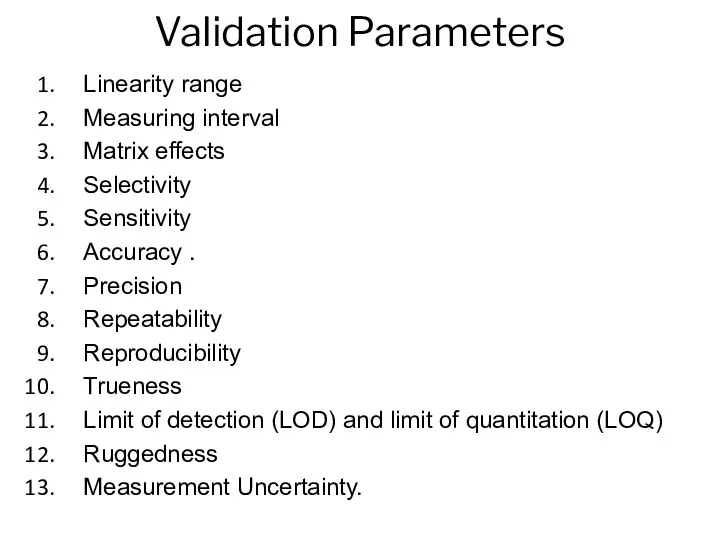
Validation Parameters
Linearity range
Measuring interval
Matrix effects
Selectivity
Sensitivity
Accuracy .
Precision
Repeatability
Reproducibility
Trueness
Limit of detection (LOD) and limit
Validation Parameters
Linearity range
Measuring interval
Matrix effects
Selectivity
Sensitivity
Accuracy .
Precision
Repeatability
Reproducibility
Trueness
Limit of detection (LOD) and limit
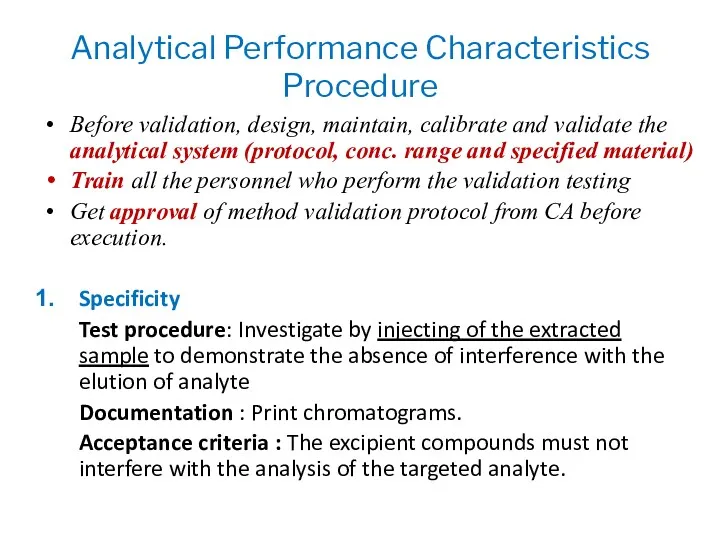
Analytical Performance Characteristics Procedure
Before validation, design, maintain, calibrate and validate the
Analytical Performance Characteristics Procedure
Before validation, design, maintain, calibrate and validate the
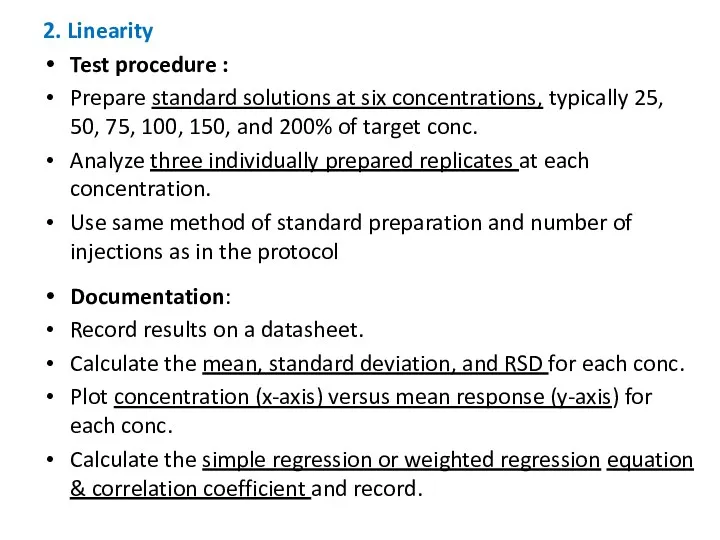
2. Linearity
Test procedure :
Prepare standard solutions at six concentrations,
2. Linearity
Test procedure :
Prepare standard solutions at six concentrations,
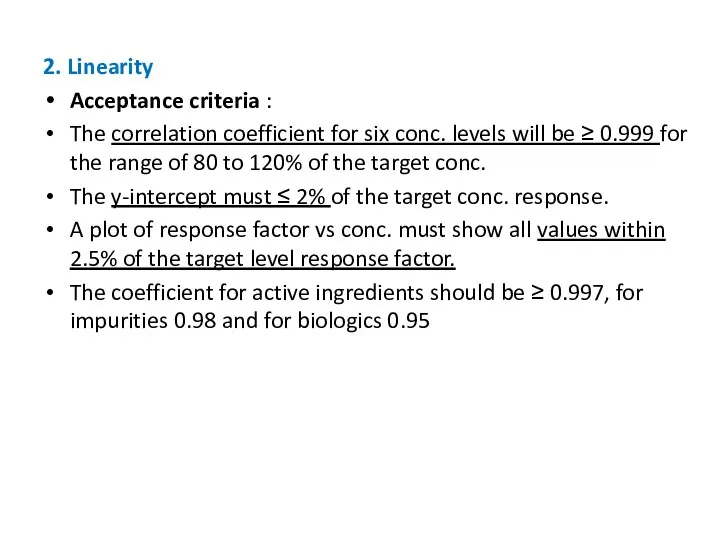
2. Linearity
Acceptance criteria :
The correlation coefficient for six conc.
2. Linearity
Acceptance criteria :
The correlation coefficient for six conc.
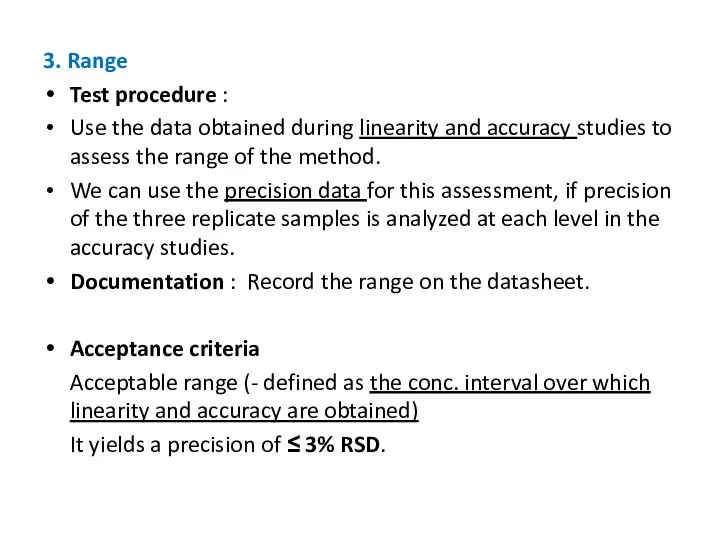
3. Range
Test procedure :
Use the data obtained during linearity
3. Range
Test procedure :
Use the data obtained during linearity
4. Accuracy
Test procedure
Prepare spiked samples at three conc. over
4. Accuracy
Test procedure
Prepare spiked samples at three conc. over
4. Accuracy
Acceptance criteria
The mean recovery will be within 90
4. Accuracy
Acceptance criteria
The mean recovery will be within 90
5. Precision - Repeatability
Test procedure:
Prepare one sample solution containing
5. Precision - Repeatability
Test procedure:
Prepare one sample solution containing
6. Intermediate Precision
Test procedure:
Demonstrate Intermediate precision (within-laboratory variation) by two
6. Intermediate Precision
Test procedure:
Demonstrate Intermediate precision (within-laboratory variation) by two
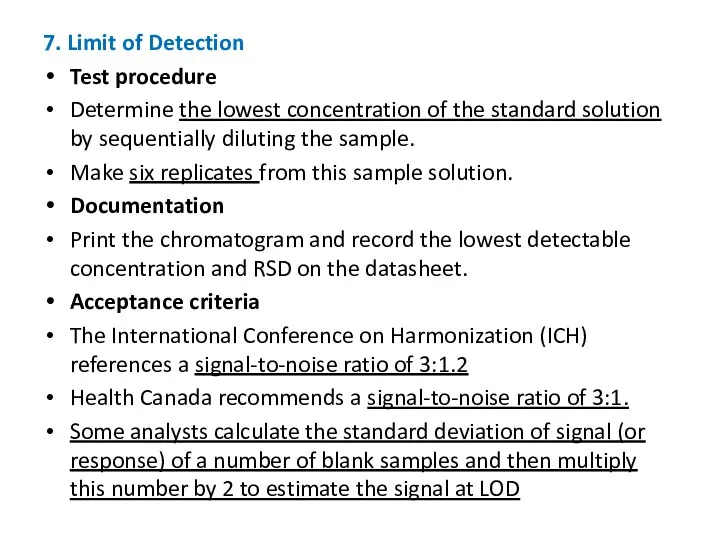
7. Limit of Detection
Test procedure
Determine the lowest concentration of
7. Limit of Detection
Test procedure
Determine the lowest concentration of
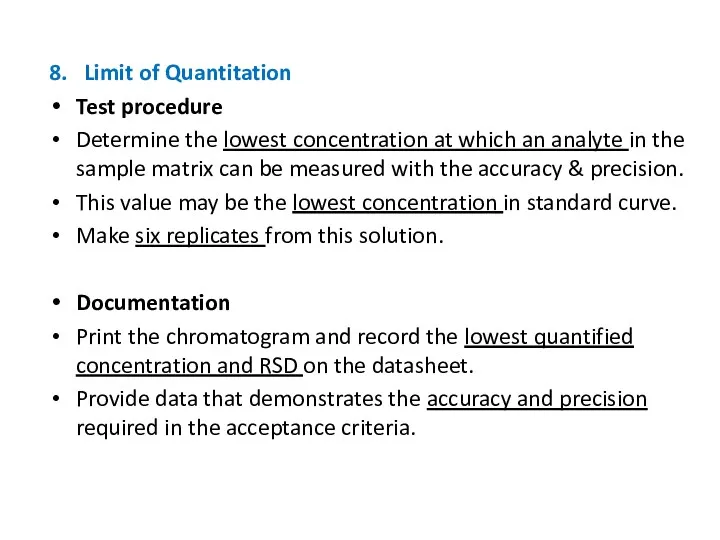
8. Limit of Quantitation
Test procedure
Determine the lowest concentration at
8. Limit of Quantitation
Test procedure
Determine the lowest concentration at
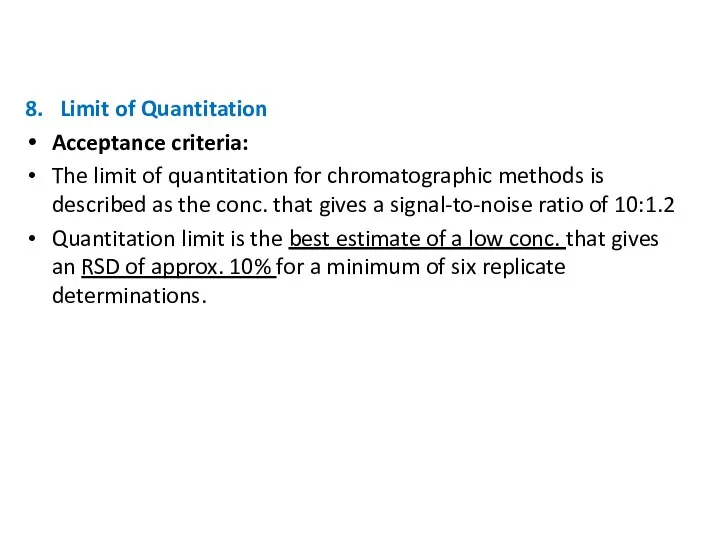
8. Limit of Quantitation
Acceptance criteria:
The limit of quantitation for
8. Limit of Quantitation
Acceptance criteria:
The limit of quantitation for
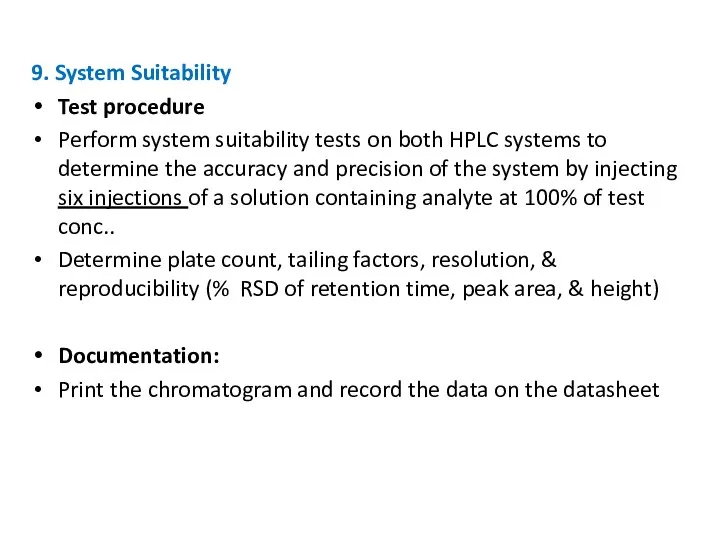
9. System Suitability
Test procedure
Perform system suitability tests on both
9. System Suitability
Test procedure
Perform system suitability tests on both
9. System Suitability
Acceptance criteria:
Retention factor (k): the peak of interest
9. System Suitability
Acceptance criteria:
Retention factor (k): the peak of interest
10. Robustness
Measures the capacity of an analytical method to remain
10. Robustness
Measures the capacity of an analytical method to remain
10. Robustness
Compare the chromatography obtained for a sample containing representative
10. Robustness
Compare the chromatography obtained for a sample containing representative
11. Measurement Uncertainty
Calculation of measurement uncertainty by mathematical model according to
11. Measurement Uncertainty
Calculation of measurement uncertainty by mathematical model according to
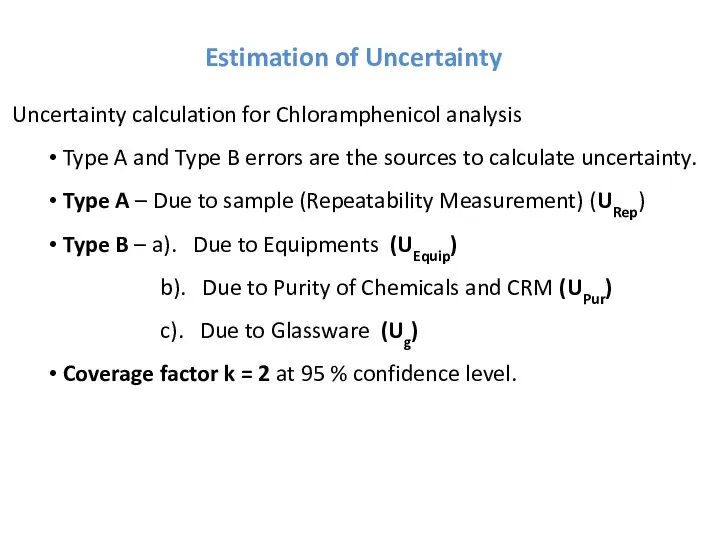
Estimation of Uncertainty
Uncertainty calculation for Chloramphenicol analysis
Type A and Type
Estimation of Uncertainty
Uncertainty calculation for Chloramphenicol analysis
Type A and Type
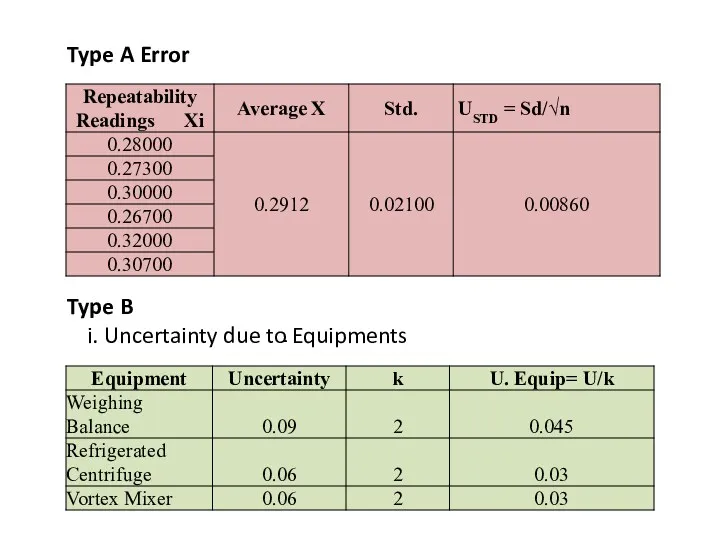
Type A Error
Type B
Uncertainty due to Equipments
Type A Error
Type B
Uncertainty due to Equipments
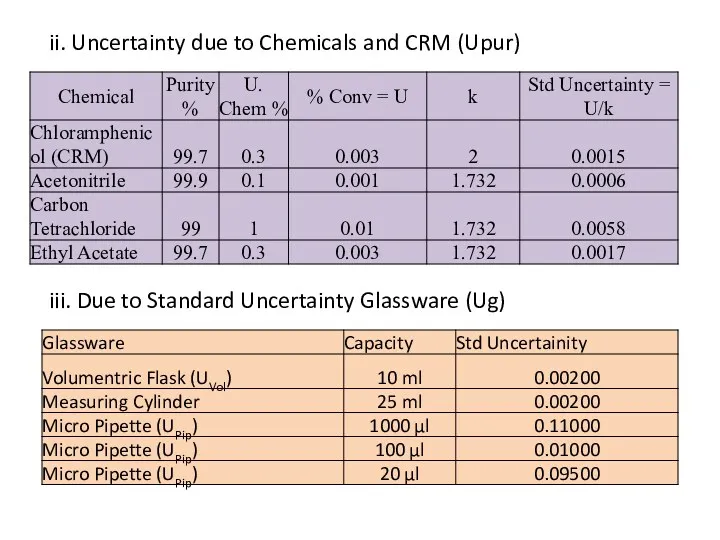
ii. Uncertainty due to Chemicals and CRM (Upur)
iii. Due to Standard
ii. Uncertainty due to Chemicals and CRM (Upur)
iii. Due to Standard
 Gerund and Infinitive
 The present indefinite tense
 English. Oral texts
 Уровни перевода
 Comparatives and Superlatives
 Beautiful places
 Teenagers and their problem
 Good and bad habits
 READ and LEARN
 Speakout Pre - Intermediate. Question forms
 Instructions for writing the solution paragraph
 Impressionizm
 Young Heroes of the War 1941-1945
 Snow
Snow Habits. Used to
 Verb to have got
 Education abroad I had like
 TV programmes
 Sport facilities of my university
 School What is school for you?
 Police of the Russian Federation
 Present perfect tense
 Choice of profession
 Peter’s family
 Animals and parts of the body
 Customs and traditions in Great Britain. Обычаи и традиции
 About the person that is writing in this place. Something about
 Yale university