- Writing task 1. General information

Содержание
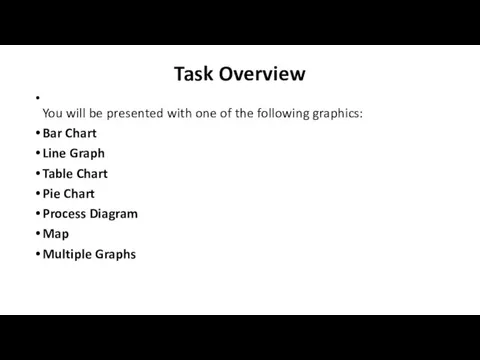
- 2. Task Overview You will be presented with one of the following graphics: Bar Chart Line Graph
- 3. You are required to write a short report about the main features. For example, you may
- 4. The format of the question will always be the same. It will include: Sentence 1 –
- 5. Sentence 2 (The instructions) tells you what you have to do. You must do 3 things:
- 7. Скачать презентацию
Task Overview
You will be presented with one of the following graphics:
Bar
Task Overview
You will be presented with one of the following graphics:
Bar
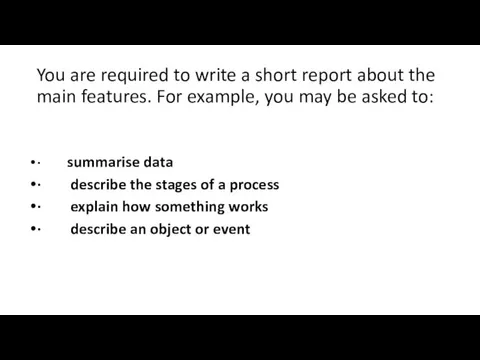
You are required to write a short report about the main
You are required to write a short report about the main
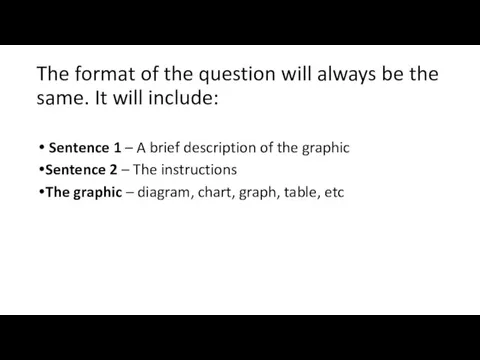
The format of the question will always be the same. It
The format of the question will always be the same. It
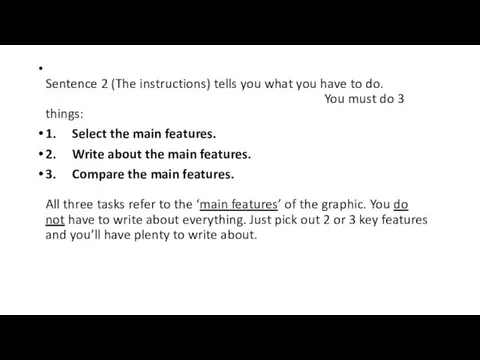
Sentence 2 (The instructions) tells you what you have to do.
Sentence 2 (The instructions) tells you what you have to do.
 Aleksei Brusilov distinguished commander of the First World War
 Japanese negotiating culture
 Sport in our life
 Welcome to Lincoln University New Zealand’s, specialist land-based university
 What can you see
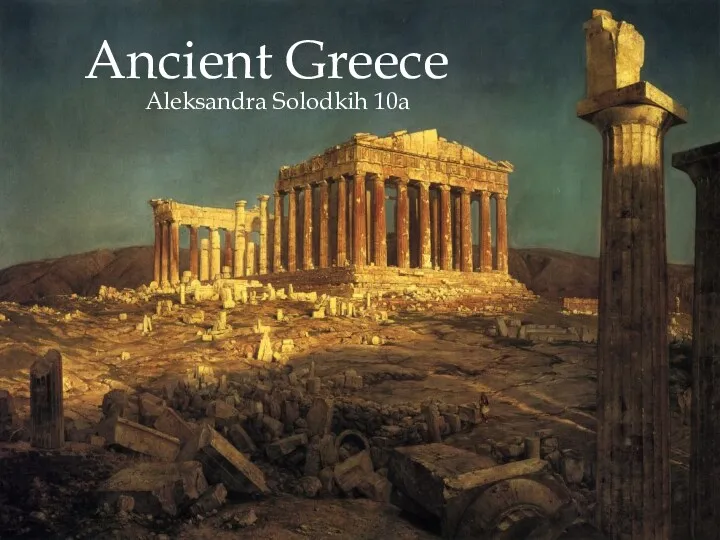 Ancient Greece
 Past Continuous. Прошедшее продолженное время
 Present Perfect \ Past Simple. Сравнение времен
 Christmas
 Present Simple Tense (настоящее простое время)
 Сказка Сундучок с золотыми монетами
 Animals old mac
 Work and profession. 9 класс
 Adjective. Productive suffixes
 So many countries. so many customs
 City of San Francisco
 Tenses Active Voice. The Present Simple Tense
 Physiological changes in breast during pregnancy
 Beirut
 My ideal school
 Everyday products
 Getting on well with the family. 5 класс
 Future tenses
 The competition learn to win
 Prepositions of place. Предлоги места
 Степени сравнения прилагательных. 4 класс
 Christmass in Germany
 Gabriela Restaurant of Czech cuisine