- G11.4A- Statistics: Standard Deviation, Error and t-test

Содержание
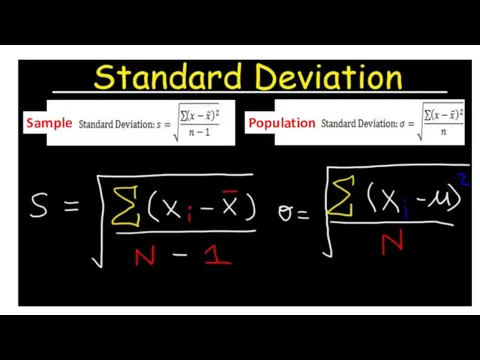
- 5. Sample Population
- 6. 1 mean of sample 1 2 mean of sample 2 n1 is number subjects in sample
- 7. The t-test Degrees of freedom Critical Value Standard deviation formula is also needed to solve for
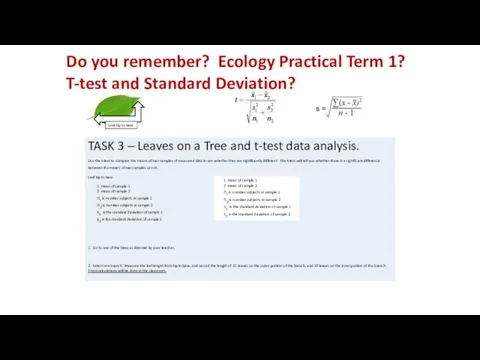
- 8. T-test - Is there significant difference between two means? Set up a chart that will help
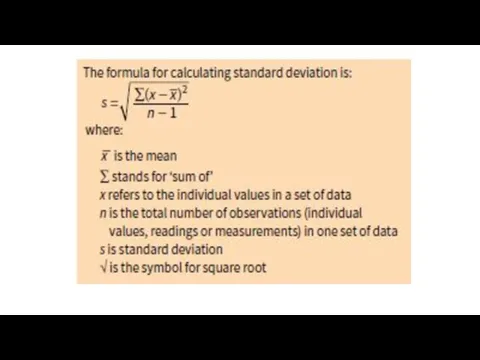
- 9. Standard Deviation A graphical expression of the distance between numbers. Standard deviation will give the +/-
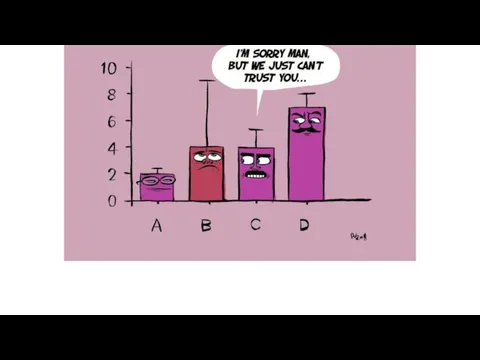
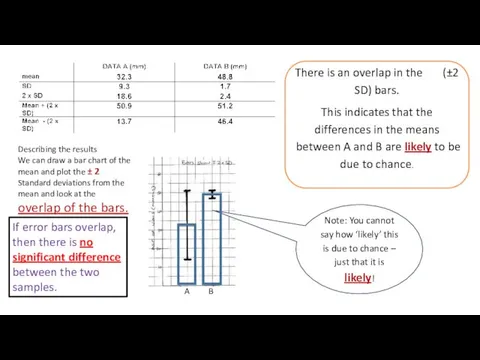
- 10. Describing the results We can draw a bar chart of the mean and plot the ±
- 11. There is an overlap in the (±2 SD) bars. This indicates that the differences in the
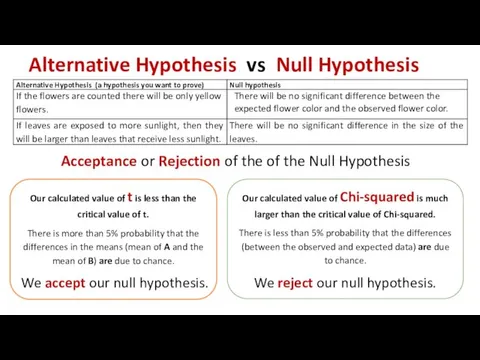
- 12. Alternative Hypothesis vs Null Hypothesis Our calculated value of Chi-squared is much larger than the critical
- 16. Woodland vs garden petals woodland garden petal Standard deviation formula Woodland garden
- 17. Calculating Standard Deviation Step 1: Find the mean. Step 2: For each data point, find the
- 18. Calculate Standard Error
- 20. Скачать презентацию

Sample
Population
Sample
Population
1 mean of sample 1
2 mean of sample 2
n1 is number
1 mean of sample 1
2 mean of sample 2
n1 is number
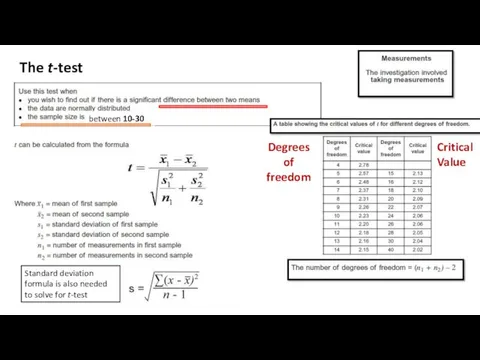
The t-test
Degrees of freedom
Critical
Value
Standard deviation formula is also needed to
The t-test
Degrees of freedom
Critical
Value
Standard deviation formula is also needed to
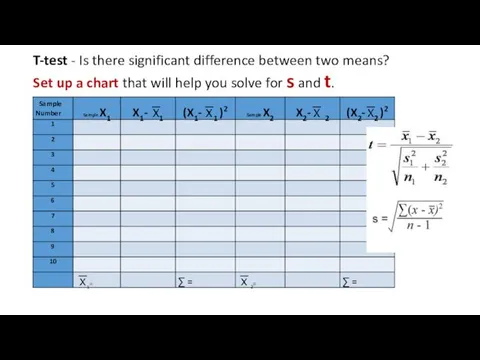
T-test - Is there significant difference between two means?
Set up
T-test - Is there significant difference between two means?
Set up
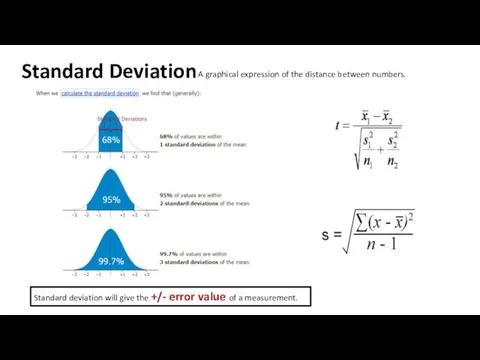
Standard Deviation
A graphical expression of the distance between numbers.
Standard deviation
Standard Deviation
A graphical expression of the distance between numbers.
Standard deviation
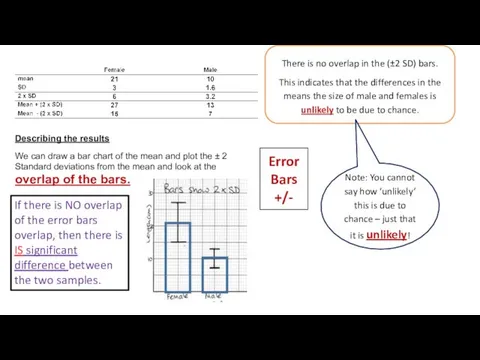
Describing the results
We can draw a bar chart of the mean
Describing the results
We can draw a bar chart of the mean
There is an overlap in the (±2 SD) bars.
This indicates that
There is an overlap in the (±2 SD) bars.
This indicates that
Alternative Hypothesis vs Null Hypothesis
Our calculated value of Chi-squared is
Alternative Hypothesis vs Null Hypothesis
Our calculated value of Chi-squared is
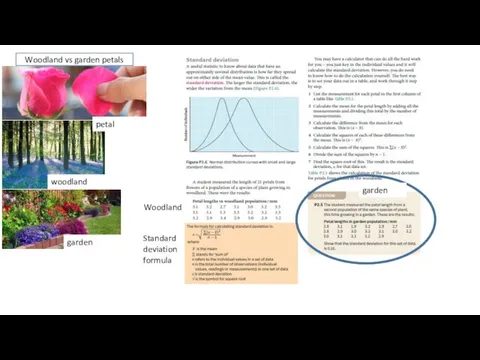
Woodland vs garden petals
woodland
garden
petal
Standard deviation formula
Woodland
garden
Woodland vs garden petals
woodland
garden
petal
Standard deviation formula
Woodland
garden
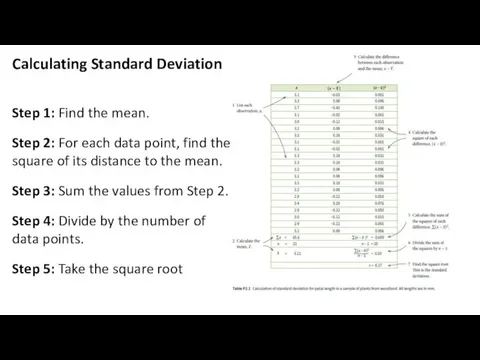
Calculating Standard Deviation
Step 1: Find the mean.
Step 2: For each data point, find
Calculating Standard Deviation
Step 1: Find the mean.
Step 2: For each data point, find
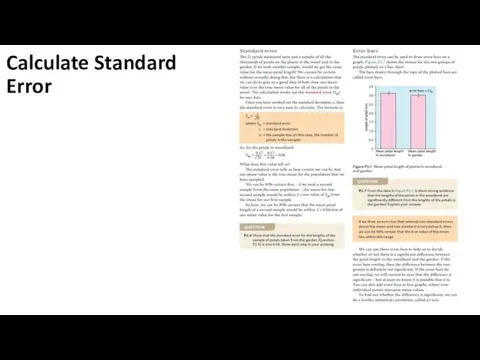
Calculate Standard Error
Calculate Standard Error
 Генетика: основные термины и понятия
 Хомяк джунгарский
 Промышленное культивирование микроорганизмов
 Фізіологія ендокринної системи
 ПРИСПОСОБИТЕЛЬНЫЕ ОСОБЕННОСТИ СТРОЕНИЯ,ОКРАСКИ ТЕЛА И ПОВЕДЕНИЯ ЖИВОТНЫХ.
 Meristem and cover tissues. Constant tissues: transport, mechanic
 Учение о тканях
 Плауны. Хвощи. Папоротники
 Тип хордовые. Подтип черепные. Класс земноводные (амфибии
 Биогенные элементы. Классификация. Топография биогенных элементов в организме человека
 Энергетический и пластический обмен
 Спинной мозг
 Мочеполовой аппарат
 Урок-игротека Животные
 Тұқымқуалаудың хромосомадан тыс факторлары: плазмидалар, транспозондар, isтіркестер. Бактериялар мен вирустардың генетикасы
 Посевные качества семян
 Обобщение по теме Царство Грибы
 Что нужно знать, чтобы вырастить различные виды растений?
 Задачи по генетике: дигибридное скрещивание
 Рефлексы
 Иммуноферментный анализ (ИФА). Иммуноблоттинг
 Половое размножение животных
 Белки. Переваривание и всасывание
 Основы цитологии. Понятие о клетке
 Общие свойства сенсорных систем. Болевая сенсорная система
 Игра Что? Где? Когда?
 Дидактическая игра Самые умные
 Большой год 2019 областной фотоконкурс