- IMPRS workshop Comparative Genomics

Содержание
- 2. What is positive selection?
- 3. Positive selection is selection on a particular trait - and the increased frequency of an allele
- 4. Woolhouse et al, 2002. Nat. Genet Directional selection Balancing selection Population level Positive selection can drive
- 5. Species A Diversifying positive selection Interspecific level Positive selection driving divergence
- 6. Why is it interesting to identify traits which have undergone or are under positive selection? Function
- 7. How can we detect positive selection?
- 8. Changes in a protein sequence….
- 9. Come from changes in the nucleotide sequence
- 10. Quantifying non-synonymous variation - an estimate of positive selection Synonymous mutations: neutral mutations Non-synonymous mutations: non-neutral
- 11. Rate of synonymous mutations Rate of non-synonymous mutations To measure positive selection:
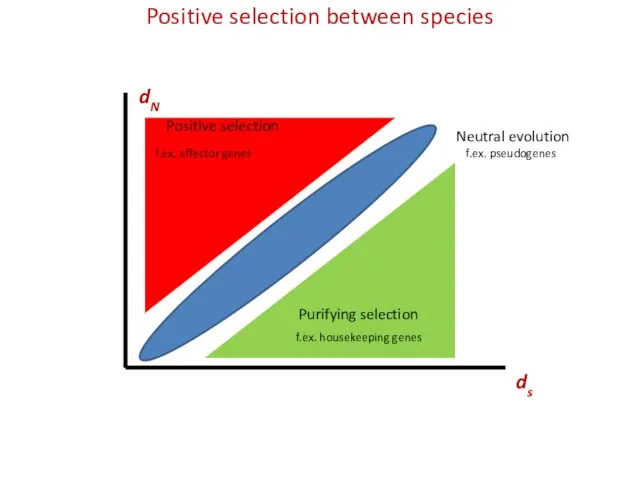
- 12. Positive selection between species Ks or dS Ka or dN
- 13. Positive selection in a population PS PN
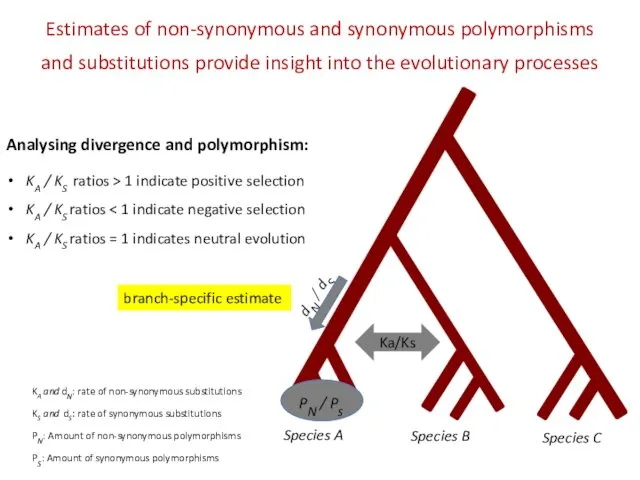
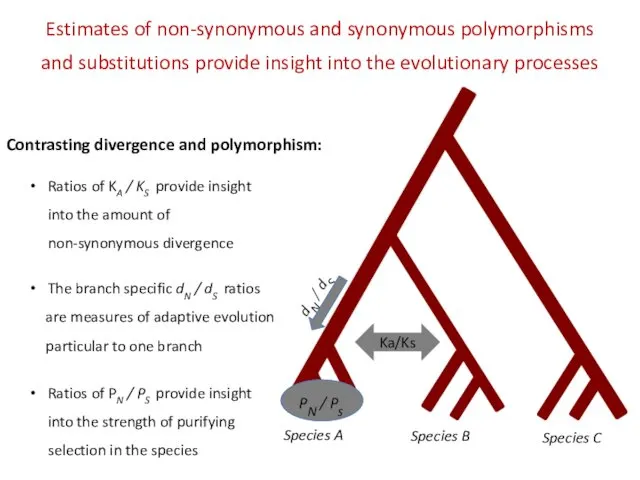
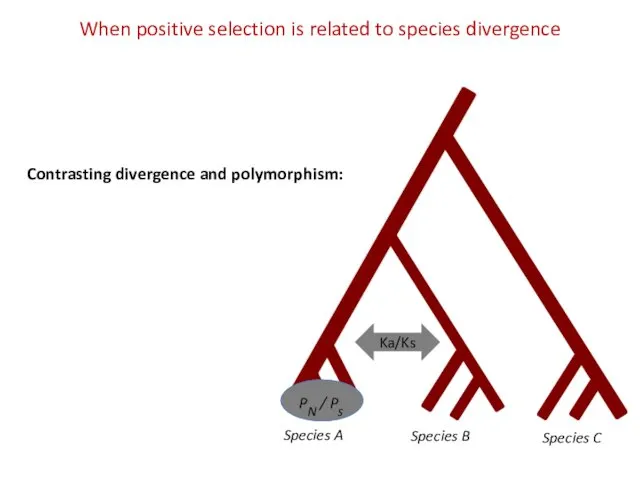
- 14. Species A Species B Species C PN / Ps Estimates of non-synonymous and synonymous polymorphisms and
- 15. Species A Species B Species C PN / Ps Estimates of non-synonymous and synonymous polymorphisms and
- 16. Nei and Gojobori, 1986 Counts of non-synonymous mutations for each gene (Nd) Counts of synonymous mutations
- 17. Calculate potential synonymous sites (S) for each codon A fourfold degenerate site counts as S =
- 18. Calculate Sd and Nd for each codon. 1. Sd = 0, Nd = 0 2. Sd
- 19. Positive selection between species ds dN
- 20. Species A Species B Species C PN / Ps When positive selection is related to species
- 21. McDonald Kreitman (MK) test to contrast within and between species variation
- 22. Repl: Nonsynonymous, Syn: Synonymous Fixed: Substitution, Poly: Polymorphisms Drosophila dataset alcohol dehydrogenase
- 23. MK test contrasts within and between species synonymous and non-synonymous differences Contingency table can be tested
- 24. Conclusion from MK-test: Adh locus in Drosophila has accumulated adaptive mutations (been under positive selection) when
- 25. One problem with the “counting methods” Sometimes the signal of selection is not very strong
- 27. Скачать презентацию
What is positive selection?
What is positive selection?
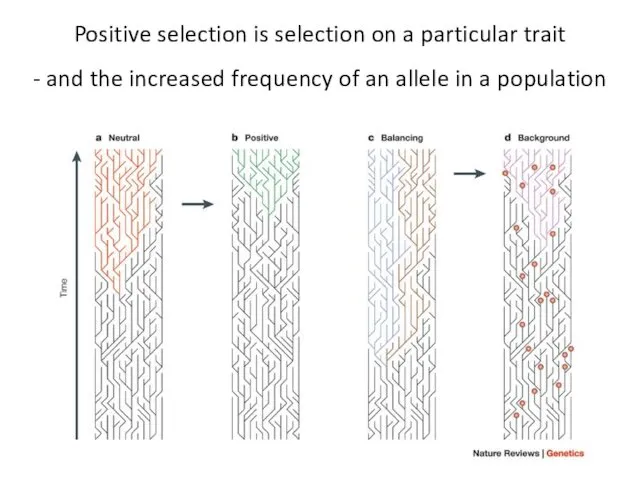
Positive selection is selection on a particular trait
- and the increased
Positive selection is selection on a particular trait
- and the increased
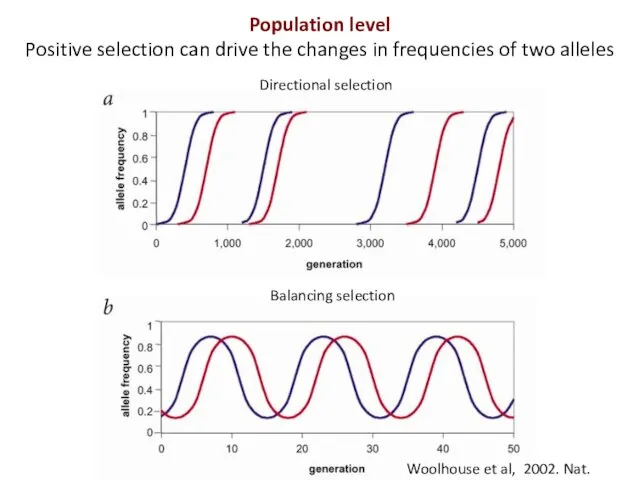
Woolhouse et al, 2002. Nat. Genet
Directional selection
Balancing selection
Population level
Positive selection can
Woolhouse et al, 2002. Nat. Genet
Directional selection
Balancing selection
Population level
Positive selection can
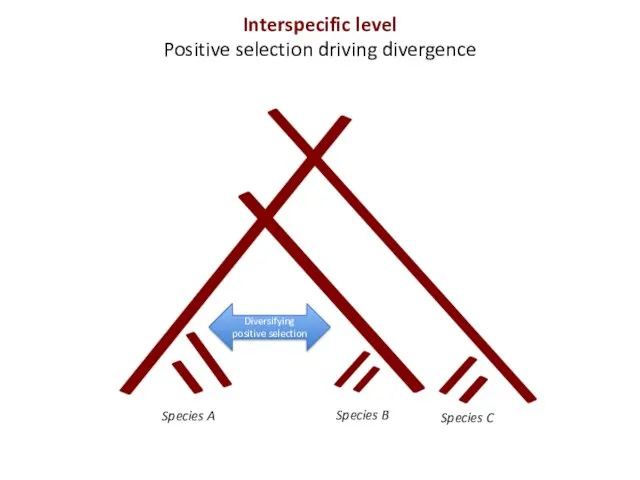
Species A
Diversifying positive selection
Interspecific level
Positive selection driving divergence
Species A
Diversifying positive selection
Interspecific level
Positive selection driving divergence
Why is it interesting to identify traits which
have undergone or
Why is it interesting to identify traits which
have undergone or

How can we detect positive selection?
How can we detect positive selection?
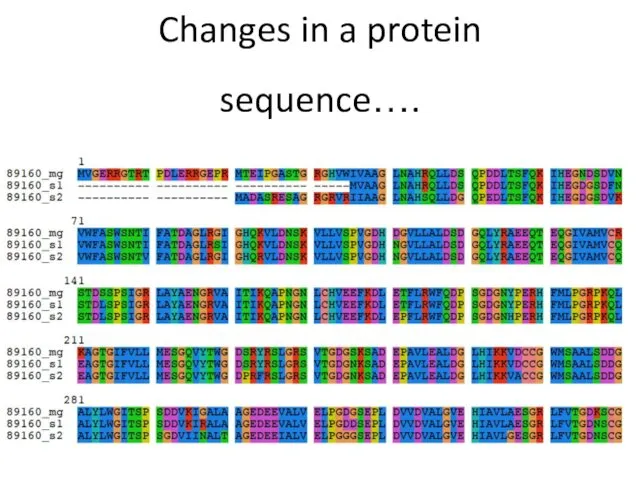
Changes in a protein sequence….
Changes in a protein sequence….
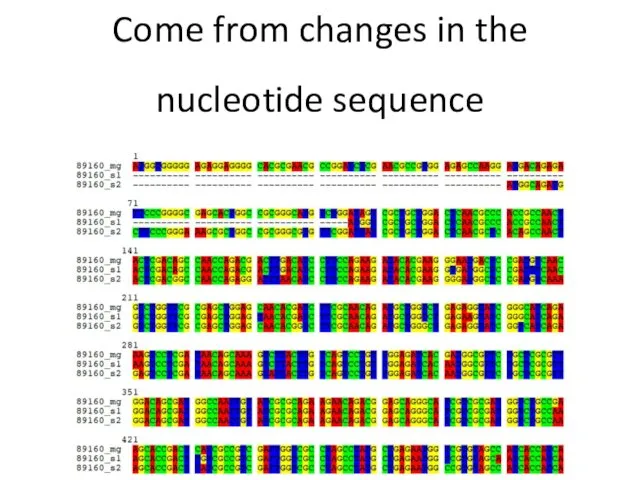
Come from changes in the
nucleotide sequence
Come from changes in the
nucleotide sequence
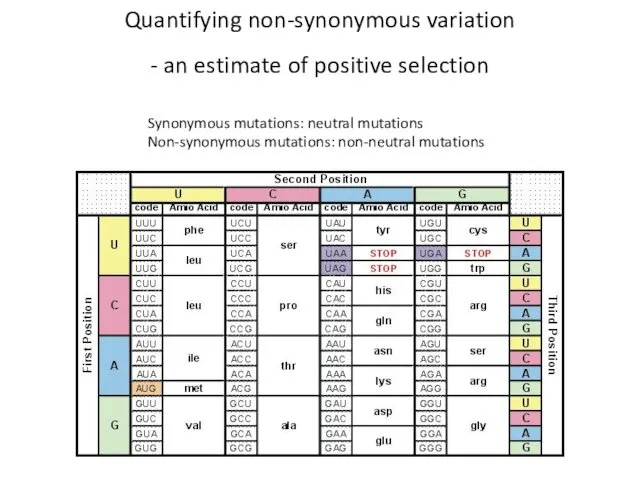
Quantifying non-synonymous variation
- an estimate of positive selection
Synonymous mutations: neutral mutations
Non-synonymous
Quantifying non-synonymous variation
- an estimate of positive selection
Synonymous mutations: neutral mutations
Non-synonymous
Rate of synonymous mutations
Rate of non-synonymous mutations
To measure positive selection:
Rate of synonymous mutations
Rate of non-synonymous mutations
To measure positive selection:
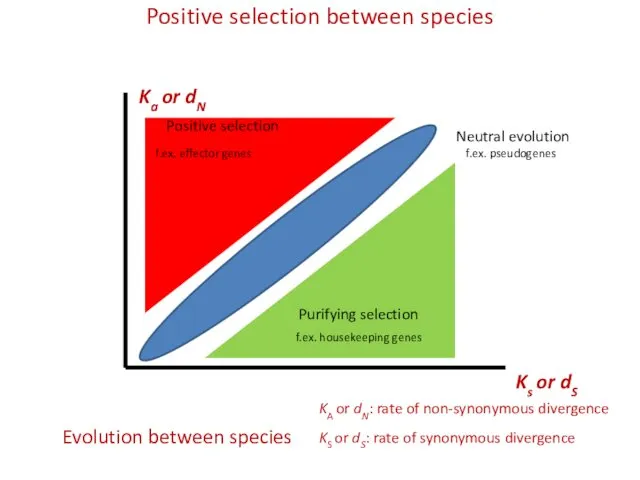
Positive selection between species
Ks or dS
Ka or dN
Positive selection between species
Ks or dS
Ka or dN
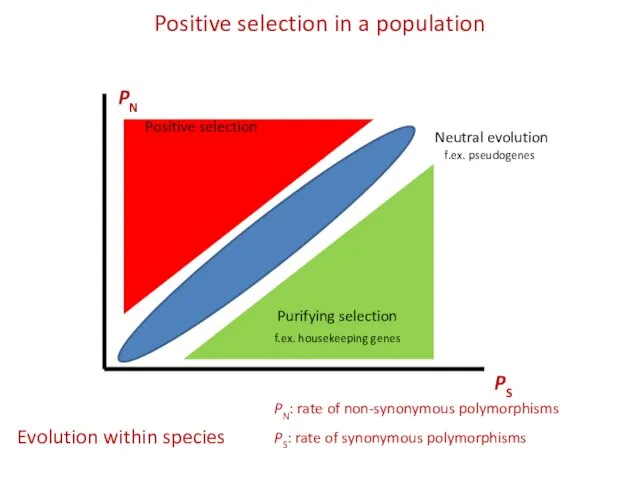
Positive selection in a population
PS
PN
Positive selection in a population
PS
PN
Species A
Species B
Species C
PN / Ps
Estimates of non-synonymous and synonymous polymorphisms
Species A
Species B
Species C
PN / Ps
Estimates of non-synonymous and synonymous polymorphisms
Species A
Species B
Species C
PN / Ps
Estimates of non-synonymous and synonymous polymorphisms
Species A
Species B
Species C
PN / Ps
Estimates of non-synonymous and synonymous polymorphisms
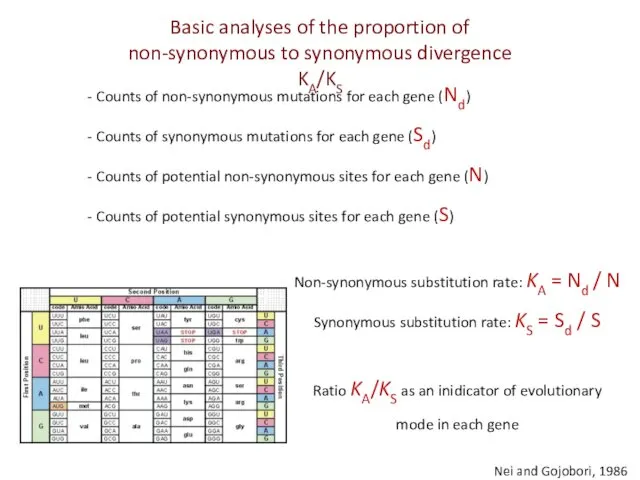
Nei and Gojobori, 1986
Counts of non-synonymous mutations for each gene
Nei and Gojobori, 1986
Counts of non-synonymous mutations for each gene
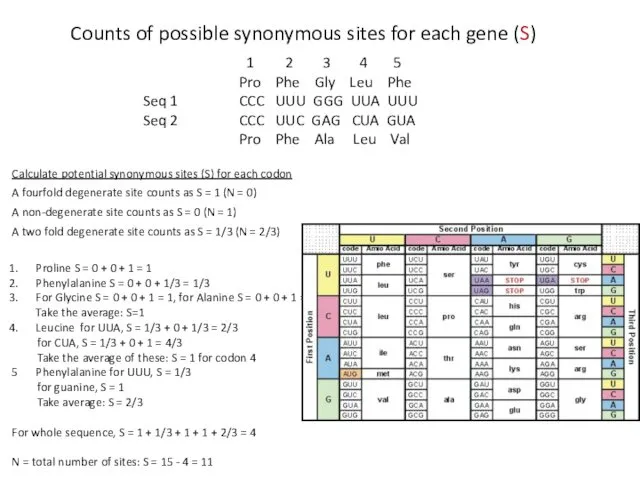
Calculate potential synonymous sites (S) for each codon
A fourfold degenerate
Calculate potential synonymous sites (S) for each codon
A fourfold degenerate
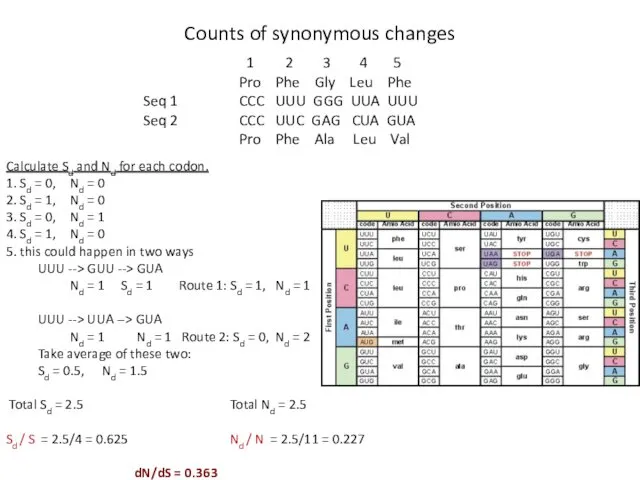
Calculate Sd and Nd for each codon.
1. Sd = 0, Nd
Calculate Sd and Nd for each codon.
1. Sd = 0, Nd
Positive selection between species
ds
dN
Positive selection between species
ds
dN
Species A
Species B
Species C
PN / Ps
When positive selection is related to
Species A
Species B
Species C
PN / Ps
When positive selection is related to
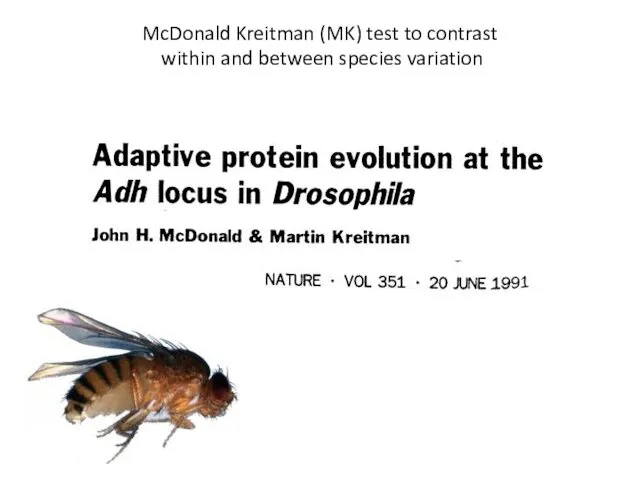
McDonald Kreitman (MK) test to contrast
within and between species variation
McDonald Kreitman (MK) test to contrast
within and between species variation
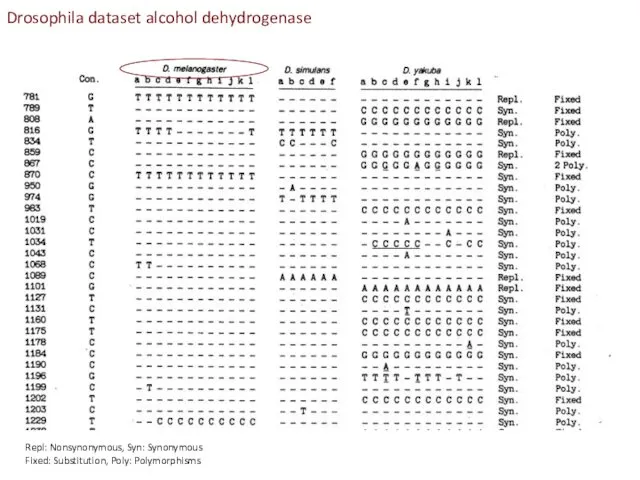
Repl: Nonsynonymous, Syn: Synonymous
Fixed: Substitution, Poly: Polymorphisms
Drosophila dataset alcohol dehydrogenase
Repl: Nonsynonymous, Syn: Synonymous
Fixed: Substitution, Poly: Polymorphisms
Drosophila dataset alcohol dehydrogenase
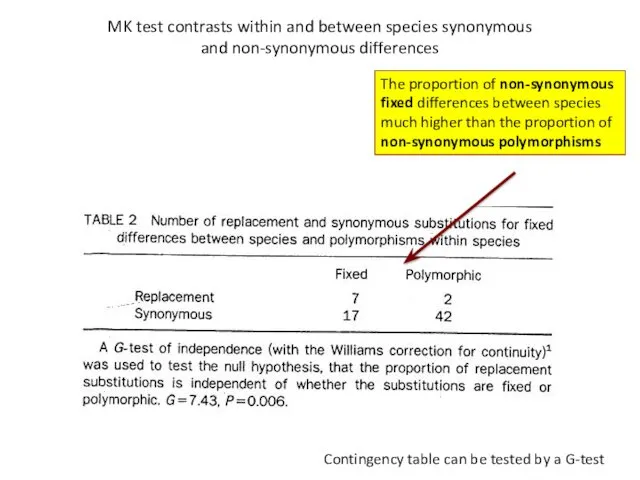
MK test contrasts within and between species synonymous
and non-synonymous differences
Contingency
MK test contrasts within and between species synonymous
and non-synonymous differences
Contingency
Conclusion from MK-test:
Adh locus in Drosophila has accumulated adaptive mutations (been
Conclusion from MK-test:
Adh locus in Drosophila has accumulated adaptive mutations (been
One problem with the “counting methods”
Sometimes the signal of selection is
Sometimes the signal of selection is
 Рысь
Рысь Центры происхождения культурных растений по Н.И. Вавилову
 Мой питомец. Способы общения с людьми
 Наследование групп крови человека
 Органы пищеварения
 Презентация теории восприятия
 Биология - наука о жизни
 презентация к педсовету по ФГОС2 Диск
 Анатомия глаза. Физиология. Методы исследования
 Эти загадочные динозавры
 Пряно-вкусовые растения. Специи
 Взаимодействие генов и их множественное действие
 Микробиологическая лаборатория. Техника безопасности в микробиологической лаборатории. Световой микроскоп
 Как распознать живое и неживое
 Посадка лука на перо
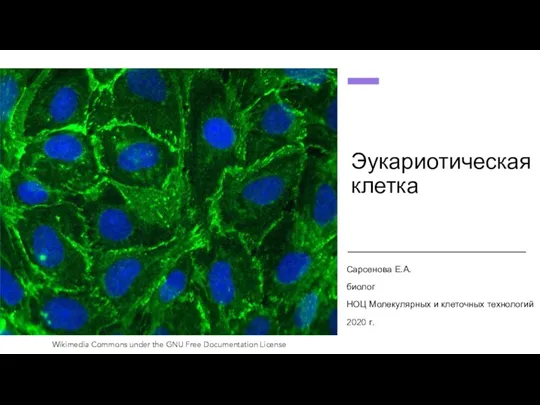 Эукариотическая клетка
 Макроеволюція
 Типы развития насекомых
 Корінь: основні функції (поглинання води та укріплення в ґрунті)
 Бактериялардың жіктелуі
 Презентация к внеклассному мероприятию Книга памятников природе
 Что такое хвоинки (для дошкольников)
 ПРЕЗЕНТАЦИЯ ДЛЯ ИНТЕРАКТИВНОЙ ДОСКИ. Пути и направления эволюции. 11 класс (В двух частях)
 Урок – игра по теме Органы и системы органов животных
 Северо-Осетинский государственный заповедник
 Мейоз. Механизм мейоза
 Презентация к обобщающему уроку в 5 классе по теме Грибы
 Квіти-первоцвіти