- Waterflood Design and Operational Best Practices

Содержание
- 2. Society of Petroleum Engineers Distinguished Lecturer Program www.spe.org/dl Scot Buell, SPEC Waterflood Design and Operational Best
- 3. Outline Waterflood design life and injection efficiency Conformance management Injection well design Waterflood surveillance Water quality
- 4. Waterflooding: The Gateway to Enhanced Oil Recovery 100% 80% 20% 40% 60% Oil Recovery Enhanced Oil
- 5. Waterflood Mobility Ratio Mwf = μo krw/μw kro Mwf > 1 is unfavorable – water is
- 6. What is the Design Life of Your Waterflood? Design Life affected by: Mobility ratio Pore volumes
- 7. Case History: Pore Volumes Injected for Four Offshore Reservoirs Processing rates (PVI/yr) very different among fields
- 8. How Efficiently Is Your Water Injection Displacing Oil? Technique is based upon net accumulated water in
- 9. Voidage Replacement Ratio (VRR) VRR is used as a leading indicator to achieve target reservoir pressure
- 10. Typical VRR Values After Fill-up VRR 1.1 to 1.4 VRR 1.0 to 1.1 VRR 1.0 to
- 11. Consistent VRR Importance of Voidage Replacement Ratio Management VRR Decrease Gas (mdf/day) & Oil (BOPD) Water
- 12. Zone 3 Zone 2 Zone 1 Water Displacement Front Oil Reservoir Classic Waterflood Conformance Problem in
- 13. Management of Layered Waterflood Response Always start with the injector if possible. Need surveillance and injector
- 14. Waterflood Analysis Techniques Identifying Injector-Producer Relationships Lorenz coefficient – Dykstra-Parsons Capacitance-resistance models (CRM) Streamtube or streamlines
- 15. Injector Completions for Conformance Control Limited Entry Perforating Dedicated Tubingless Slimhole Packers & Injection Mandrels with
- 16. Elements of a Waterflood Surveillance Plan Required Routine Surveillance : Production testing Injection measurement Water quality
- 17. Emerging Technology: Fiber Optic Distributed Acoustic Sensing (DAS) for Injection Flow Profiling Copyright owned by SPE
- 18. Cross-functional Waterflood Management Hierarchy of Analysis Waterflood Scorecards It takes more than just reservoir & production
- 19. Typical Water Quality Specifications Reference: NACE 5962 Eggum et al 2015, IJAETCS Abdulaziz 2014, & SPE
- 20. Offshore Water Injection Plant Scorecard Months with no Chlorination?
- 21. Biofouling: Consequences of Not Meeting Water Quality Specifications? What are Biofilms? They are collections of microorganisms
- 22. Under Deposit Corrosion: Consequences of Not Meeting Water Quality Specifications? A common corrosion mechanism in water
- 23. Oxygen: Consequences of Not Meeting Water Quality Specifications? Oxygen Corrosion Examples Bare carbon steel can provide
- 24. Water Injection Plant (WIP) Operations Are your water injection plant operations lower priority relative to oil
- 25. Operational Discipline with Water Quality Do you have a water quality specification or a water quality
- 26. Matrix Injection Myth in Waterfloods Long term matrix injection cannot be achieved with practical water quality
- 27. Subsurface Integrity Management for Waterfloods Subsurface integrity management ensures injected fluids are confined to targeted and
- 28. Key Takeaways Understand the design life and processing rate of your reservoir (PVI/year) Understand how much
- 30. Скачать презентацию

Society of Petroleum Engineers Distinguished Lecturer Program
www.spe.org/dl
Scot Buell, SPEC
Waterflood Design and
Society of Petroleum Engineers Distinguished Lecturer Program
www.spe.org/dl
Scot Buell, SPEC
Waterflood Design and
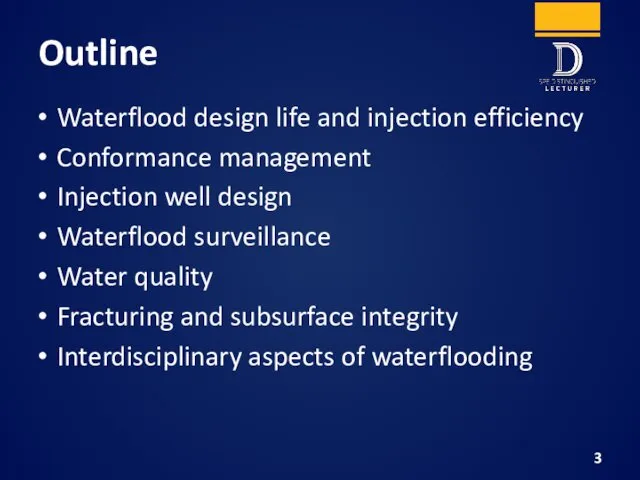
Outline
Waterflood design life and injection efficiency
Conformance management
Injection well design
Waterflood surveillance
Water quality
Fracturing
Outline
Waterflood design life and injection efficiency
Conformance management
Injection well design
Waterflood surveillance
Water quality
Fracturing
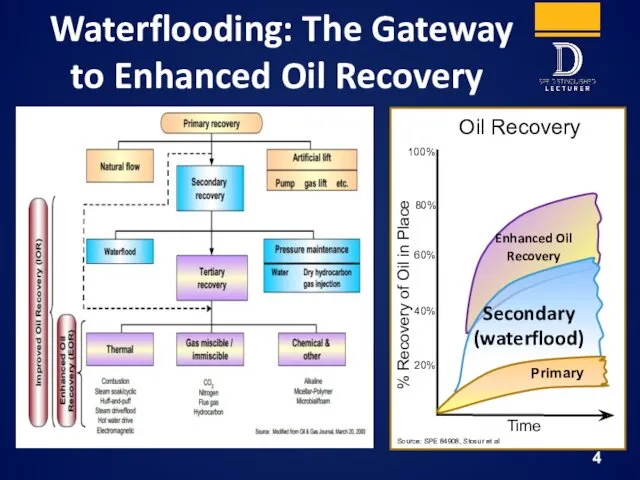
Waterflooding: The Gateway to Enhanced Oil Recovery
100%
80%
20%
40%
60%
Oil Recovery
Enhanced Oil Recovery
Secondary (waterflood)
Source:
Waterflooding: The Gateway to Enhanced Oil Recovery
100%
80%
20%
40%
60%
Oil Recovery
Enhanced Oil Recovery
Secondary (waterflood)
Source:
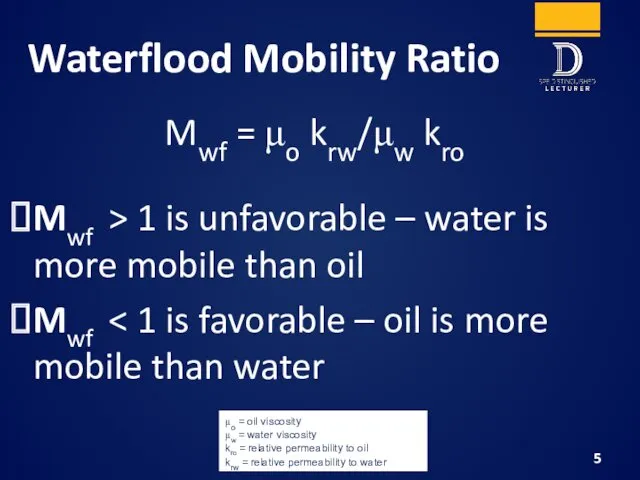
Waterflood Mobility Ratio
Mwf = μo krw/μw kro
Mwf > 1 is unfavorable
Waterflood Mobility Ratio
Mwf = μo krw/μw kro
Mwf > 1 is unfavorable
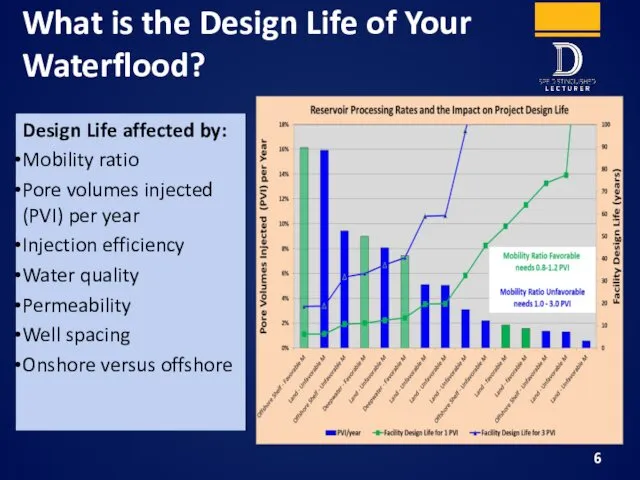
What is the Design Life of Your Waterflood?
Design Life affected by:
Mobility
What is the Design Life of Your Waterflood?
Design Life affected by:
Mobility
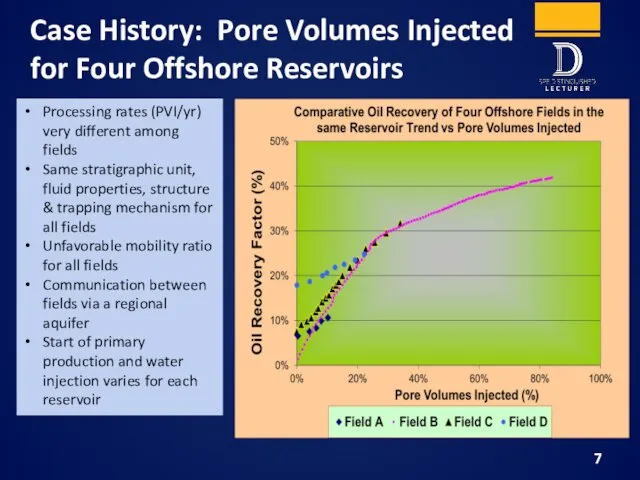
Case History: Pore Volumes Injected for Four Offshore Reservoirs
Processing rates (PVI/yr)
Case History: Pore Volumes Injected for Four Offshore Reservoirs
Processing rates (PVI/yr)
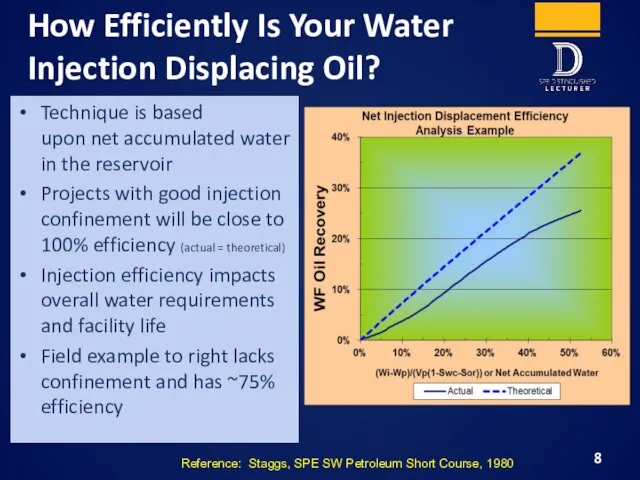
How Efficiently Is Your Water Injection Displacing Oil?
Technique is based
upon
How Efficiently Is Your Water Injection Displacing Oil?
Technique is based upon
Voidage Replacement Ratio (VRR)
VRR is used as a leading indicator to
Voidage Replacement Ratio (VRR)
VRR is used as a leading indicator to
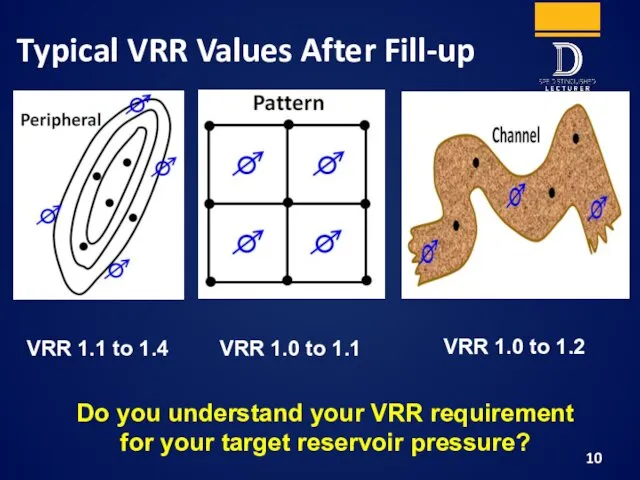
Typical VRR Values After Fill-up
VRR 1.1 to 1.4
VRR 1.0 to 1.1
VRR
Typical VRR Values After Fill-up
VRR 1.1 to 1.4
VRR 1.0 to 1.1
VRR
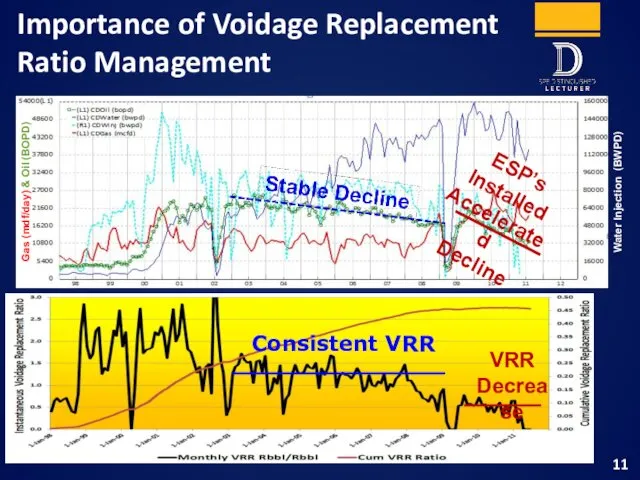
Consistent VRR
Importance of Voidage Replacement
Ratio Management
VRR
Decrease
Gas (mdf/day) & Oil (BOPD)
Water
Consistent VRR
Importance of Voidage Replacement
Ratio Management
VRR
Decrease
Gas (mdf/day) & Oil (BOPD)
Water
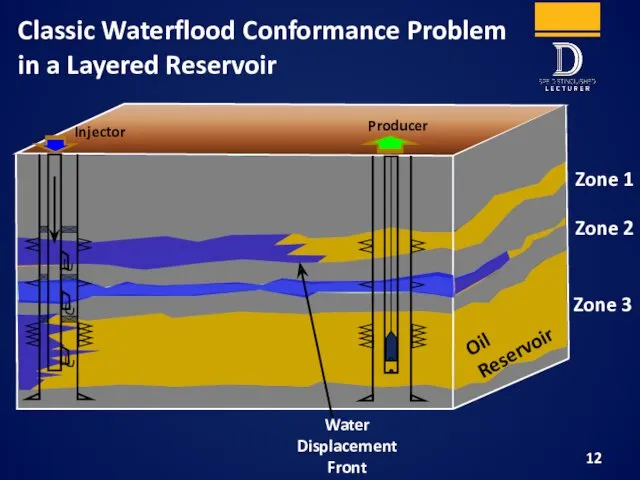
Zone 3
Zone 2
Zone 1
Water
Displacement
Front
Oil Reservoir
Classic Waterflood Conformance Problem
in a
Zone 3
Zone 2
Zone 1
Water
Displacement
Front
Oil Reservoir
Classic Waterflood Conformance Problem
in a
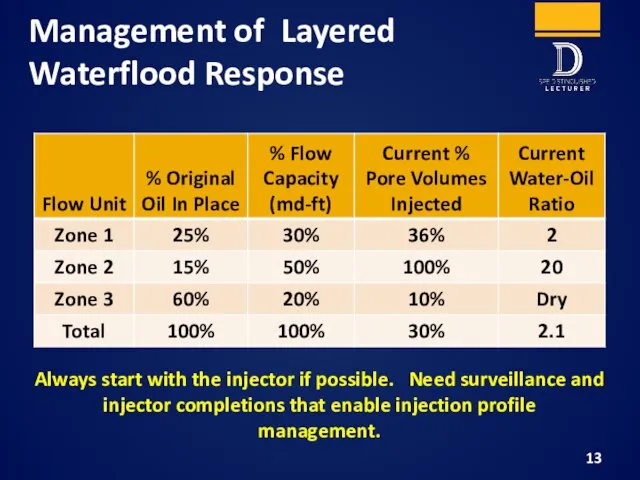
Management of Layered Waterflood Response
Always start with the injector if possible.
Management of Layered Waterflood Response
Always start with the injector if possible.
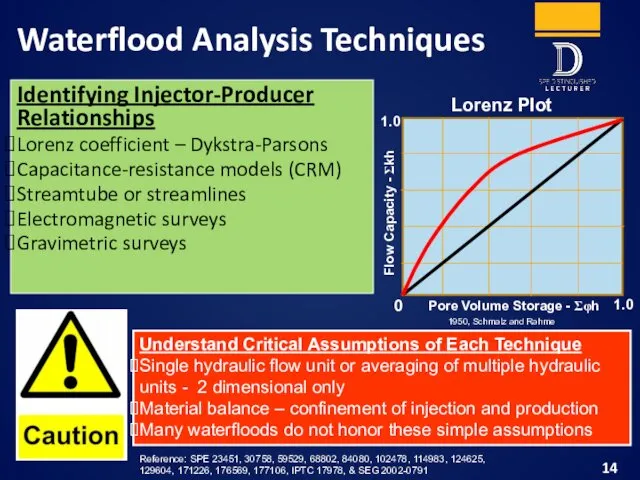
Waterflood Analysis Techniques
Identifying Injector-Producer Relationships
Lorenz coefficient – Dykstra-Parsons
Capacitance-resistance models (CRM)
Streamtube or
Waterflood Analysis Techniques
Identifying Injector-Producer Relationships
Lorenz coefficient – Dykstra-Parsons
Capacitance-resistance models (CRM)
Streamtube or
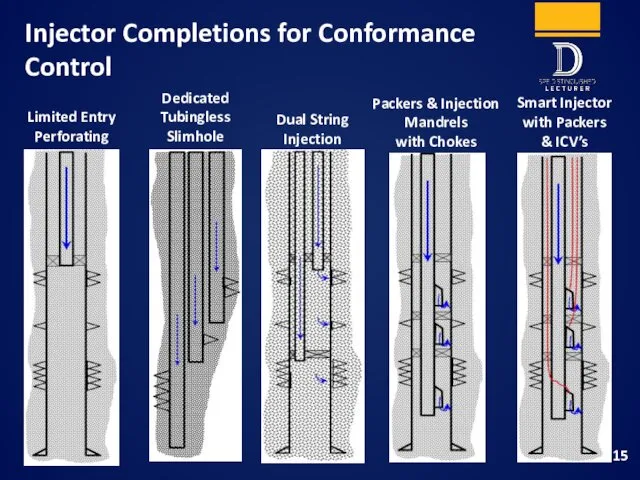
Injector Completions for Conformance Control
Limited Entry
Perforating
Dedicated
Tubingless
Slimhole
Packers & Injection
Injector Completions for Conformance Control
Limited Entry
Perforating
Dedicated
Tubingless
Slimhole
Packers & Injection
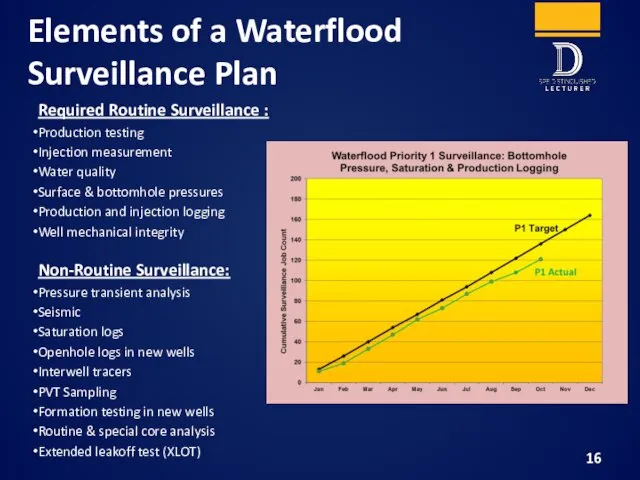
Elements of a Waterflood Surveillance Plan
Required Routine Surveillance :
Production testing
Injection measurement
Water
Elements of a Waterflood Surveillance Plan
Required Routine Surveillance :
Production testing
Injection measurement
Water
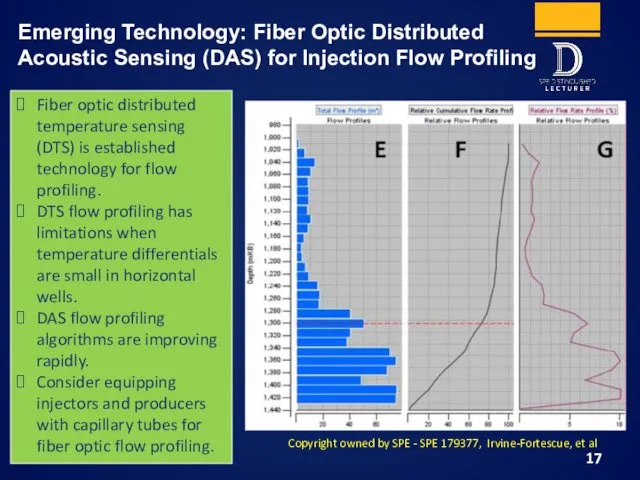
Emerging Technology: Fiber Optic Distributed
Acoustic Sensing (DAS) for Injection Flow
Emerging Technology: Fiber Optic Distributed
Acoustic Sensing (DAS) for Injection Flow
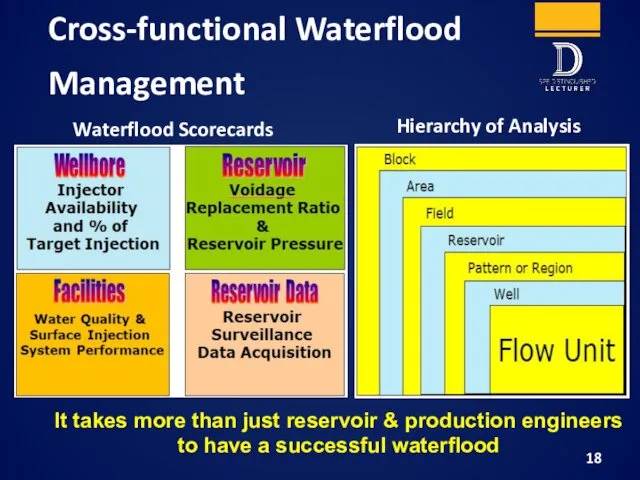
Cross-functional Waterflood Management
Hierarchy of Analysis
Waterflood Scorecards
It takes more than just
Cross-functional Waterflood Management
Hierarchy of Analysis
Waterflood Scorecards
It takes more than just
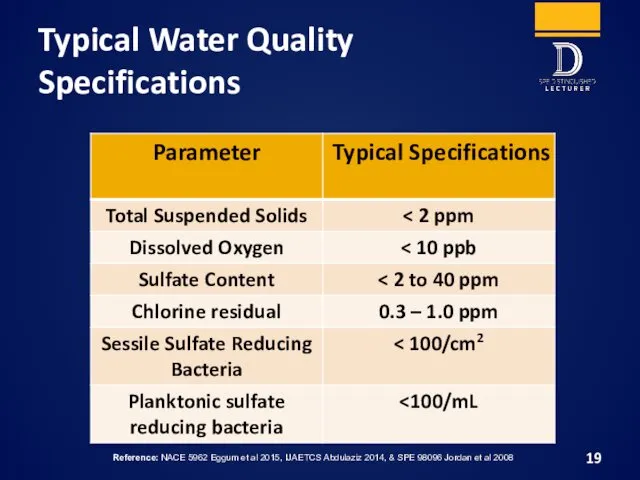
Typical Water Quality Specifications
Reference: NACE 5962 Eggum et al 2015, IJAETCS
Typical Water Quality Specifications
Reference: NACE 5962 Eggum et al 2015, IJAETCS
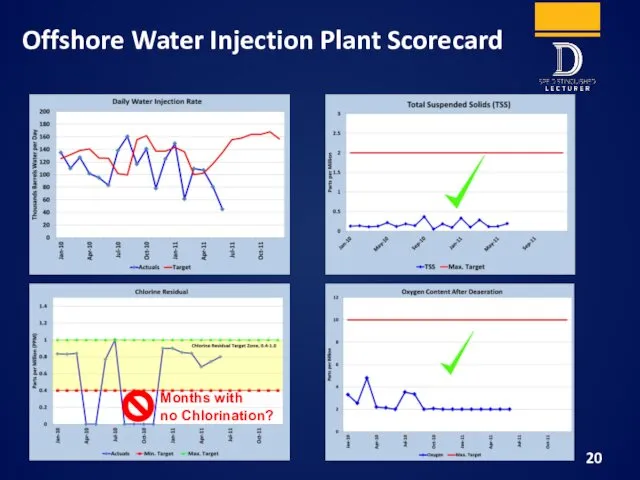
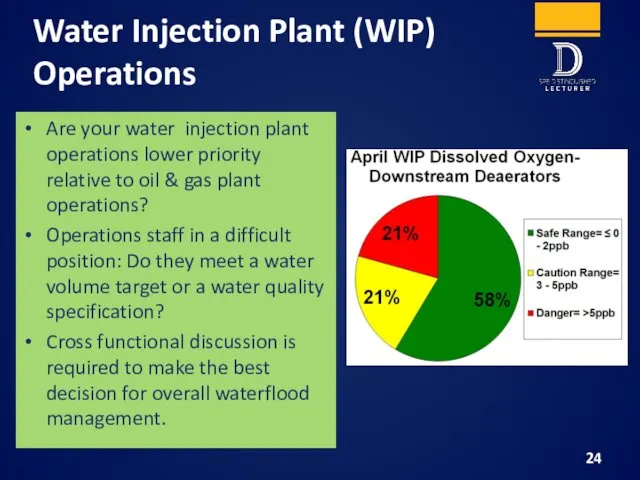
Offshore Water Injection Plant Scorecard
Months with
no Chlorination?
Offshore Water Injection Plant Scorecard
Months with
no Chlorination?
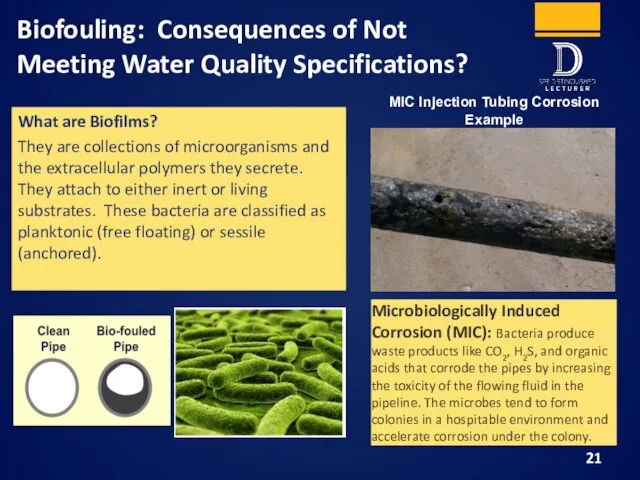
Biofouling: Consequences of Not Meeting Water Quality Specifications?
What are Biofilms?
They are
Biofouling: Consequences of Not Meeting Water Quality Specifications?
What are Biofilms?
They are
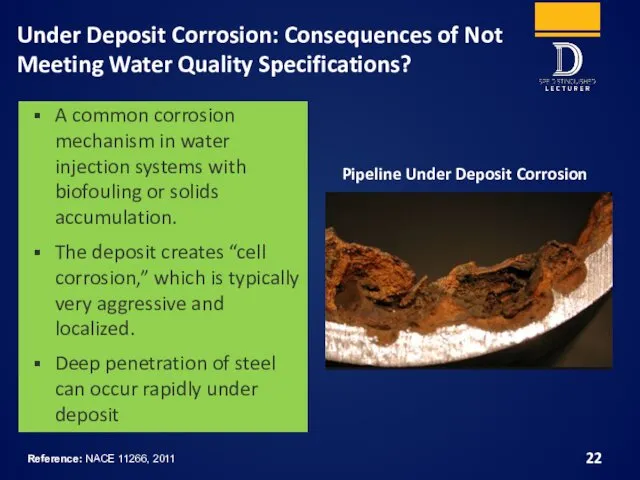
Under Deposit Corrosion: Consequences of Not Meeting Water Quality Specifications?
A common
Under Deposit Corrosion: Consequences of Not Meeting Water Quality Specifications?
A common
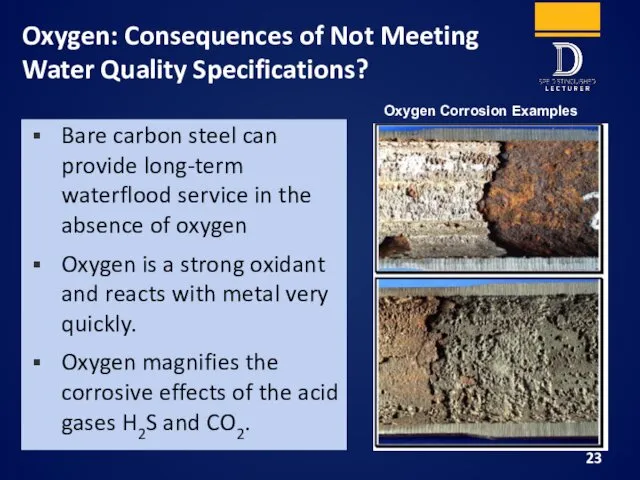
Oxygen: Consequences of Not Meeting Water Quality Specifications?
Oxygen Corrosion Examples
Bare carbon
Oxygen: Consequences of Not Meeting Water Quality Specifications?
Oxygen Corrosion Examples
Bare carbon
Water Injection Plant (WIP) Operations
Are your water injection plant operations lower
Water Injection Plant (WIP) Operations
Are your water injection plant operations lower
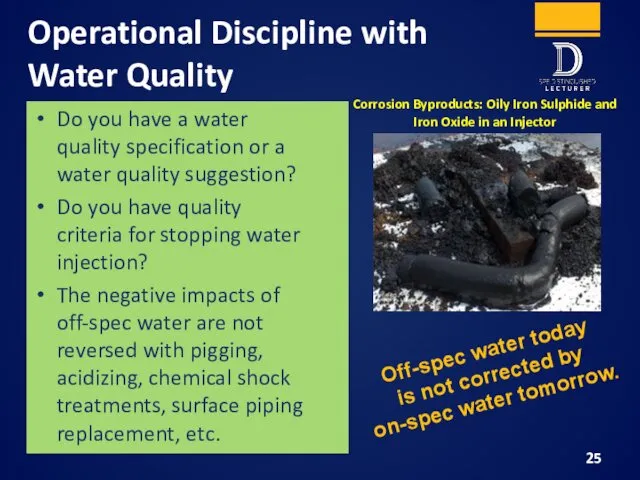
Operational Discipline with Water Quality
Do you have a water
quality specification
Operational Discipline with Water Quality
Do you have a water quality specification
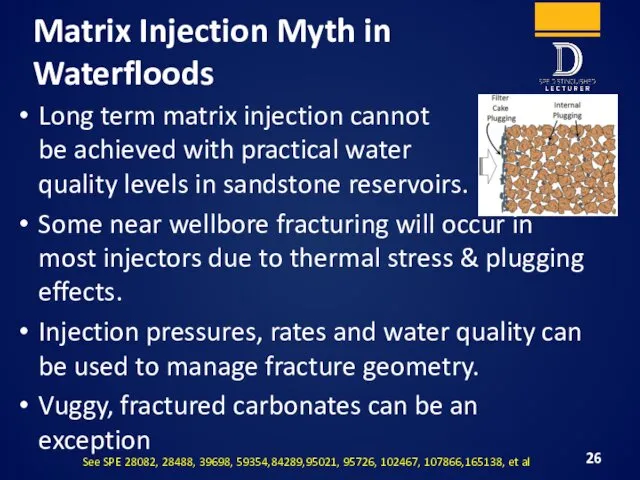
Matrix Injection Myth in Waterfloods
Long term matrix injection cannot
be achieved
Matrix Injection Myth in Waterfloods
Long term matrix injection cannot be achieved
Subsurface Integrity Management for Waterfloods
Subsurface integrity management ensures injected fluids are
Subsurface Integrity Management for Waterfloods
Subsurface integrity management ensures injected fluids are
Key Takeaways
Understand the design life and processing rate of your reservoir
Key Takeaways
Understand the design life and processing rate of your reservoir
 Елементи біофізики при вивченні електрики
 Молочнокислые бактерии
 Нарушения КОС организма
 Химический состав клетки
 Классификация животного мира. 7 класс
 Клетка. Структура клетки. Органоиды клетки
 Задачи и методы генетики. Подготовка к ЕГЭ
 Эволюция кровеносной системы животных
 Зрительный анализатор
 Antioxidants
 Популяция. Свойства популяций
 Вегетативная нервная система
 Зоология позвоночных. Разнообразие млекопитающих. (Лекция 11)
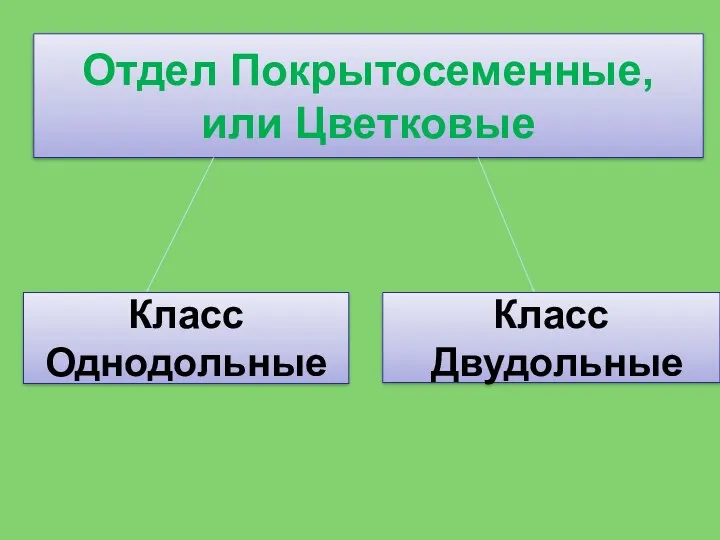 Отдел покрытосеменные, или цветковые. Класс однодольные. Класс двудольные
 Adaptation and natural selection
 Анализирующее скрещивание. Промежуточный характер наследования
 Биоэнергетика. Современное представление о биологическом окислении
 презентация к теме Эволюционное учение
 Вредители и болезни культурных растений
 Насекомые. Отличительные признаки насекомых (1 класса)
 Вода. Роль воды в жизни человека
 Самые ядовитые животные в мире
 Суточная активность попугаев
 Скелет человека. Осевой скелет. 8 класс
 Қан ферменттерін анықтаудың клиникалық маңызы
 Этимология названий лекарственных растений. Мифы и легенды
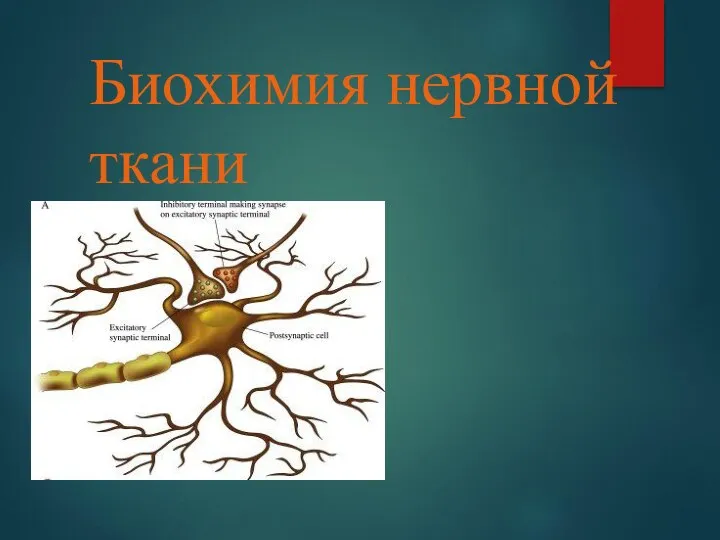 Биохимия нервной ткани
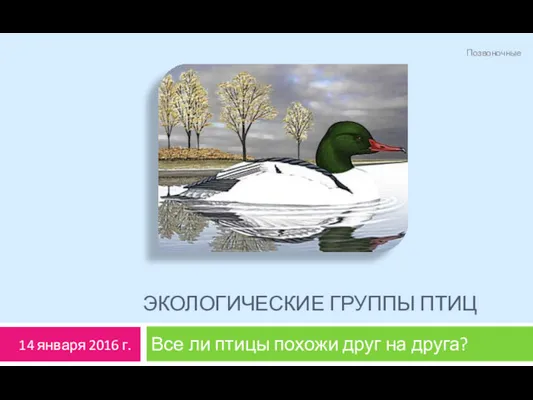 Экологические группы птиц