- Starbucks SEC 10K Company Timeline

Содержание
- 2. Company Timeline 1971 – The first Starbucks store was opened 1984 – Starbucks tests the coffeehouse
- 3. Consolidated Statements of Earnings Net Revenues : $22,386,600 Cost of Sales : $9,038,200 Gross Profit =
- 4. Consolidated Statements of Comprehensive Income The Accumulated Other Comprehensive net income/(loss) is ($155,600,000) for 2017. It
- 5. Consolidated Balance Sheets Total Current Assets : 2017 - $5,283,400 Total Liabilities : 2017 - $4,220,700
- 6. Consolidated Balance Sheets : Ratio Analysis Current Ratio = Current Assets / Current Liabilities $5,283,400/$4,220,700 =
- 7. Consolidated Balance Sheets : Ratio Analysis, cont. Inventory Turnover = Cost of Goods Sold / Average
- 8. Consolidated Statements of Cash Flows Analysis of Operating, Investing, and Financing Activities: 2017 2016 Net cash
- 9. Vertical Analysis: Statement of Earnings When looking at Starbucks's Statement of Earnings, we can see that
- 10. Vertical Analysis: Balance Sheets Accounts Receivables (c) accounts for 6% of the total assets. It takes
- 12. Скачать презентацию
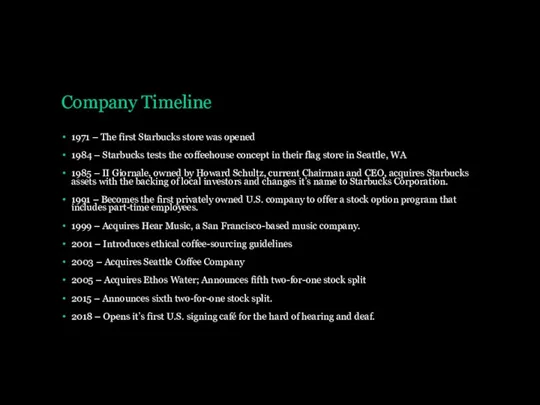
Company Timeline
1971 – The first Starbucks store was opened
1984 – Starbucks
Company Timeline
1971 – The first Starbucks store was opened
1984 – Starbucks
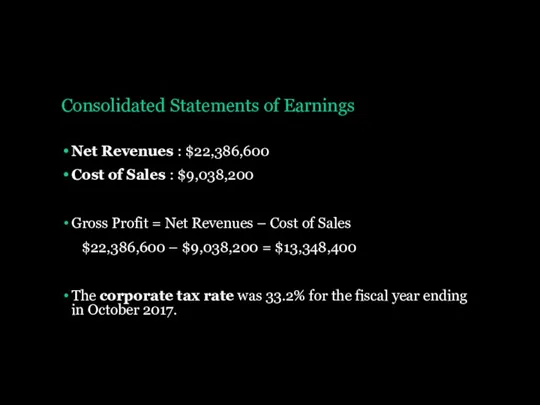
Consolidated Statements of Earnings
Net Revenues : $22,386,600
Cost of Sales : $9,038,200
Gross
Consolidated Statements of Earnings
Net Revenues : $22,386,600
Cost of Sales : $9,038,200
Gross
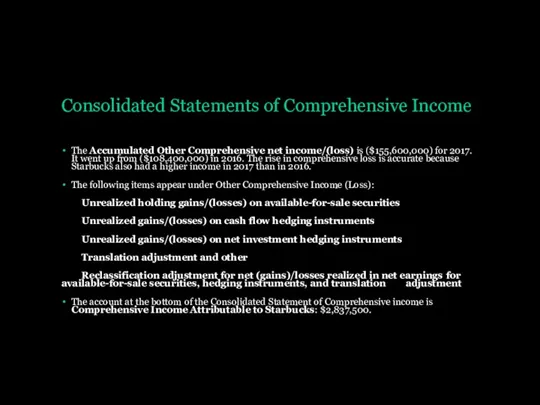
Consolidated Statements of Comprehensive Income
The Accumulated Other Comprehensive net income/(loss) is
Consolidated Statements of Comprehensive Income
The Accumulated Other Comprehensive net income/(loss) is
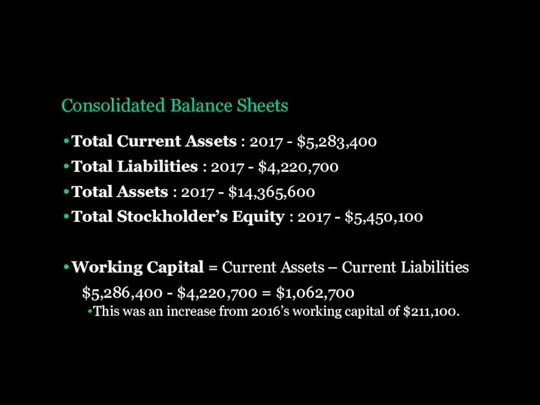
Consolidated Balance Sheets
Total Current Assets : 2017 - $5,283,400
Total Liabilities :
Consolidated Balance Sheets
Total Current Assets : 2017 - $5,283,400
Total Liabilities :
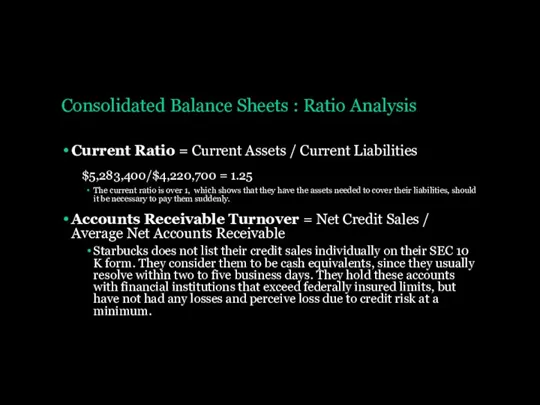
Consolidated Balance Sheets : Ratio Analysis
Current Ratio = Current Assets /
Consolidated Balance Sheets : Ratio Analysis
Current Ratio = Current Assets /
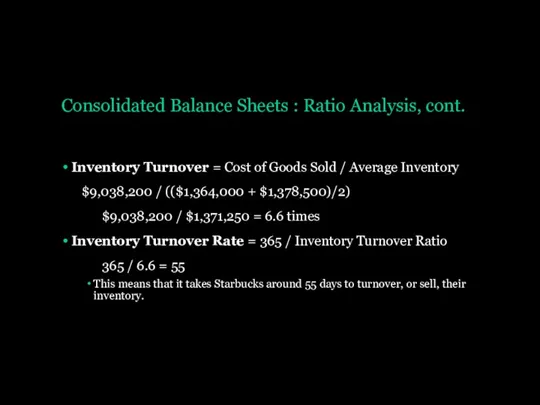
Consolidated Balance Sheets : Ratio Analysis, cont.
Inventory Turnover = Cost of
Consolidated Balance Sheets : Ratio Analysis, cont.
Inventory Turnover = Cost of
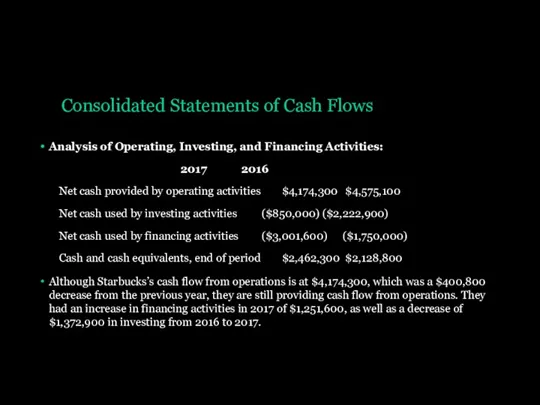
Consolidated Statements of Cash Flows
Analysis of Operating, Investing, and Financing Activities:
2017 2016
Net
Consolidated Statements of Cash Flows
Analysis of Operating, Investing, and Financing Activities:
2017 2016
Net
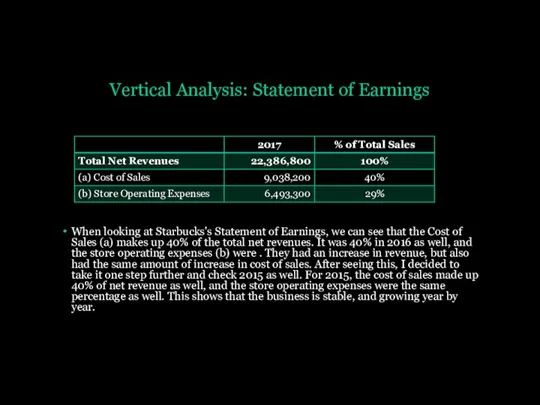
Vertical Analysis: Statement of Earnings
When looking at Starbucks's Statement of Earnings,
Vertical Analysis: Statement of Earnings
When looking at Starbucks's Statement of Earnings,
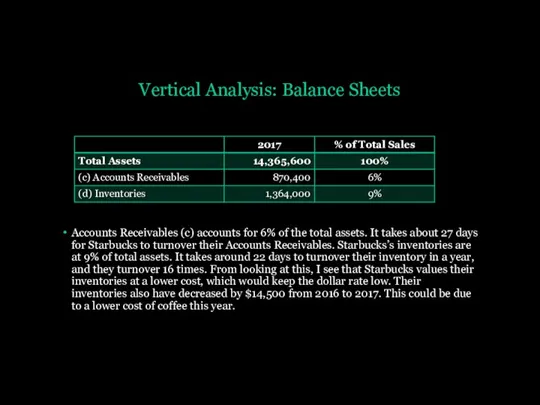
Vertical Analysis: Balance Sheets
Accounts Receivables (c) accounts for 6% of the
Vertical Analysis: Balance Sheets
Accounts Receivables (c) accounts for 6% of the
Похожие презентации
 Резюме бизнес-идеи
 Понятие и источники предпринимательского права. (Тема 1)
 Образовательный проект Лови волну
 Виды и формы бизнеса
 Бизнес-план. Спортивно-развлекательный отдых
 Анализ международной деятельности компании Apple
 Проект. Строительство установки вдувания пылеугольного топлива в доменные печи
 Салон красоты City Style
 Кәсіпкерлік қызмет субъектілерінің жауапкершілігі. (Тақырып 9)
 Продвижение туристических услуг
 Предпринимательская деятельность в туризме
 Мастер-класс. Как найти первых клиентов
 Роль транспортного обслуживания в индустрии. Лекция 2
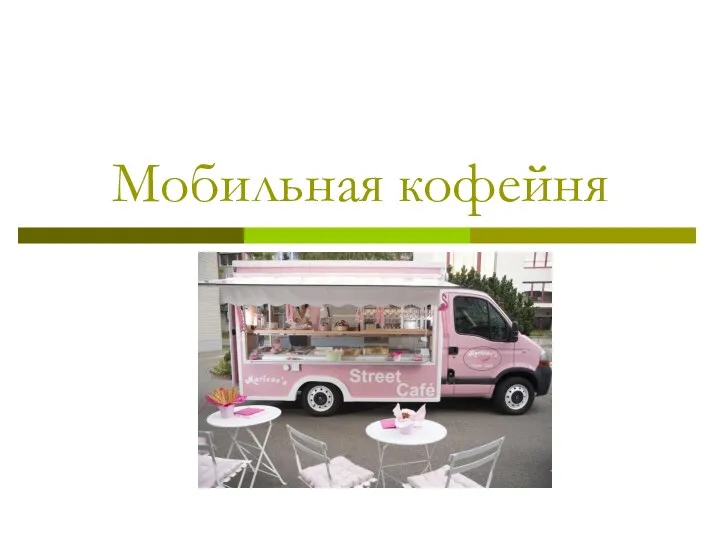 Мобильная кофейня
 Компания Giggle. Проект START UP
 LLC RUBIN-15
 Создание и развитие индустриальных парков
 Бизнес-планирование
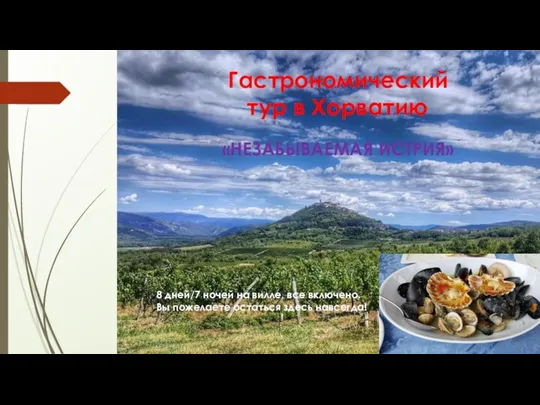 Гастрономический тур в Хорватию
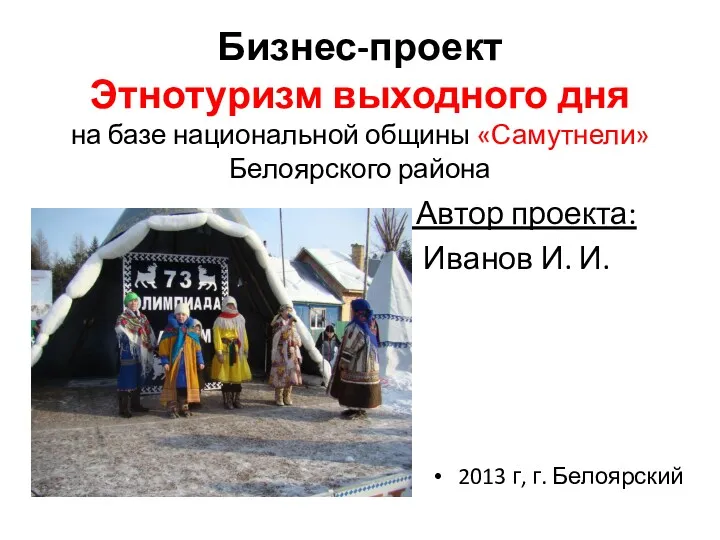 Бизнес-проект Этнотуризм выходного дня на базе национальной общины Самутнели Белоярского района
 Кафе Сладкая фантазия
 Структура бизнес-плана
 Бизнес – идея
 Создание образа продуктивной модели бизнеса
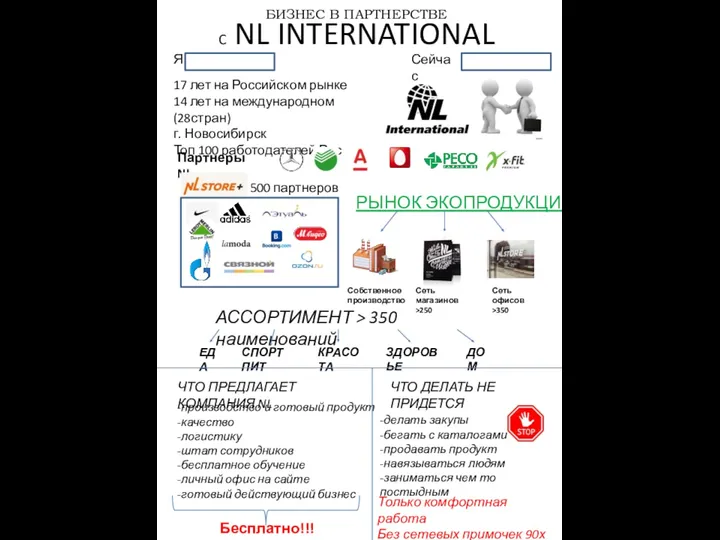 Бизнес в партнерстве
 Бизнес-идея
 ESG strategy for А101