- Global Warming 20 Years Later: Tipping Points Near

Содержание
- 2. 1988 Testimony: Conclusions 1. Earth is warmer in 1988 than at any time in the history
- 5. Basis of Testimony 1988 1. Basic Physics, Planetary & Paleo Studies 2. Observed On-Going Climate Change
- 6. Major Flaws in 1988 Testimony Did Not Emphasize Warming vs Chaos - Weather Variations >> Climate
- 8. Global Warming Status 1. Knowledge Gap Between - What is Understood (science) - What is Known
- 10. Metrics for “Dangerous” Change Extermination of Animal & Plant Species 1. Extinction of Polar and Alpine
- 11. Target CO2: To preserve creation, the planet on which civilization developed
- 12. Tipping Point Definitions 1. Tipping Level - Climate forcing (greenhouse gas amount) reaches a point such
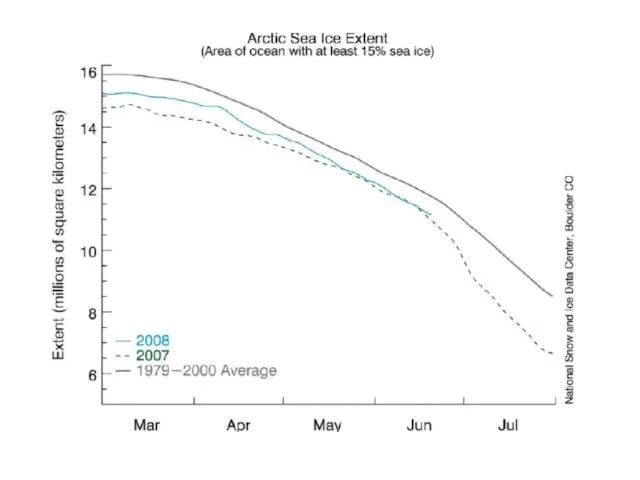
- 13. 1978 1982 1986 1990 1994 1998 2002 2006 2007 Extent (million sq km) 9 8 7
- 15. Observations: Domingues, C.M. et al., Nature 453, 1090-1093, 2008. Model: Hansen, J. et al., Science 308,
- 16. Arctic Sea Ice Criterion* 1. Restore Planetary Energy Balance ? CO2: 385 ppm ? 325-355 ppm
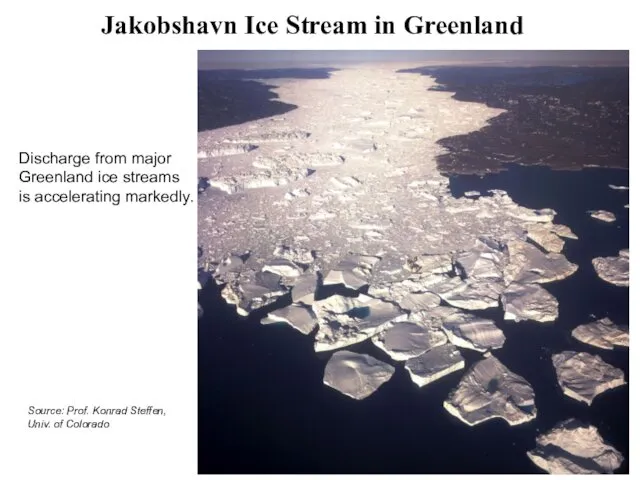
- 17. Konrad Steffen and Russell Huff, CIRES, University of Colorado at Boulder Greenland Total Melt Area –
- 18. Surface Melt on Greenland
- 20. Greenland Mass Loss – From Gravity Satellite
- 22. Sea Level Criterion* 1. Prior Interglacial Periods ? CO2 2. Cenozoic Era ? CO2 3. Ice
- 23. Pier on Lake Mead.
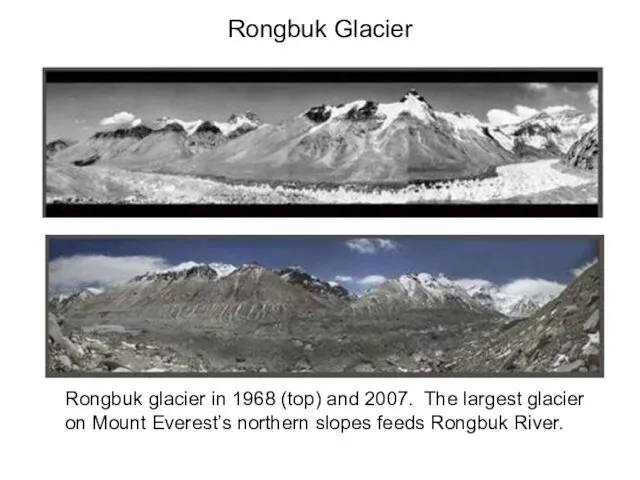
- 24. Rongbuk Glacier Rongbuk glacier in 1968 (top) and 2007. The largest glacier on Mount Everest’s northern
- 26. Coral Reef off Fiji (Photo: Kevin Roland) Stresses on Coral Reefs
- 27. Assessment of Target CO2 Phenomenon Target CO2 (ppm) 1. Arctic Sea Ice 300-325 2. Ice Sheets/Sea
- 28. The fraction of CO2 remaining in the air, after emission by fossil fuel burning, declines rapidly
- 30. Initial Target CO2: 350 ppm Technically Feasible (but not if business-as-usual continues) Quick Coal Phase-Out Critical
- 31. “Free Will” Alternative 1. Phase Out Coal CO2 Emissions - by 2025/2030 developed/developing countries 2. Rising
- 32. Carbon Tax & 100% Dividend 1. Tax Large & Growing (but get it in place!) -
- 33. Key Elements in Transformation Low-Loss Electric Grid Clean Energy by 2020 (West) & 2030 Allows Renewable
- 34. Basic Conflict Fossil Fuel Special Interests vs Young People & Nature (Animals) Fossil Interests: God-given fact
- 35. What are the Odds? Fossil Interests: have influence in capitals world-wide Young People: need to organize,
- 36. The Challenge We can avoid destroying creation! (+cleaner planet, + good jobs!) We have to figure
- 37. Web Site www.columbia.edu/~jeh1 includes Global Warming Twenty Years Later: Tipping Points Near (today’s statement) Target Atmospheric
- 38. Earth’s history provides most important information on global warming. Recorded human history occurs within the Holocene
- 40. Cenozoic Era 65 Million Years Ago Present Day Global Climate Forcings External (solar irradiance): +1 W/m2
- 42. Summary: Cenozoic Era 1. Dominant Forcing: Natural ΔCO2 - Rate ~100 ppm/My (0.0001 ppm/year) - Human-made
- 45. Скачать презентацию
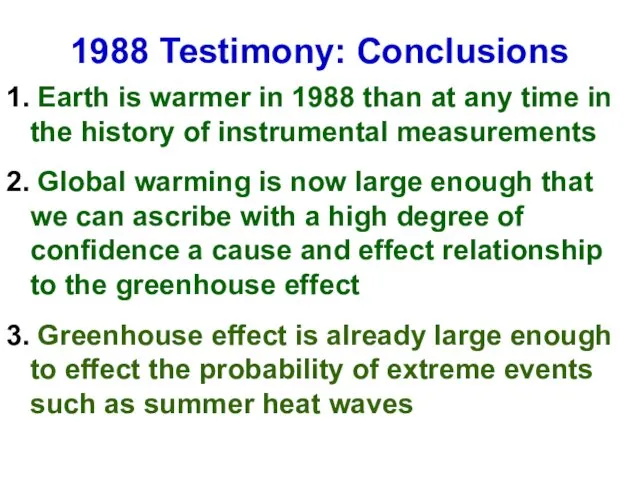
1988 Testimony: Conclusions
1. Earth is warmer in 1988 than at any
1988 Testimony: Conclusions
1. Earth is warmer in 1988 than at any
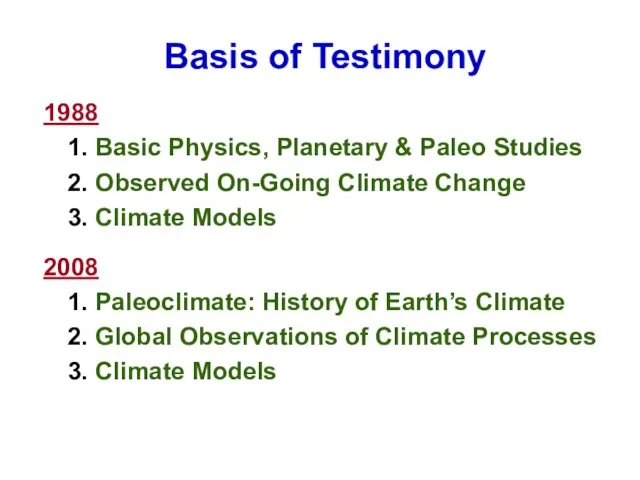
Basis of Testimony
1988
1. Basic Physics, Planetary & Paleo Studies
2. Observed On-Going
Basis of Testimony
1988
1. Basic Physics, Planetary & Paleo Studies
2. Observed On-Going
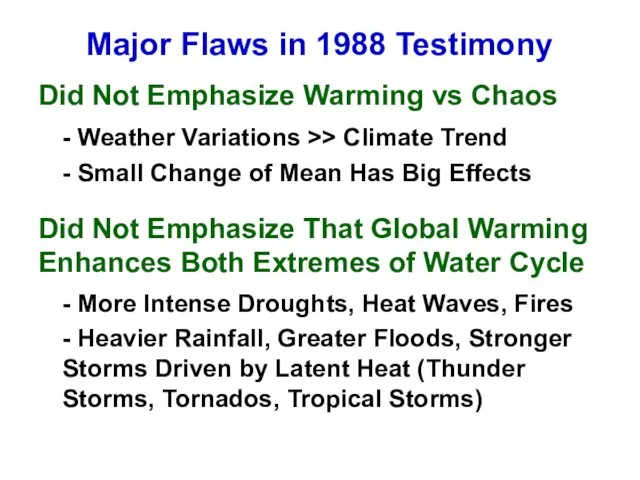
Major Flaws in 1988 Testimony
Did Not Emphasize Warming vs Chaos
- Weather
Major Flaws in 1988 Testimony
Did Not Emphasize Warming vs Chaos
- Weather
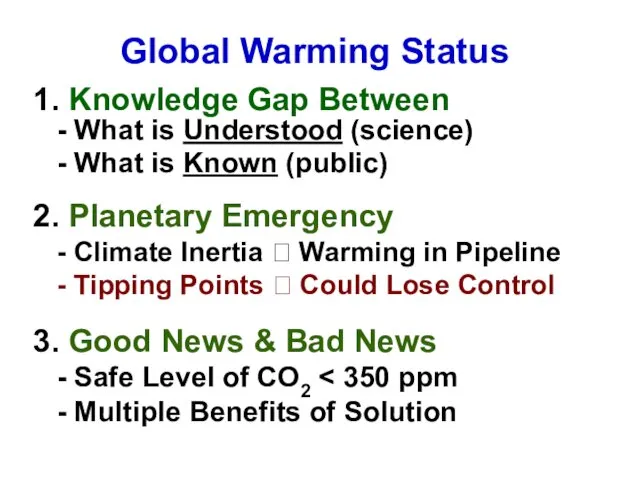
Global Warming Status
1. Knowledge Gap Between
- What is Understood (science)
- What
Global Warming Status
1. Knowledge Gap Between
- What is Understood (science)
- What
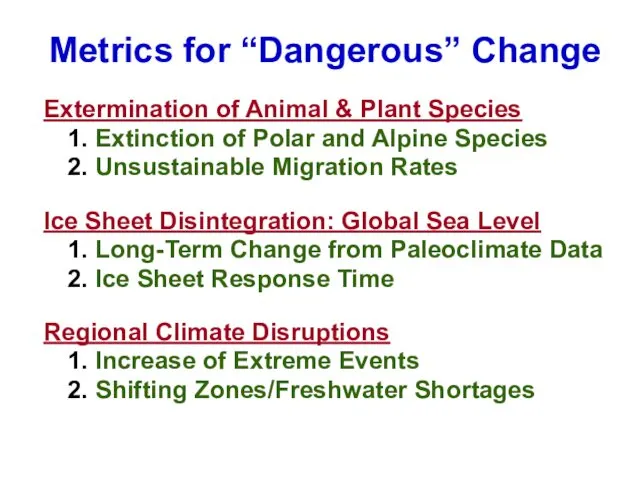
Metrics for “Dangerous” Change
Extermination of Animal & Plant Species
1. Extinction of
Metrics for “Dangerous” Change
Extermination of Animal & Plant Species
1. Extinction of
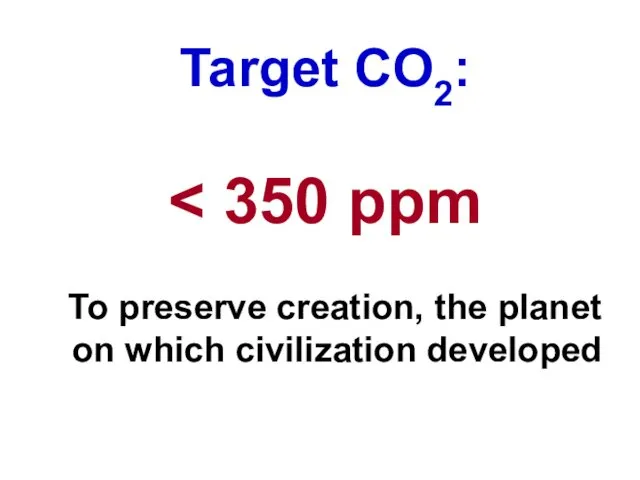
Target CO2:
< 350 ppm
To preserve creation, the planet on which
Target CO2:
< 350 ppm
To preserve creation, the planet on which
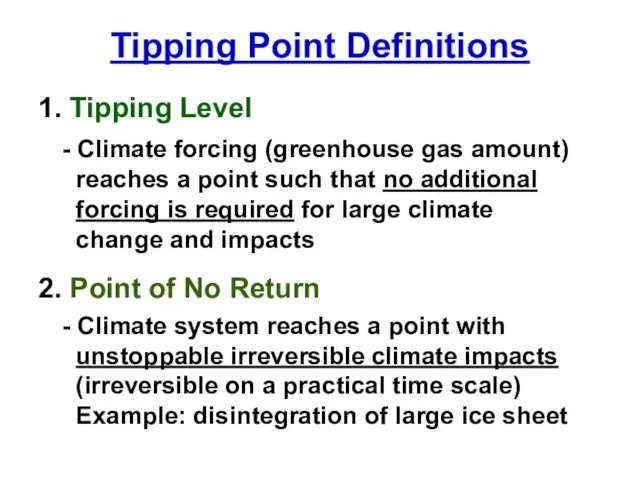
Tipping Point Definitions
1. Tipping Level
- Climate forcing (greenhouse gas amount)
reaches
Tipping Point Definitions
1. Tipping Level
- Climate forcing (greenhouse gas amount)
reaches
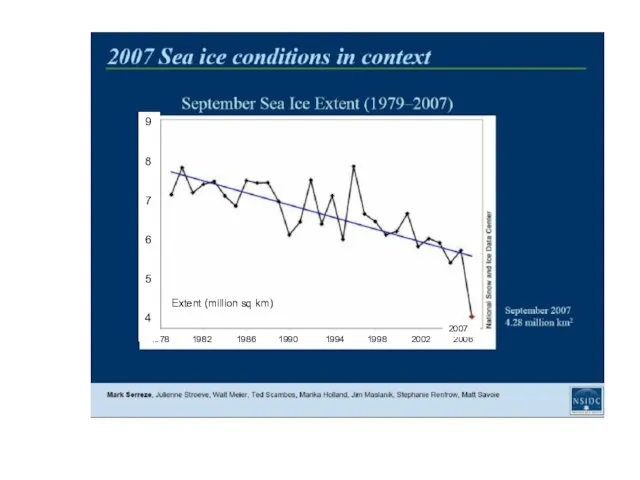
1978 1982 1986 1990 1994 1998 2002 2006
2007
Extent (million sq km)
9
8
7
6
5
4
1978 1982 1986 1990 1994 1998 2002 2006
2007
Extent (million sq km)
9
8
7
6
5
4
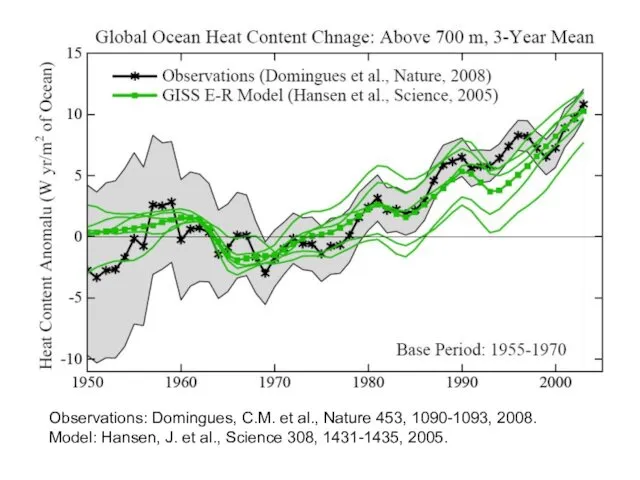
Observations: Domingues, C.M. et al., Nature 453, 1090-1093, 2008.
Model: Hansen, J.
Observations: Domingues, C.M. et al., Nature 453, 1090-1093, 2008.
Model: Hansen, J.
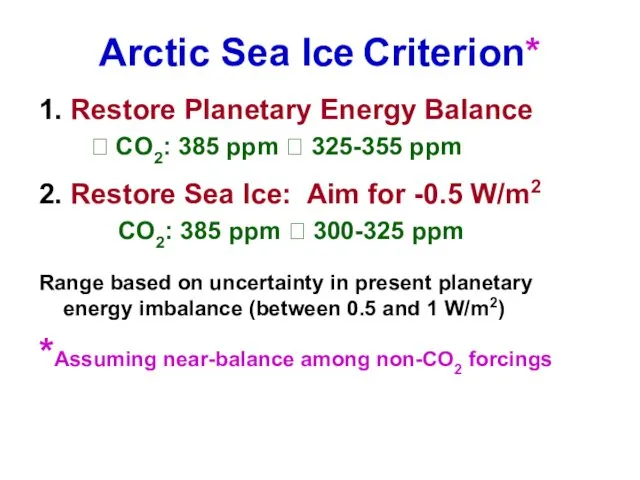
Arctic Sea Ice Criterion*
1. Restore Planetary Energy Balance
? CO2: 385
Arctic Sea Ice Criterion*
1. Restore Planetary Energy Balance
? CO2: 385
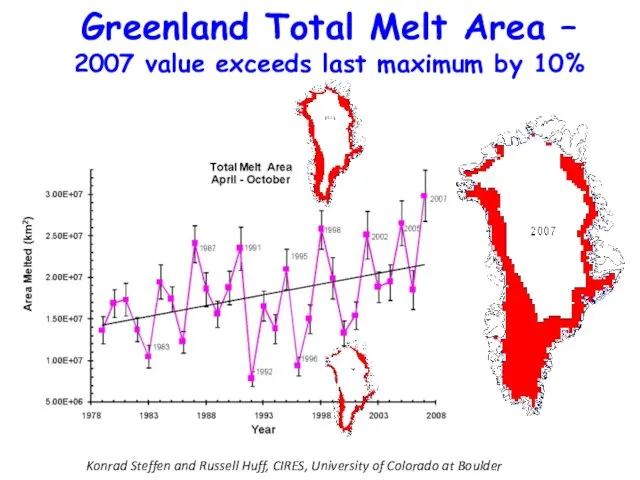
Konrad Steffen and Russell Huff, CIRES, University of Colorado at Boulder
Greenland
Konrad Steffen and Russell Huff, CIRES, University of Colorado at Boulder
Greenland
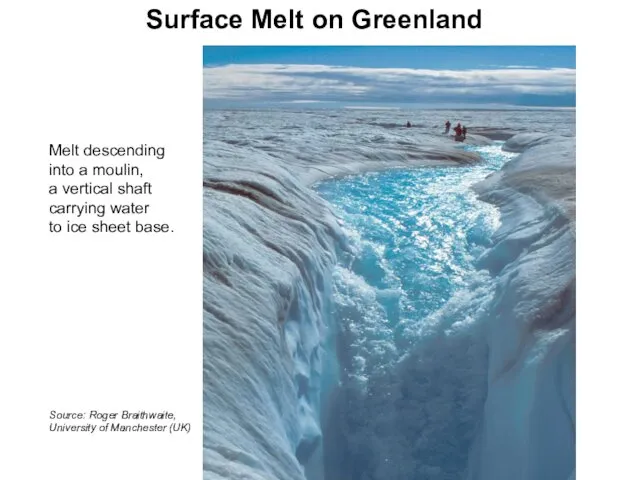
Surface Melt on Greenland
Surface Melt on Greenland
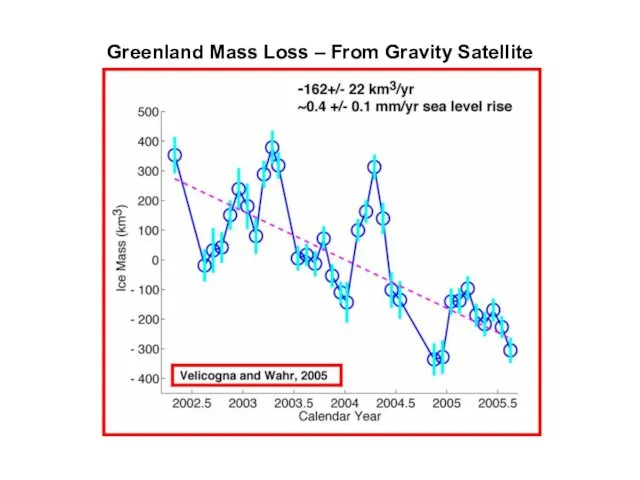
Greenland Mass Loss – From Gravity Satellite
Greenland Mass Loss – From Gravity Satellite

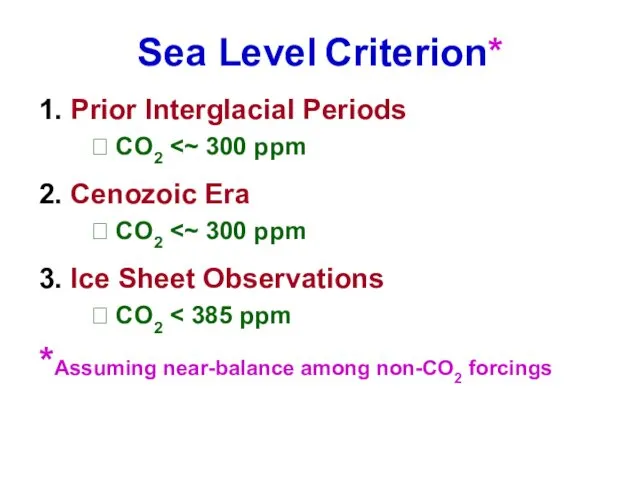
Sea Level Criterion*
1. Prior Interglacial Periods
? CO2 <~ 300 ppm
2.
Sea Level Criterion*
1. Prior Interglacial Periods
? CO2 <~ 300 ppm
2.

Pier on Lake Mead.
Pier on Lake Mead.
Rongbuk Glacier
Rongbuk glacier in 1968 (top) and 2007. The largest glacier
Rongbuk Glacier
Rongbuk glacier in 1968 (top) and 2007. The largest glacier
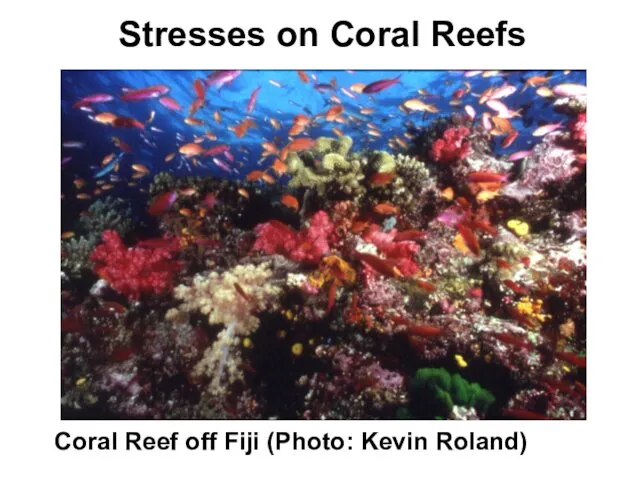
Coral Reef off Fiji (Photo: Kevin Roland)
Stresses on Coral Reefs
Coral Reef off Fiji (Photo: Kevin Roland)
Stresses on Coral Reefs
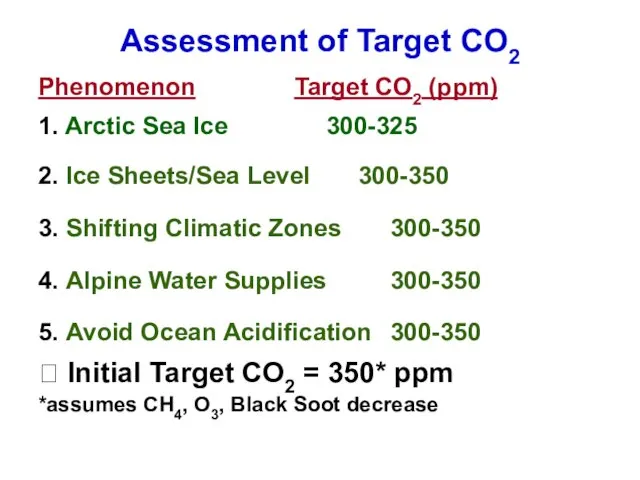
Assessment of Target CO2
Phenomenon Target CO2 (ppm)
1. Arctic Sea Ice 300-325
2. Ice
Assessment of Target CO2
Phenomenon Target CO2 (ppm)
1. Arctic Sea Ice 300-325
2. Ice
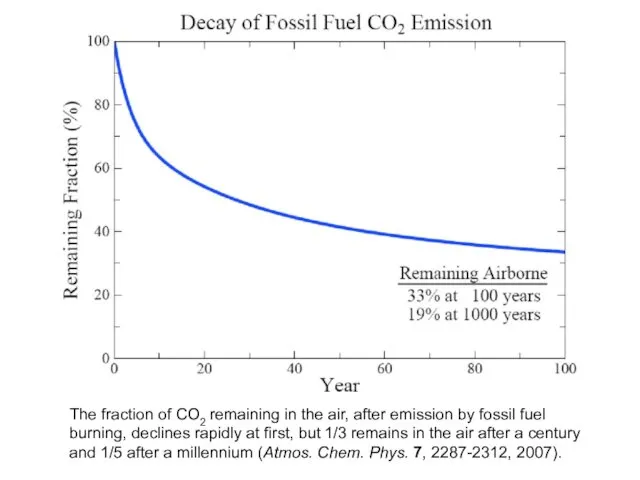
The fraction of CO2 remaining in the air, after emission by
The fraction of CO2 remaining in the air, after emission by
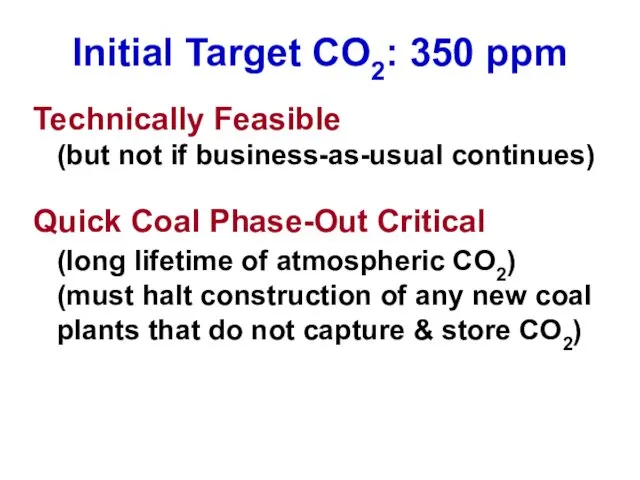
Initial Target CO2: 350 ppm
Technically Feasible
(but not if business-as-usual continues)
Quick
Initial Target CO2: 350 ppm
Technically Feasible
(but not if business-as-usual continues)
Quick
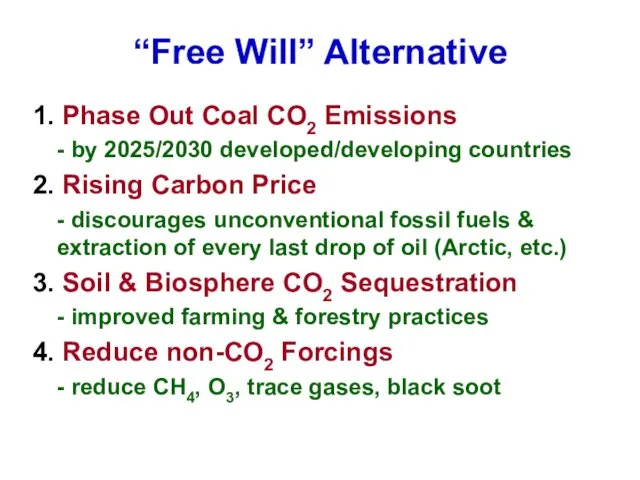
“Free Will” Alternative
1. Phase Out Coal CO2 Emissions
- by 2025/2030 developed/developing
“Free Will” Alternative
1. Phase Out Coal CO2 Emissions
- by 2025/2030 developed/developing
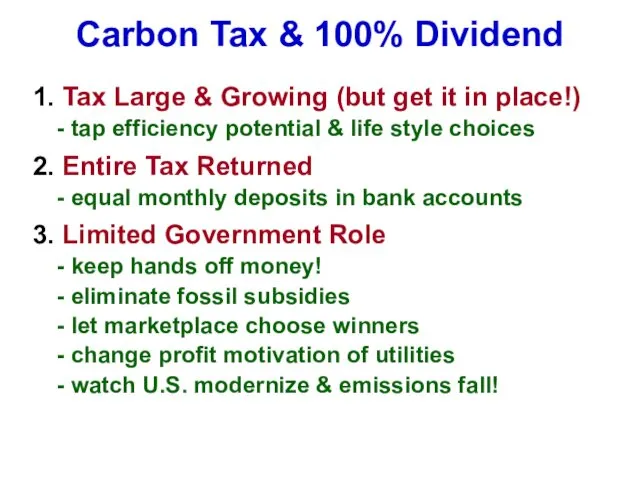
Carbon Tax & 100% Dividend
1. Tax Large & Growing (but get
Carbon Tax & 100% Dividend
1. Tax Large & Growing (but get
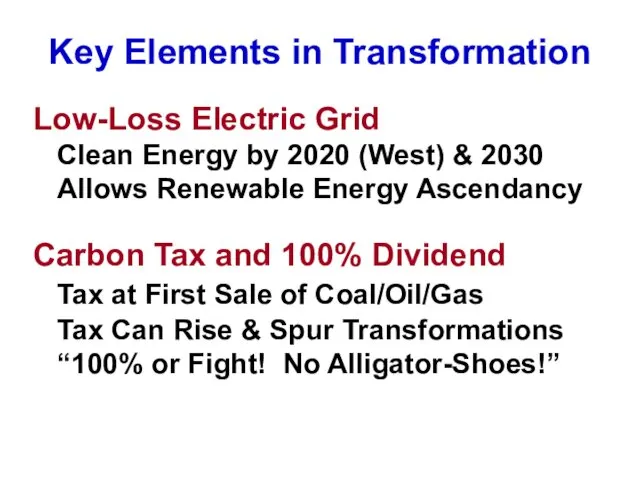
Key Elements in Transformation
Low-Loss Electric Grid
Clean Energy by 2020 (West)
Key Elements in Transformation
Low-Loss Electric Grid
Clean Energy by 2020 (West)
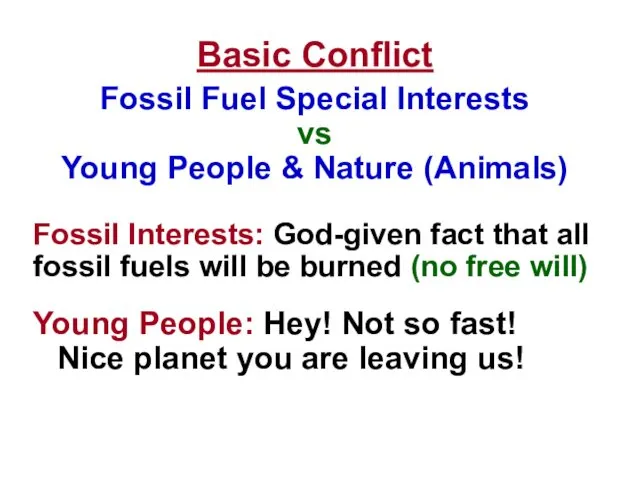
Basic Conflict
Fossil Fuel Special Interests
vs
Young People & Nature (Animals)
Fossil Interests: God-given
Fossil Fuel Special Interests
vs
Young People & Nature (Animals)
Fossil Interests: God-given
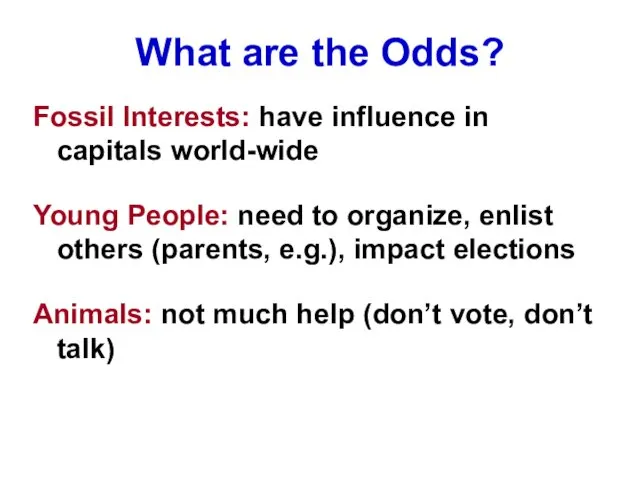
What are the Odds?
Fossil Interests: have influence in capitals world-wide
Young People:
What are the Odds?
Fossil Interests: have influence in capitals world-wide
Young People:
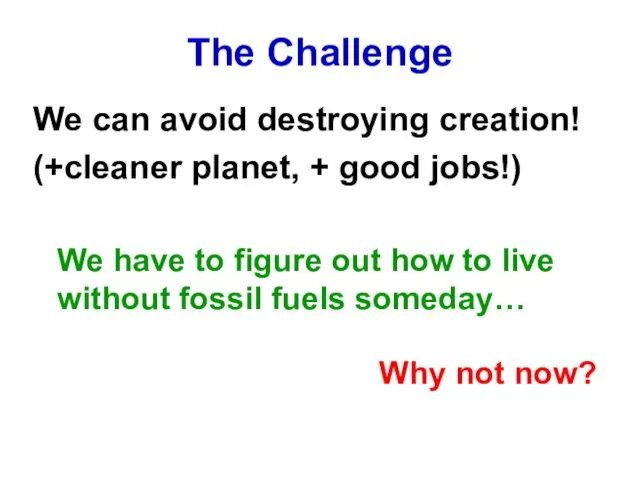
The Challenge
We can avoid destroying creation!
(+cleaner planet, + good jobs!)
We
The Challenge
We can avoid destroying creation!
(+cleaner planet, + good jobs!)
We
Web Site
www.columbia.edu/~jeh1
includes
Global Warming Twenty Years Later: Tipping Points Near (today’s statement)
Target
Web Site
www.columbia.edu/~jeh1
includes
Global Warming Twenty Years Later: Tipping Points Near (today’s statement)
Target
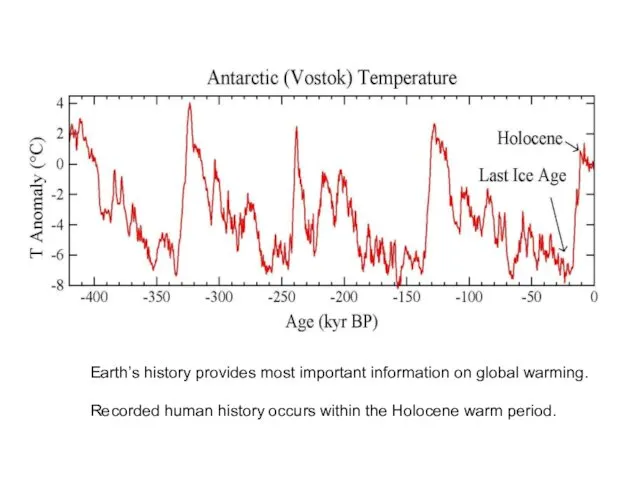
Earth’s history provides most important information on global warming.
Recorded human history
Earth’s history provides most important information on global warming.
Recorded human history
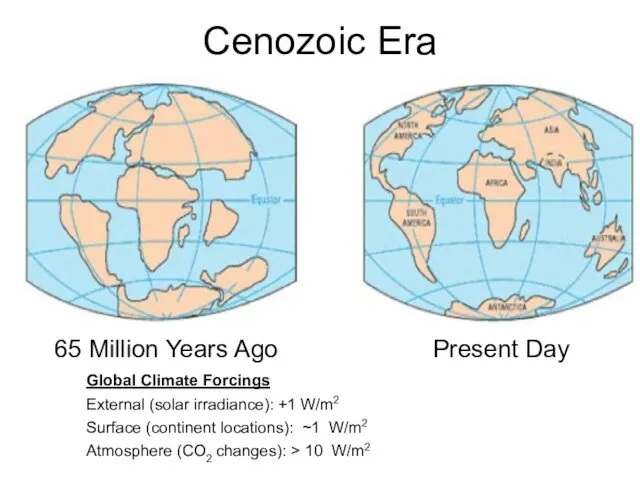
Cenozoic Era
65 Million Years Ago
Present Day
Global Climate Forcings
External (solar irradiance): +1
Cenozoic Era
65 Million Years Ago
Present Day
Global Climate Forcings
External (solar irradiance): +1
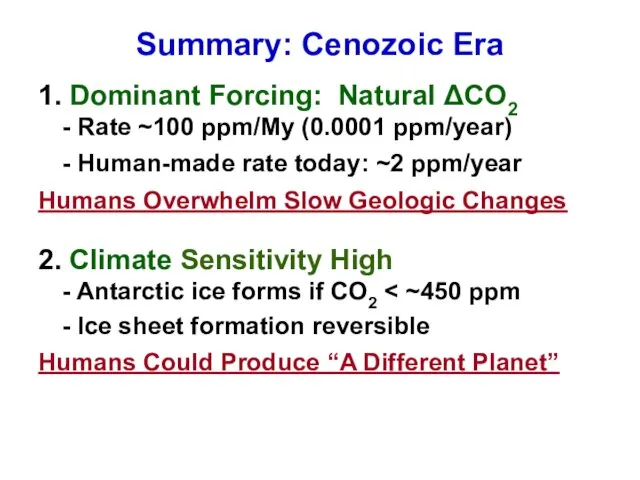
Summary: Cenozoic Era
1. Dominant Forcing: Natural ΔCO2
- Rate ~100 ppm/My (0.0001
Summary: Cenozoic Era
1. Dominant Forcing: Natural ΔCO2
- Rate ~100 ppm/My (0.0001

 Первоцветы. Виртуальная Красная книга растений ДНР
 Гигиеническая регламентация вредных химических веществ в воздухе
 Влияние добычи полезных ископаемых на окружающую среду
 Радиоактивное загрязнение
 Красная книга Республики Карелия
 Технологические процессы рубок. Технология рубок
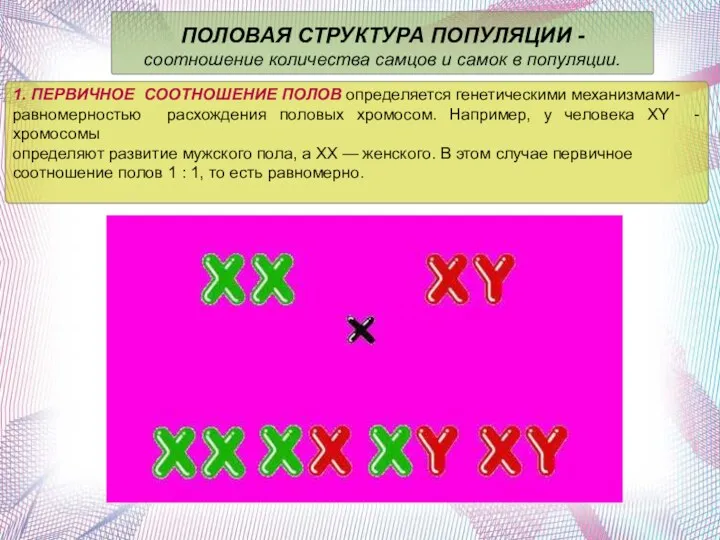 Половая структура популяции.
 Игра Экологический калейдоскоп
 Экология как наука
 Жизненный цикл стекла. Виды отходов из стекла
 Человек и биосфера. Медико-биологические аспекты экологии человека. Охрана природы и рациональное природопользование
 Искусственная экосистема аквариума
 Экологический кризис - миф или реальность?
 Земля - наш дом родной
 Проект Красная книга, или Возьмем под защиту
 Приключение группы 166 В поисках чекпоинтов
 Охрана окружающей среды
 Биоценозы и биогеоценозы. 9 класс
 Исследование воздействия ГРЭС-2 на окружающую среду
 Рекультивация земель
 Приучаем пользоваться бесфосфатной бытовой химией на Байкале
 Характеристика природооронних систем України
 Основы взаимодействия организма и среды
 Экологические проблемы Казахстана
 Международное сотрудничество в области природопользования и охраны окружающей среды
 Республика Крым
 Экологические проблемы озера
 Экология – экономика, политика, безопасность в Москве и Московской области