- Trace gas fluxes in Permafrost

Содержание
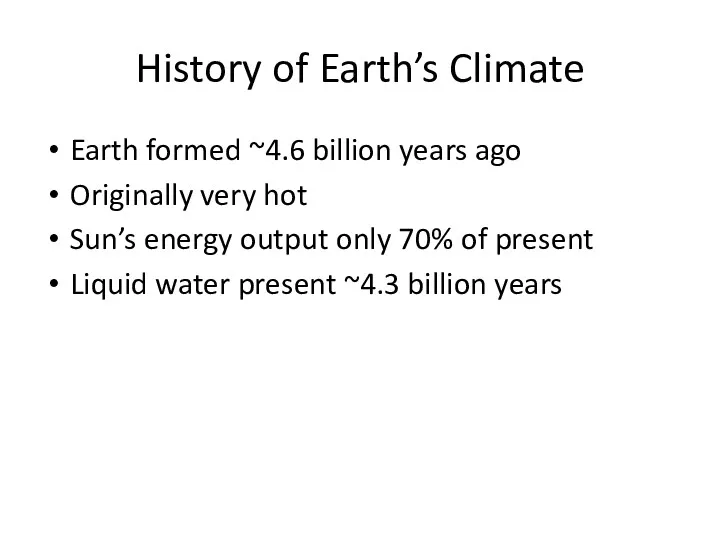
- 2. History of Earth’s Climate Earth formed ~4.6 billion years ago Originally very hot Sun’s energy output
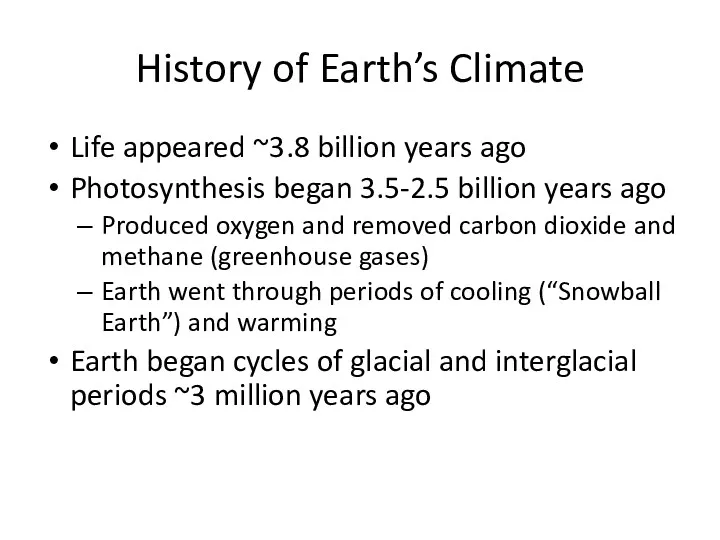
- 3. History of Earth’s Climate Life appeared ~3.8 billion years ago Photosynthesis began 3.5-2.5 billion years ago
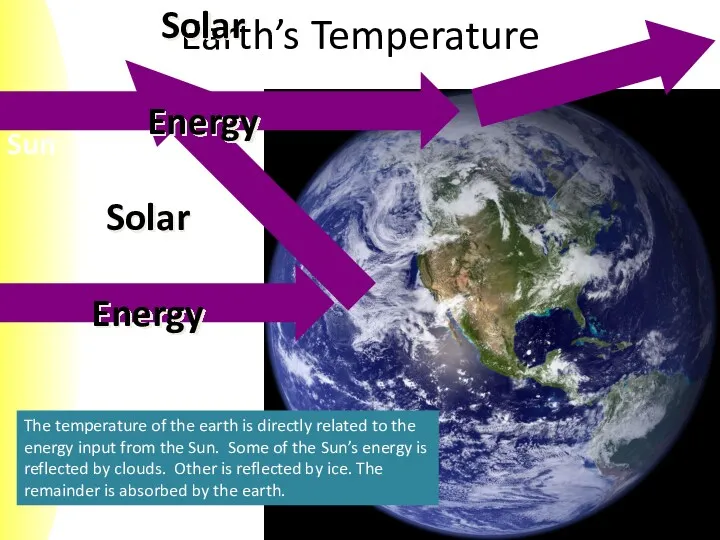
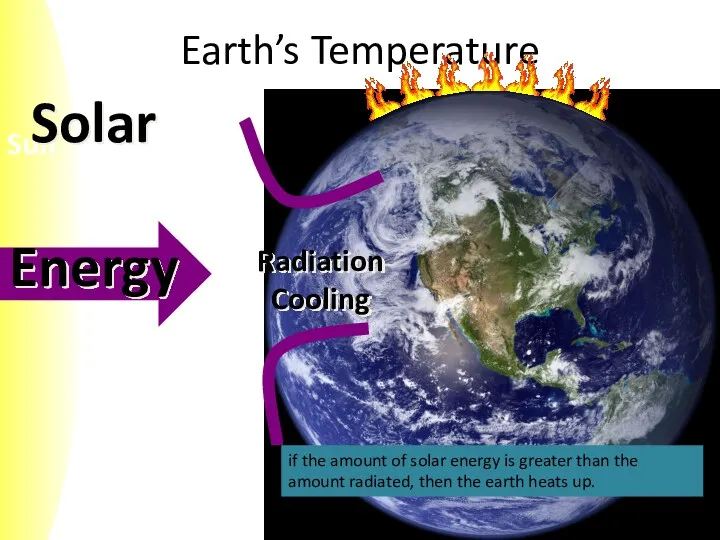
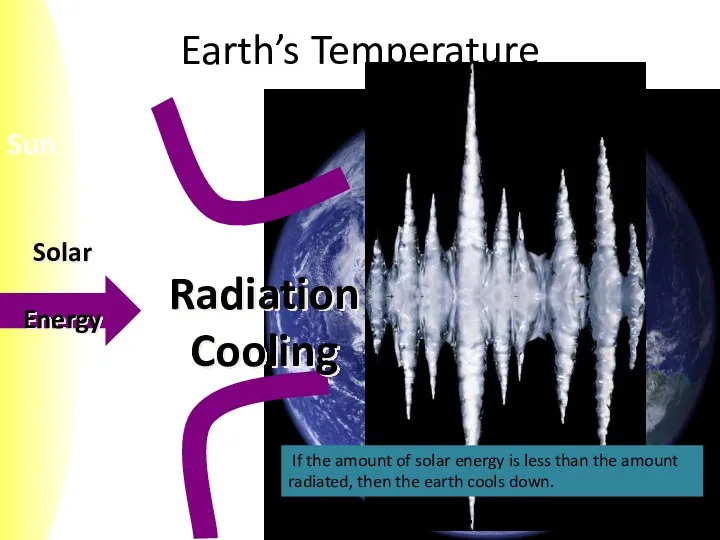
- 4. Earth’s Temperature The temperature of the earth is directly related to the energy input from the
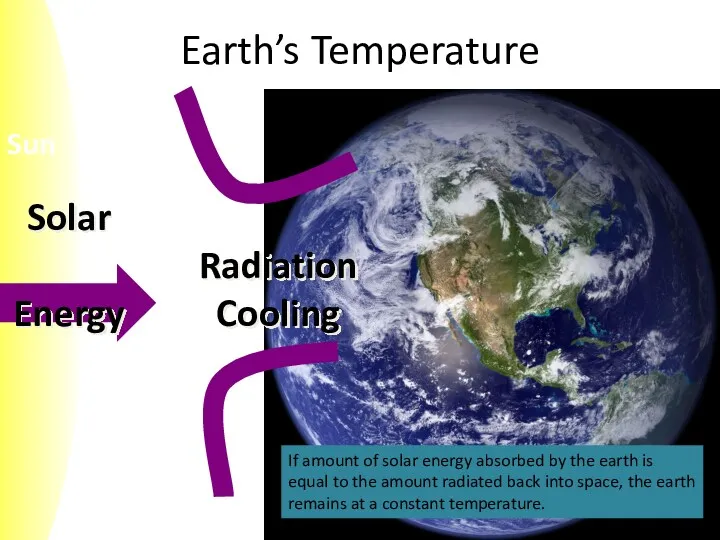
- 5. Earth’s Temperature If amount of solar energy absorbed by the earth is equal to the amount
- 6. Earth’s Temperature if the amount of solar energy is greater than the amount radiated, then the
- 7. Earth’s Temperature If the amount of solar energy is less than the amount radiated, then the
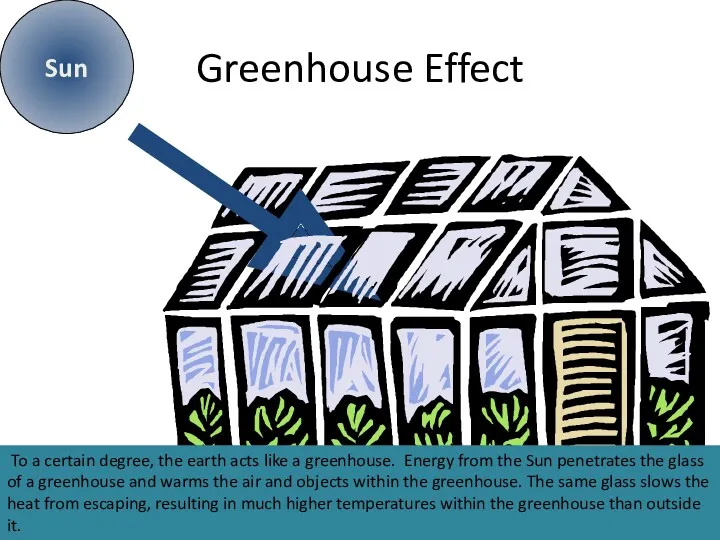
- 8. Greenhouse Effect Sun To a certain degree, the earth acts like a greenhouse. Energy from the
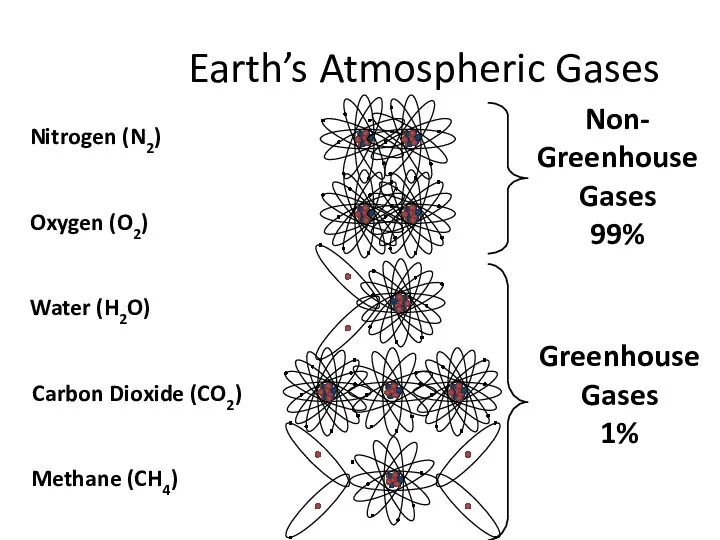
- 9. Earth’s Atmospheric Gases Non- Greenhouse Gases 99% Greenhouse Gases 1%
- 10. A trace gas is a gas that makes up an extremely small portion of a mixture
- 11. by Laurent Cousineau (Montreal) http://www.climate-change-guide.com/global-warming-potential-definition.html Global Warming Potential Definition The global warming potential (GWP) of a
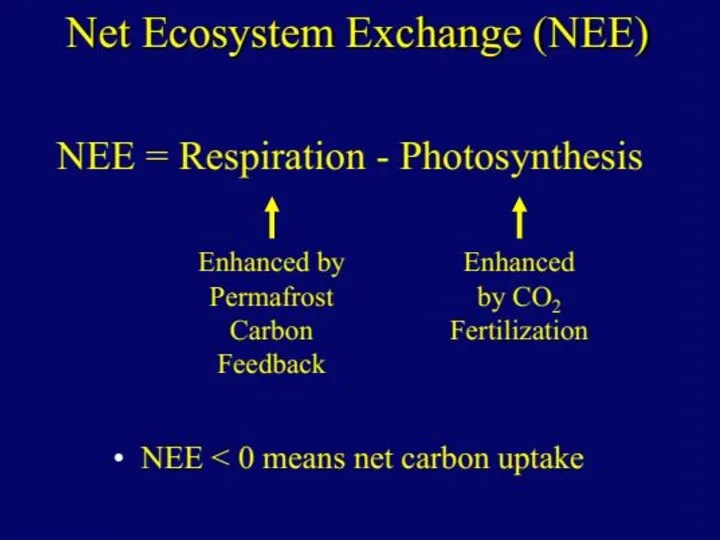
- 12. Climate Feedback Definition A climate feedback is a process that will either amplify or reduce climate
- 13. Carbon Dioxide Definition Carbon dioxide (CO2) is the primary anthropogenic greenhouse gasresponsible for global warming. Although
- 14. Methane Definition Methane (CH4) is a hydrocarbon and an important greenhouse gas. According to the IPCC’s
- 17. Natural sources of atmospheric carbon dioxide include volcanic outgassing, the combustion of organic matter, wildfires and
- 18. The Calvin cycle proceeds in three stages: carboxylation, reduction, and regeneration Carboxylation of the CO2 acceptor,
- 22. • There is a clear correlation between the amount of anthropogenic CO2 released to the atmosphere
- 23. На эти две реакции с ОН приходится около 90% удаления метана из атмосферы. Кроме реакции с
- 24. Pervasiveness of Life Snow algae on glacier Sierra Nevada, CA Earth life extraordinarily successful Natural selection
- 25. Five Things You Need to Have Life Stable Environment be able to adapt to changes Liquid
- 26. Liquid Water If T below 0˚C, microbes can be found growing between ice crystals or in
- 27. Carbon Source CO2 autotrophs organic carbon heterotrophs Can combine words for energy and carbon sources:
- 28. The Importance of Oxygen Oxygen is a potent source of energy (strongest oxidant available) Anaerobic metabolisms
- 29. Aerobic Metabolisms (Aerobes) Animals “CH2O” + O2 -? CO2 + H2O organotrophy Manganese Mn2+ + O2
- 30. Anaerobic Metabolisms (Anaerobes) Sulfate H2SO4 + 4H2 ---> H2S + 4H2O chemotrophy Reducers Methanogenesis CO2 +
- 31. Temperature Temperature One of the most important environmental factors that affect growth and survival of organisms.
- 32. Growth Temperature Psychrophile - grows optimally below 15˚C 80% of Earth’s biosphere is Mesophile - grows
- 33. Extremophiles What is extreme for one organism is necessary for another. Organisms are all highly adapted
- 34. Microbial Life Runs Planet Earth Microbial diversity is vast. Number of species astronomical. been cultured in
- 35. Metanogens – Archaea – absence of oxygen Metanotrophs – I and II types – presence of
- 36. The permafrost is overlain by a seasonally thawed active layer (brown). The bold dashed line indicates
- 37. Field school-seminar for young scientists on polar research September 18—23, 2016, Field station of AARI “Ladoga”
- 38. Microbial controls on methane fluxes from polygonal tundra Wagner et al., 2003: Permafrost Periglac Process
- 39. Field school-seminar for young scientists on polar research September 18—23, 2016, Field station of AARI “Ladoga”
- 41. Thermokarst lakes “hotspot”
- 42. Methane emission: bogs and lakes Mechanisms of methane production: On bogs the substrate for methane production
- 43. Methanehydrates Crystalline structure formed by water molecules with methane molecule inside Stable for high pressure At
- 44. Temperature anomalies between 2000-2009 compared to average temperatures between 1951-1980 Global carbon pools in the northern
- 45. Circum-Arctic permafrost distribution IPA Standing Committee on Data Information & Communication, 2003 BACKGROUND
- 46. Field school-seminar for young scientists on polar research September 18—23, 2016, Field station of AARI “Ladoga”
- 47. Field school-seminar for young scientists on polar research September 18—23, 2016, Field station of AARI “Ladoga”
- 49. Field school-seminar for young scientists on polar research September 18—23, 2016, Field station of AARI “Ladoga”
- 50. В определении терминов Четвертого оценочного доклада IPCC , "время жизни" имеет несколько значений. Наиболее подходящим является:
- 52. Скачать презентацию
History of Earth’s Climate
Earth formed ~4.6 billion years ago
Originally very hot
Sun’s
History of Earth’s Climate
Earth formed ~4.6 billion years ago
Originally very hot
Sun’s
History of Earth’s Climate
Life appeared ~3.8 billion years ago
Photosynthesis began 3.5-2.5
History of Earth’s Climate
Life appeared ~3.8 billion years ago
Photosynthesis began 3.5-2.5
Earth’s Temperature
The temperature of the earth is directly related to the
Earth’s Temperature
The temperature of the earth is directly related to the
Earth’s Temperature
If amount of solar energy absorbed by the earth is
Earth’s Temperature
If amount of solar energy absorbed by the earth is
Earth’s Temperature
if the amount of solar energy is greater than the
Earth’s Temperature
if the amount of solar energy is greater than the
Earth’s Temperature
If the amount of solar energy is less than
Earth’s Temperature
If the amount of solar energy is less than
Greenhouse Effect
Sun
To a certain degree, the earth acts like a
Greenhouse Effect
Sun
To a certain degree, the earth acts like a
Earth’s Atmospheric Gases
Non-
Greenhouse
Gases
99%
Greenhouse
Gases
1%
Earth’s Atmospheric Gases
Non-
Greenhouse
Gases
99%
Greenhouse
Gases
1%
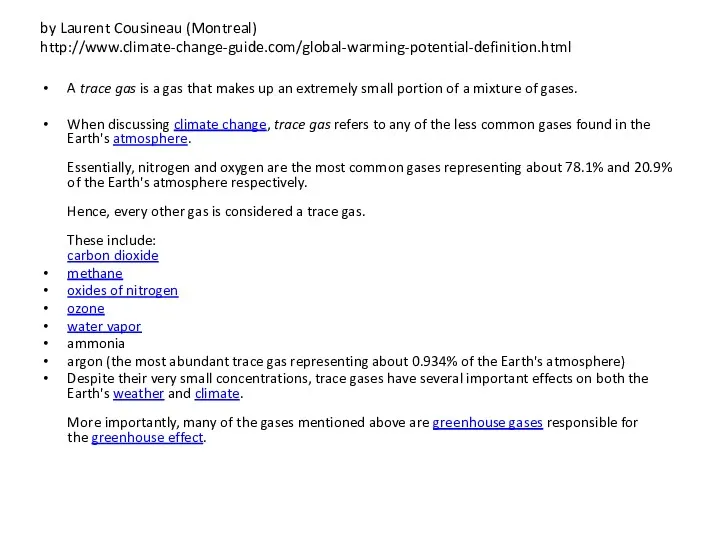
A trace gas is a gas that makes up an extremely small portion
A trace gas is a gas that makes up an extremely small portion
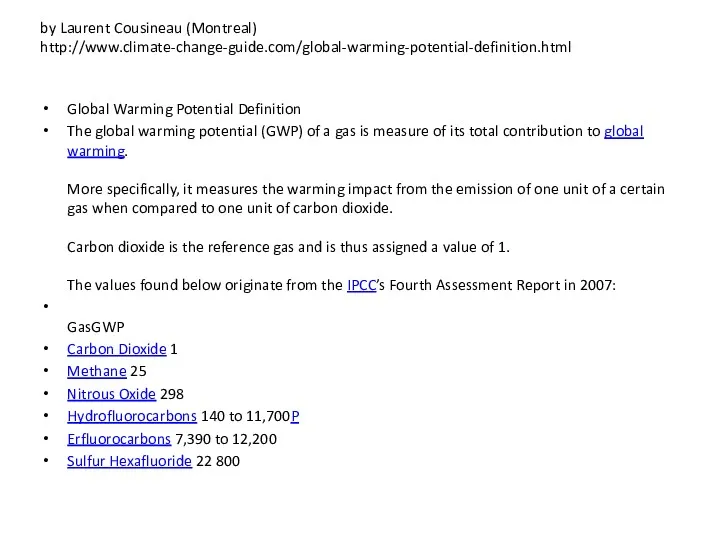
by Laurent Cousineau (Montreal)
http://www.climate-change-guide.com/global-warming-potential-definition.html
Global Warming Potential Definition
The global warming potential (GWP) of
by Laurent Cousineau (Montreal)
http://www.climate-change-guide.com/global-warming-potential-definition.html
Global Warming Potential Definition
The global warming potential (GWP) of
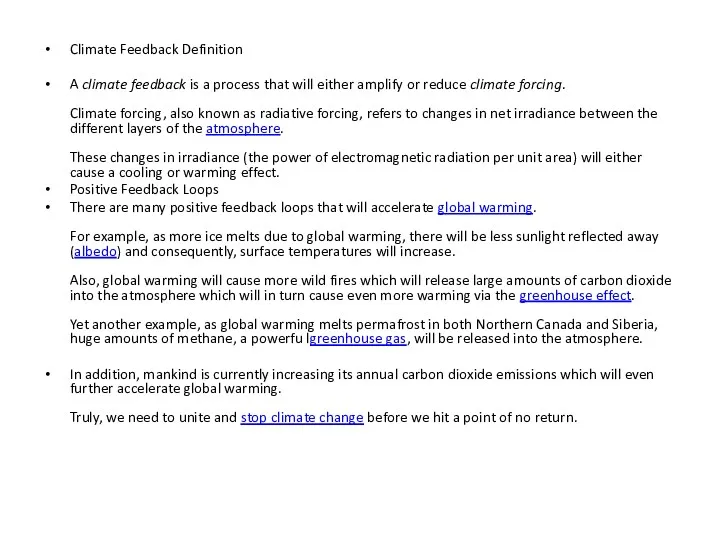
Climate Feedback Definition
A climate feedback is a process that will either amplify or
Climate Feedback Definition
A climate feedback is a process that will either amplify or
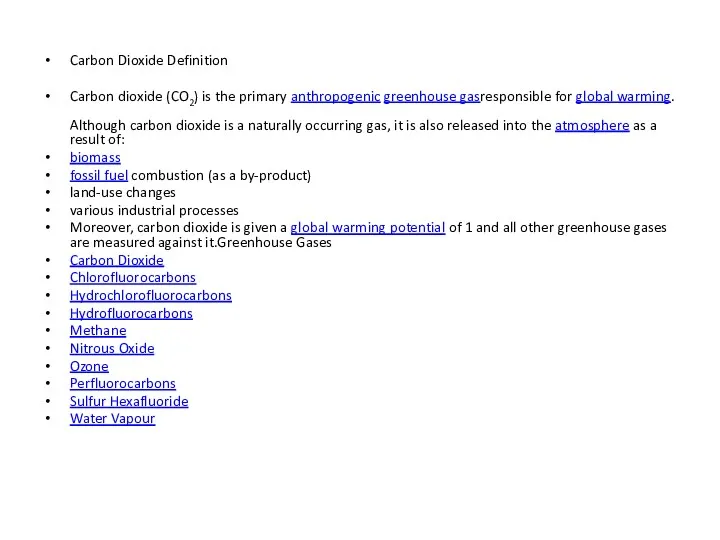
Carbon Dioxide Definition
Carbon dioxide (CO2) is the primary anthropogenic greenhouse gasresponsible for global warming.
Although
Carbon Dioxide Definition
Carbon dioxide (CO2) is the primary anthropogenic greenhouse gasresponsible for global warming.
Although
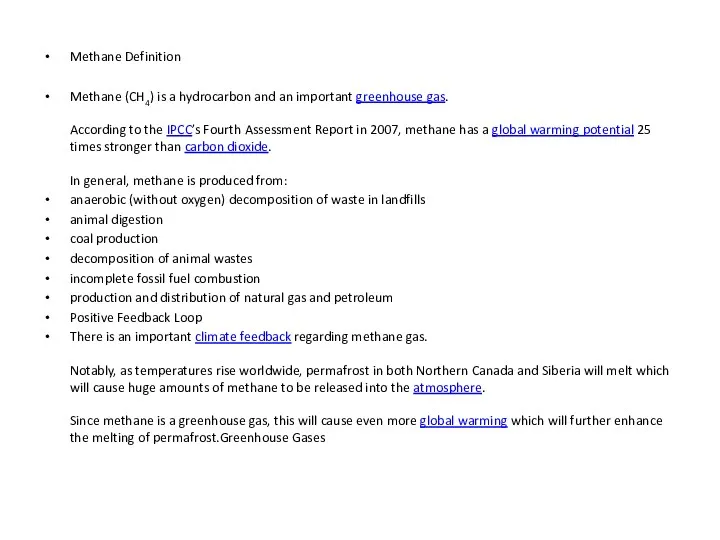
Methane Definition
Methane (CH4) is a hydrocarbon and an important greenhouse gas.
According to
Methane Definition
Methane (CH4) is a hydrocarbon and an important greenhouse gas.
According to
Natural sources of atmospheric carbon dioxide include volcanic outgassing, the combustion of organic matter, wildfires and the respiration processes of
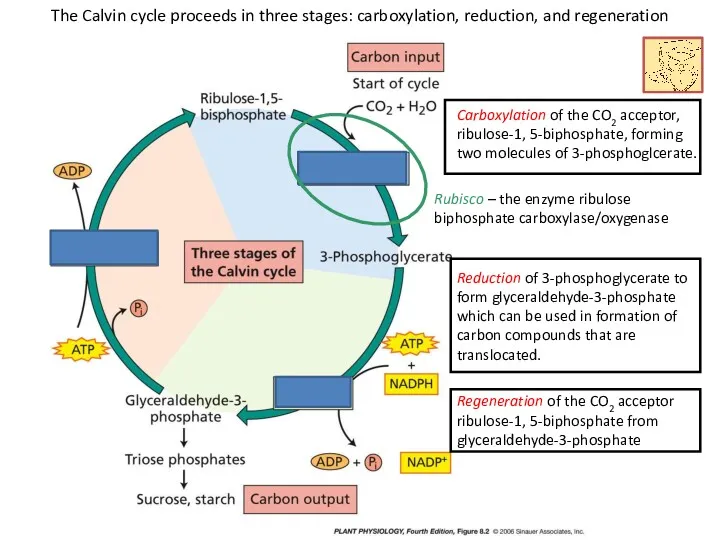
The Calvin cycle proceeds in three stages: carboxylation, reduction, and regeneration
Carboxylation
The Calvin cycle proceeds in three stages: carboxylation, reduction, and regeneration
Carboxylation
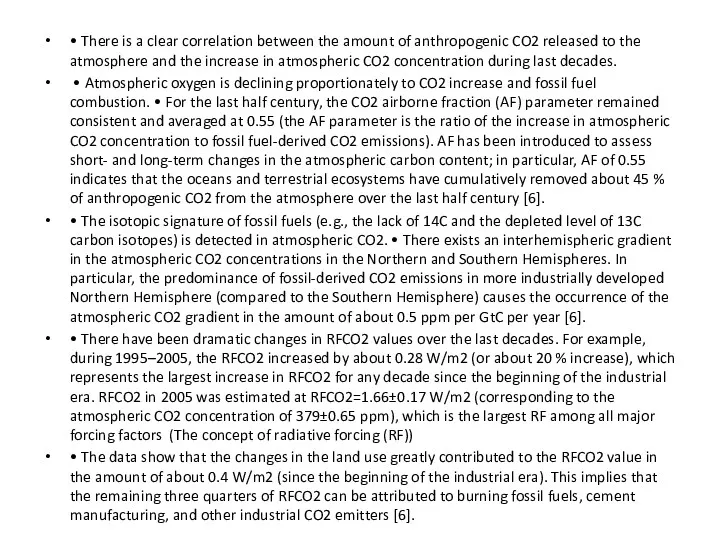
• There is a clear correlation between the amount of anthropogenic
• There is a clear correlation between the amount of anthropogenic
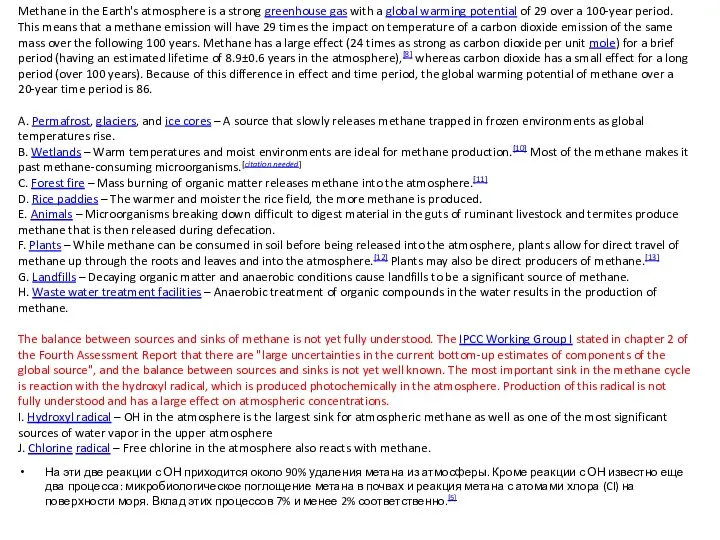
На эти две реакции с ОН приходится около 90% удаления метана
На эти две реакции с ОН приходится около 90% удаления метана
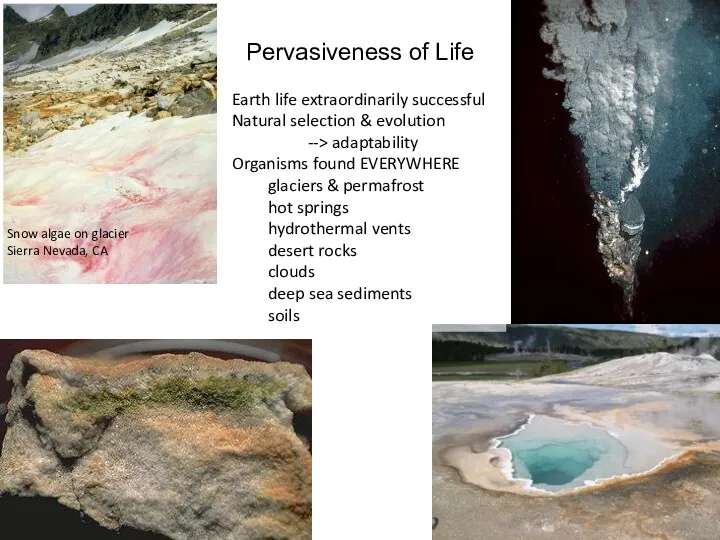
Pervasiveness of Life
Snow algae on glacier
Sierra Nevada, CA
Earth life extraordinarily successful
Natural
Pervasiveness of Life
Snow algae on glacier
Sierra Nevada, CA
Earth life extraordinarily successful
Natural
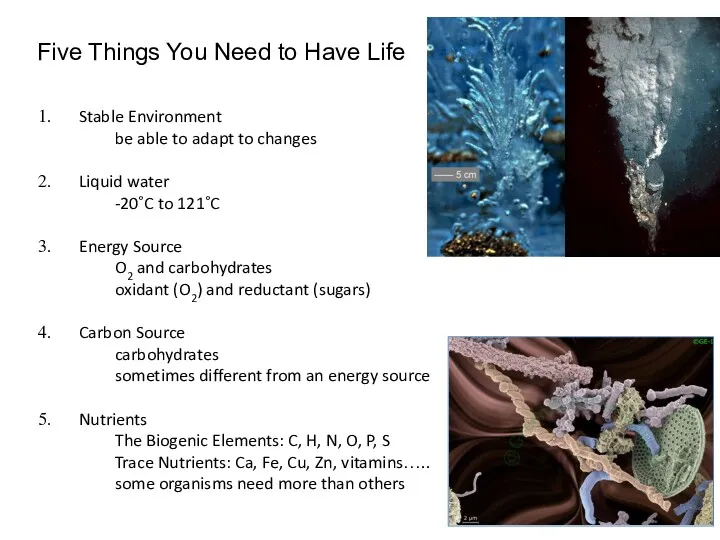
Five Things You Need to Have Life
Stable Environment
be able to adapt
Five Things You Need to Have Life
Stable Environment
be able to adapt
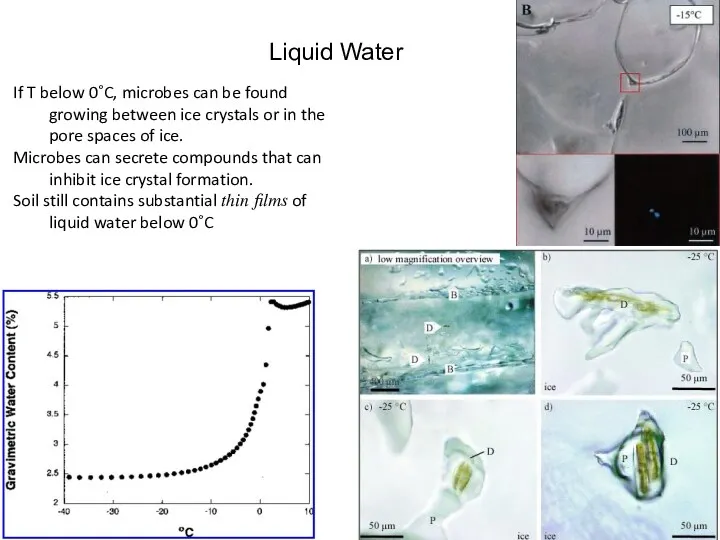
Liquid Water
If T below 0˚C, microbes can be found
growing between ice
Liquid Water
If T below 0˚C, microbes can be found
growing between ice
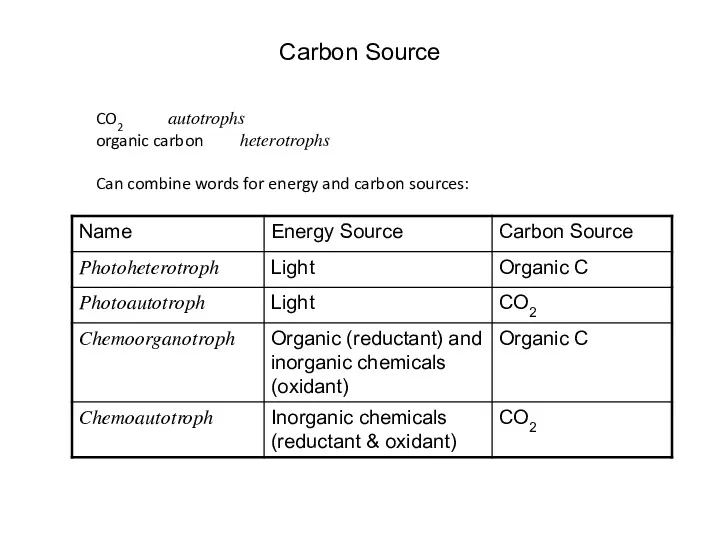
Carbon Source
CO2 autotrophs
organic carbon heterotrophs
Can combine words for energy and carbon sources:
Carbon Source
CO2 autotrophs
organic carbon heterotrophs
Can combine words for energy and carbon sources:
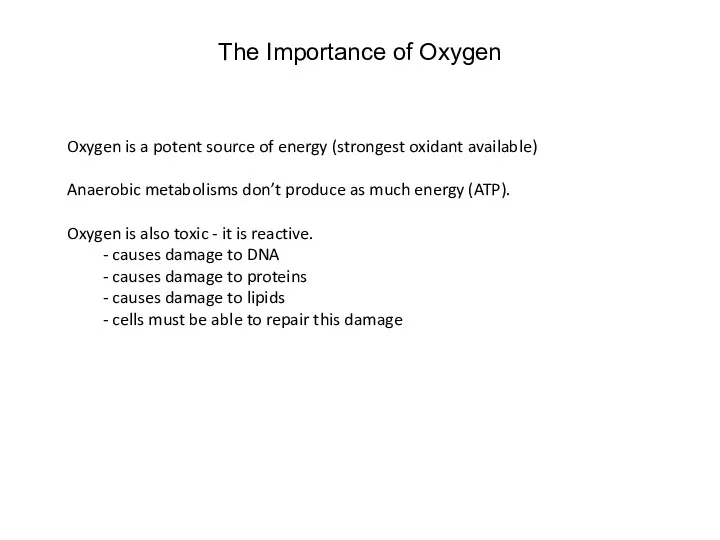
The Importance of Oxygen
Oxygen is a potent source of energy (strongest
The Importance of Oxygen
Oxygen is a potent source of energy (strongest
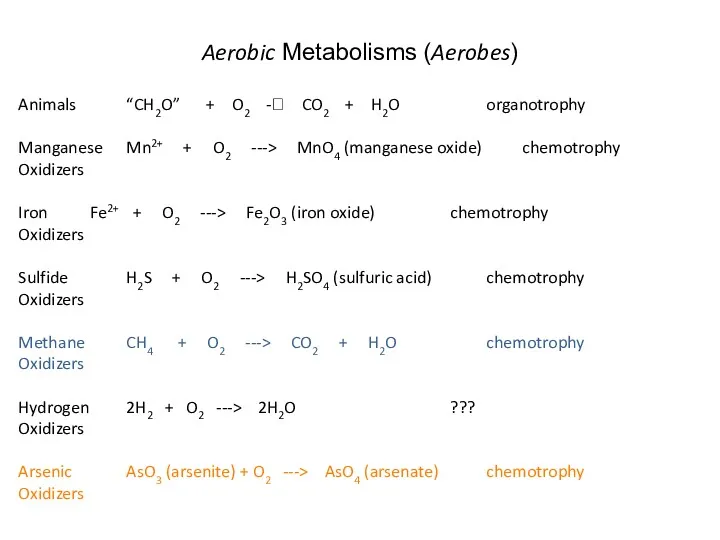
Aerobic Metabolisms (Aerobes)
Animals “CH2O” + O2 -? CO2 + H2O organotrophy
Manganese Mn2+ + O2
Aerobic Metabolisms (Aerobes)
Animals “CH2O” + O2 -? CO2 + H2O organotrophy
Manganese Mn2+ + O2
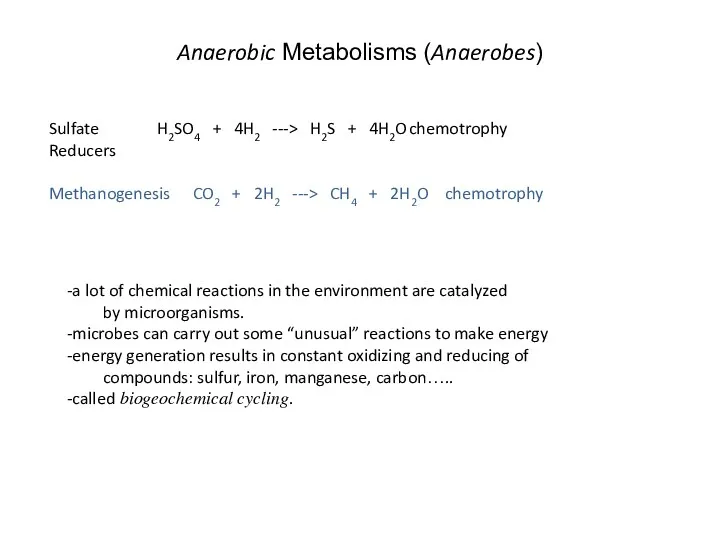
Anaerobic Metabolisms (Anaerobes)
Sulfate H2SO4 + 4H2 ---> H2S + 4H2O chemotrophy
Reducers
Methanogenesis CO2 + 2H2
Anaerobic Metabolisms (Anaerobes)
Sulfate H2SO4 + 4H2 ---> H2S + 4H2O chemotrophy
Reducers
Methanogenesis CO2 + 2H2
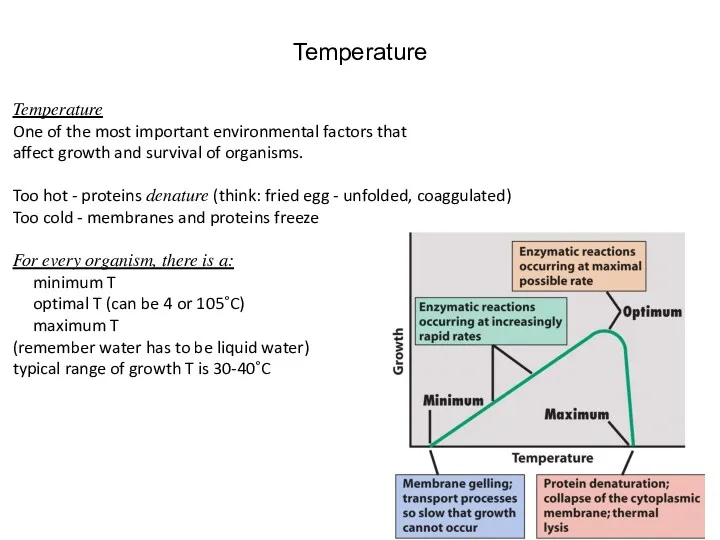
Temperature
Temperature
One of the most important environmental factors that
affect growth and
Temperature
Temperature
One of the most important environmental factors that
affect growth and
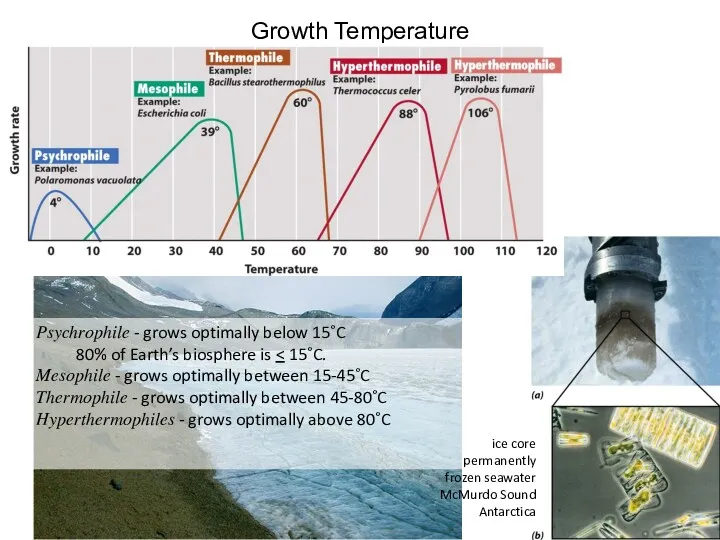
Growth Temperature
Psychrophile - grows optimally below 15˚C
80% of Earth’s biosphere
Growth Temperature
Psychrophile - grows optimally below 15˚C
80% of Earth’s biosphere
Extremophiles
What is extreme for one organism is necessary for another.
Organisms are
Extremophiles
What is extreme for one organism is necessary for another.
Organisms are
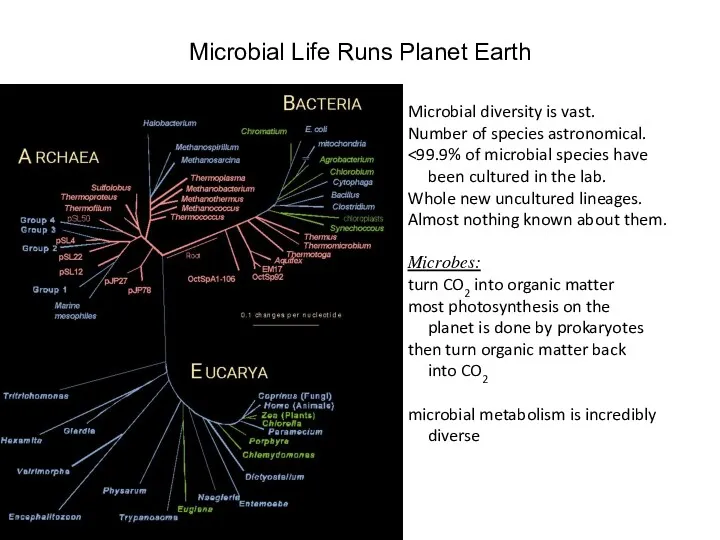
Microbial Life Runs Planet Earth
Microbial diversity is vast.
Number of species astronomical.
<99.9%
Microbial Life Runs Planet Earth
Microbial diversity is vast.
Number of species astronomical.
<99.9%
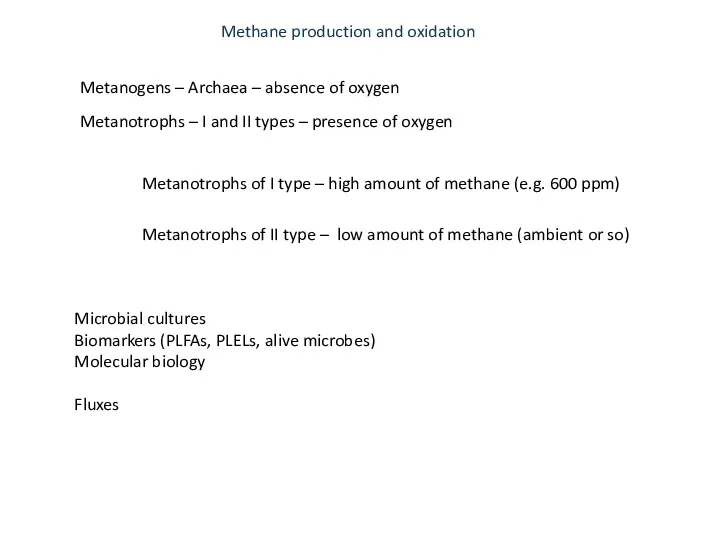
Metanogens – Archaea – absence of oxygen
Metanotrophs – I and II
Metanogens – Archaea – absence of oxygen
Metanotrophs – I and II
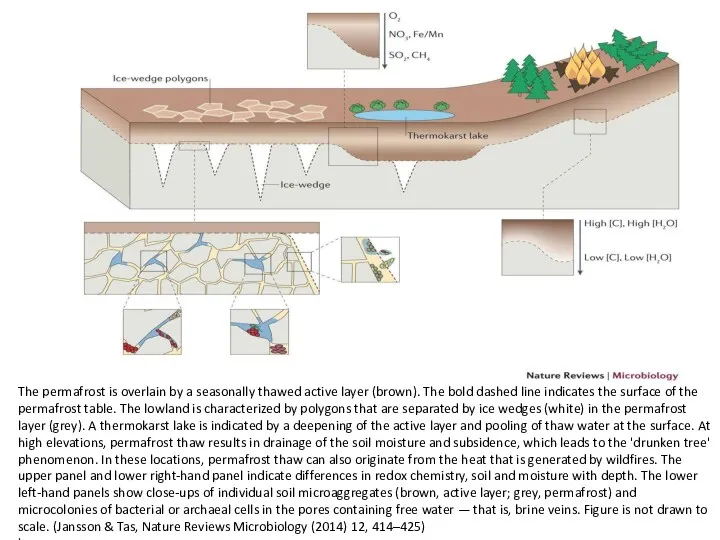
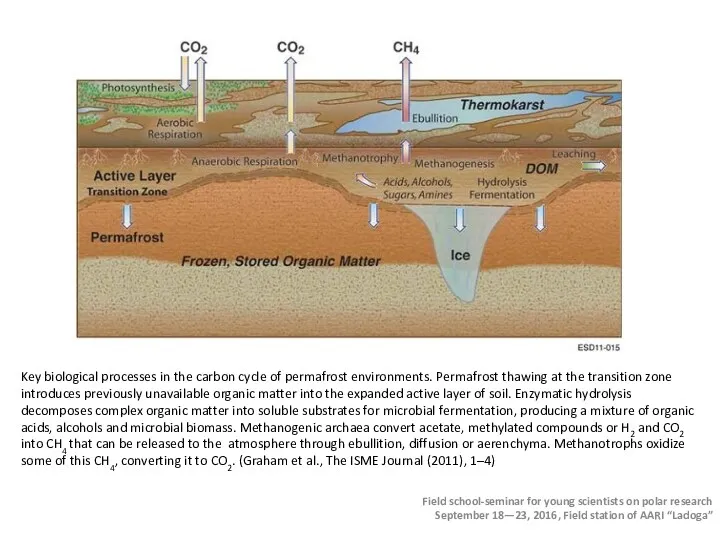
The permafrost is overlain by a seasonally thawed active layer (brown).
The permafrost is overlain by a seasonally thawed active layer (brown).
Field school-seminar for young scientists on polar research
September 18—23, 2016, Field
Field school-seminar for young scientists on polar research
September 18—23, 2016, Field
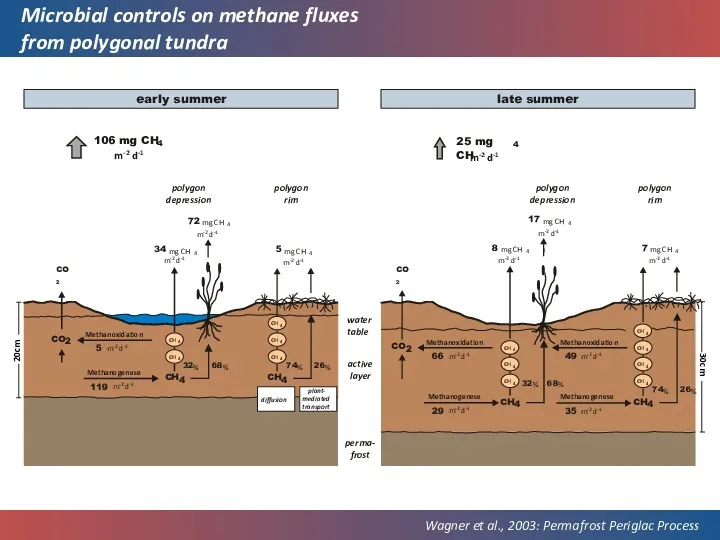
Microbial controls on methane fluxes
from polygonal tundra
Wagner et al., 2003:
Microbial controls on methane fluxes
from polygonal tundra
Wagner et al., 2003:
Field school-seminar for young scientists on polar research
September 18—23, 2016, Field
Field school-seminar for young scientists on polar research
September 18—23, 2016, Field
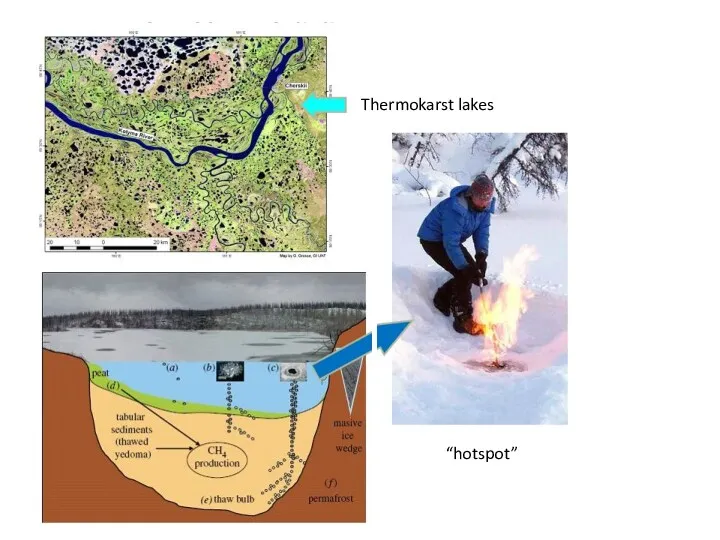
Thermokarst lakes
“hotspot”
Thermokarst lakes
“hotspot”
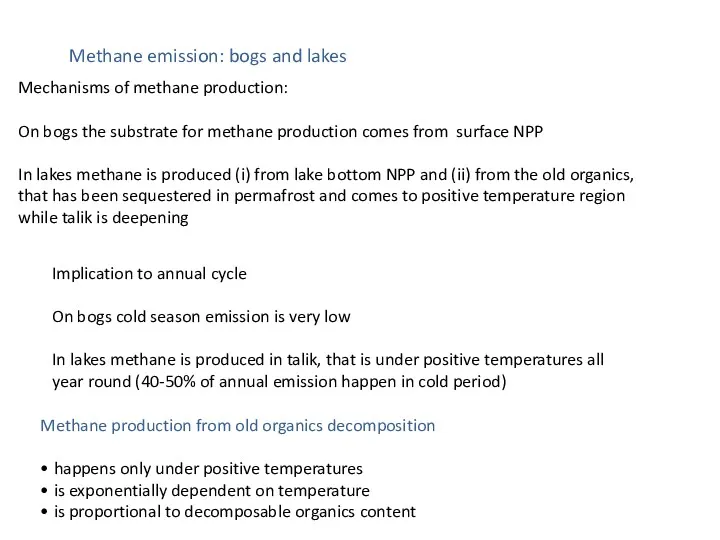
Methane emission: bogs and lakes
Mechanisms of methane production:
On bogs the substrate
Methane emission: bogs and lakes
Mechanisms of methane production:
On bogs the substrate
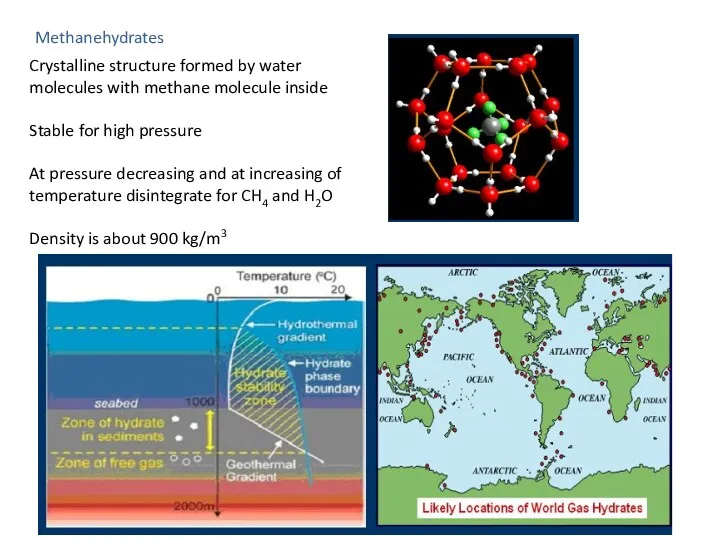
Methanehydrates
Crystalline structure formed by water molecules with methane molecule inside
Stable for
Methanehydrates
Crystalline structure formed by water molecules with methane molecule inside
Stable for
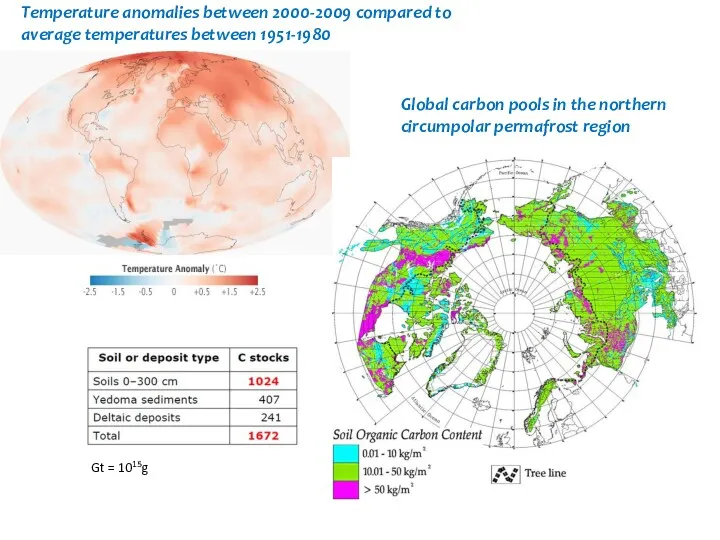
Temperature anomalies between 2000-2009 compared to
average temperatures between 1951-1980
Global carbon pools
Temperature anomalies between 2000-2009 compared to
average temperatures between 1951-1980
Global carbon pools
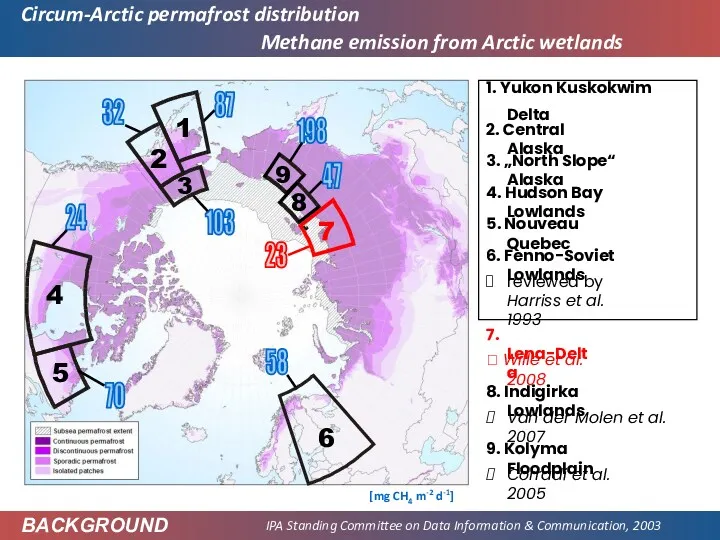
Circum-Arctic permafrost distribution
IPA Standing Committee on Data Information & Communication, 2003
BACKGROUND
Circum-Arctic permafrost distribution
IPA Standing Committee on Data Information & Communication, 2003
BACKGROUND
Field school-seminar for young scientists on polar research
September 18—23, 2016, Field
Field school-seminar for young scientists on polar research
September 18—23, 2016, Field
Field school-seminar for young scientists on polar research
September 18—23, 2016, Field
Field school-seminar for young scientists on polar research
September 18—23, 2016, Field
Field school-seminar for young scientists on polar research
September 18—23, 2016, Field
Field school-seminar for young scientists on polar research
September 18—23, 2016, Field
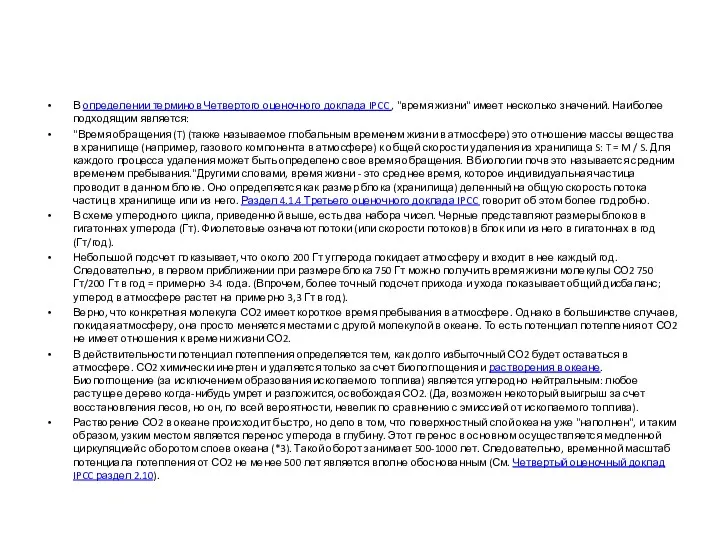
В определении терминов Четвертого оценочного доклада IPCC , "время жизни" имеет несколько значений.
В определении терминов Четвертого оценочного доклада IPCC , "время жизни" имеет несколько значений.
 Лекция 9. Основы популяционной экологии
 Эколого-экономическая оценка эффективности природоохранных мероприятий
 Естественные сообщества живых организмов, компоненты биогеоценозов. 11 класс
 Красная книга России
 Пресноводные экосистемы
 Экологические проблемы в сельском хозяйстве
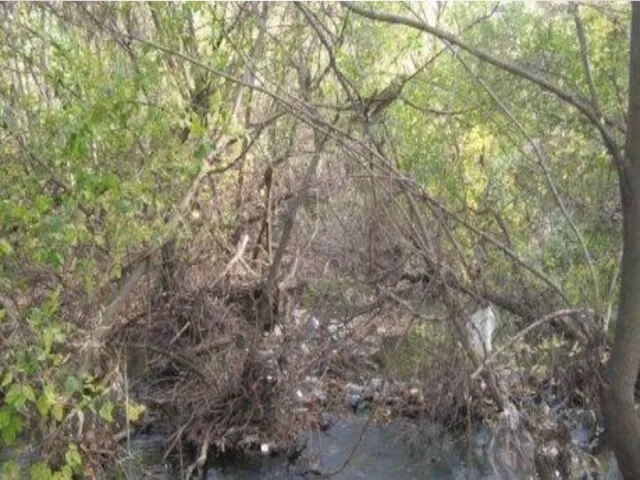 Влияние жизнедеятельности бобров на экологию реки Малая Каменка
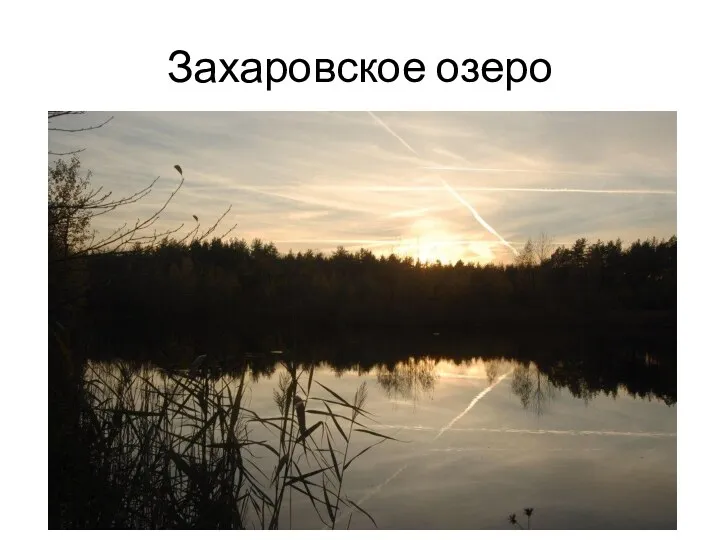 Захаровское озеро. Облагораживание
 Черное море и его экологические проблемы
 Техническое перевооружение очистных сооружений фабрики по переработке табачного сырья ООО Крес Нева
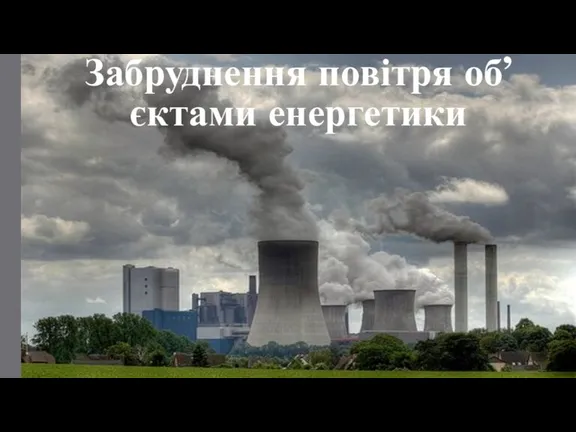 Забруднення повітря об’єктами енергетики
 Особенности взаимодействия общества и природы
 Презентация к уроку экологического краеведения Озеро в опасности.
 Презентация по темеОсобо охраняемые природные территории Брянской области в системе экологического каркаса
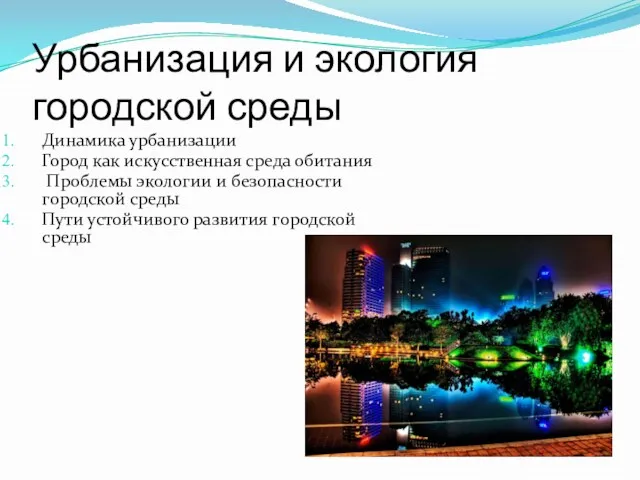 Урбанизация и экология городской среды
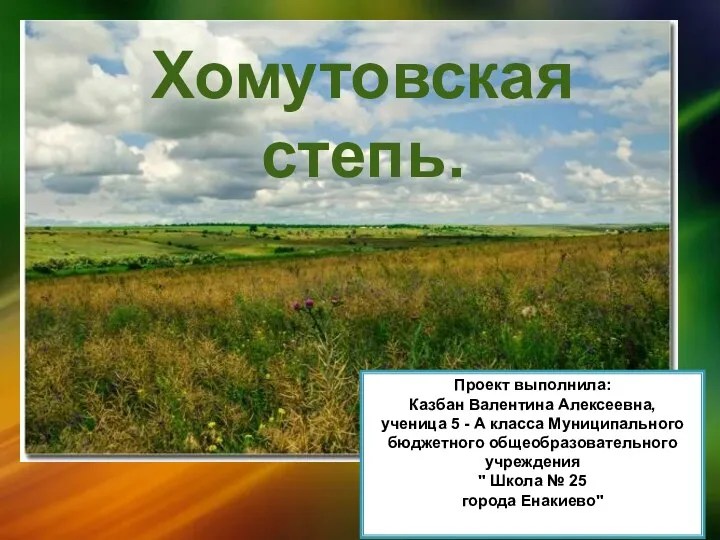 Khomutovskaya_step
 Ecological Problems
 Les principales dispositions legislatives et reglementaires regissant le HSE
 Экоурок Свобода от отходов
 Әлемдік мұхиттардың ластануы
 Bio-monitoring and bio-indicators in the aspect of climate change
 ПРО отходы!
 Пути сохранения биоразнообразия и генофонда биосферы
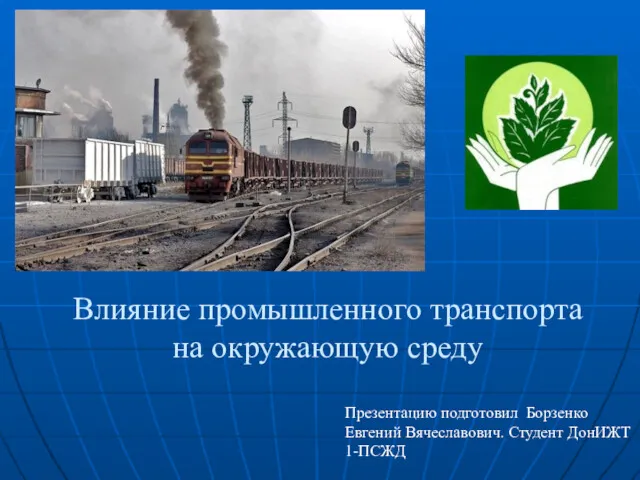 Влияние промышленного транспорта на окружающую среду
 Природоохороні технології
 Экологические проблемы Казахстана
 Изменение климата
 Crafts from waste