- Capacity and Demand (Lecture # 10)

Содержание
- 2. A problem AUA average power consumption rate is: 75 kW. Large Auditorium Lighting ONLY takes: 120
- 3. Solution Answer: 75 kW? 120 kW? 195 kW? Or? Answer: Solve an optimization problem.
- 4. Capacity & Demand Investment is needed to add the physical Stock of Capital. Capital Stock =
- 5. Capacity & Demand Power shortage means: Peak demand > Installed capacity Energy shortage means: Not enough
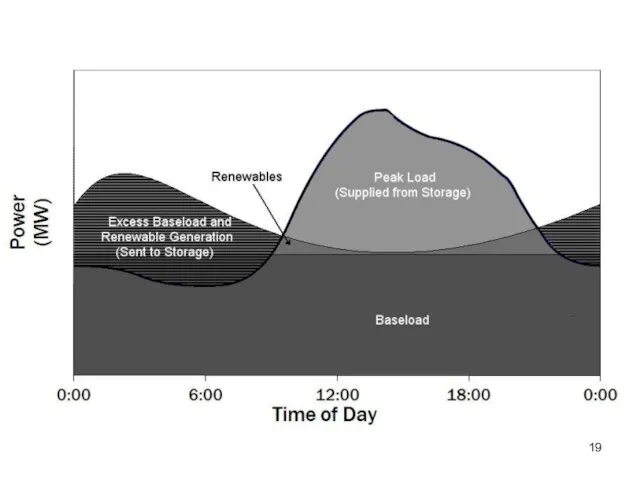
- 6. Load curves Electric power demand = load Load curves, regular (periodic): Daily Weekly Seasonal Per shift,
- 7. Seasonal
- 8. Daily Peak Demand Annual Frequency Histogram
- 9. Daily
- 10. Capacity factor (CF) Actual Generated Energy CF = Energy Generated @ 100% Is it constant? It
- 11. Hydropower
- 12. Comparison
- 13. PV capacity factor 1kW of PV produces always annual amount kWhs equal to the monitoring amount:
- 14. Energy Shortage: Two Approaches Construction of new capacities - supply side. Conservation, Load leveling – demand
- 15. Peak vs. Average vs. Base AUA peak is: 75 kW? 120 kW? 195 kW? Or? Average
- 16. Countrywise Peak Average Base
- 17. Peak All powerplants, all generation capacities are operating. We are going to extreme measures: ALLOWING TO
- 18. Base Consumption never goes below certain amount Metsamor NPP is providing the base power.
- 20. 2011Ã.-Ç Ñ½áñáõÃÛ³Ý ¨ ¿É»Ïïñ³¿Ý»ñ·Ç³ÛÇ Ñ³ßí»ÏßÇé
- 21. ¾É»Ïïñ³¿Ý»ñ·Ç³ÛÇ Ñ³ßí»ÏßÇé
- 22. Average is in Between! Thus one needs: BASE, stabile, powerplants, e.g. Nuclear, Coal. CF > 90%;
- 24. Renewable Wind (CF Solar (CF
- 26. Load leveling is a method for reducing large fluctuations in power demand
- 27. Load Leveling - DSM Demand Side Management, the task is to decrease the demand at PEAK
- 28. Elasticity % Demand Change E(d) = % of Price Change
- 29. Load Leveling - SSM Supply Side Management, the task is to organize capacities to meet the
- 30. European policy In 2007, the EU was importing 82% of its oil and 57% of its
- 31. Energy Market
- 32. Dispatching
- 33. Storage Hydro-Pump Natural gas Thermal Hydrogen
- 34. Storage
- 35. Load levelling – pumped hydro storage
- 36. Load levelling – pumped hydro storage
- 37. RA gasification level ~94% Length of the main pipelines 14 050 km Number of gasified communities
- 38. Load levelling – EV fleet
- 40. Скачать презентацию
A problem
AUA average power consumption rate is:
75 kW.
Large Auditorium Lighting ONLY
A problem
AUA average power consumption rate is:
75 kW.
Large Auditorium Lighting ONLY
Solution
Answer:
75 kW?
120 kW?
195 kW?
Or?
Answer: Solve an optimization problem.
Solution
Answer:
75 kW?
120 kW?
195 kW?
Or?
Answer: Solve an optimization problem.
Capacity & Demand
Investment is needed to add the physical Stock of
Capacity & Demand
Investment is needed to add the physical Stock of
Capacity & Demand
Power shortage means:
Peak demand > Installed capacity
Energy shortage means:
Not
Capacity & Demand
Power shortage means:
Peak demand > Installed capacity
Energy shortage means:
Not
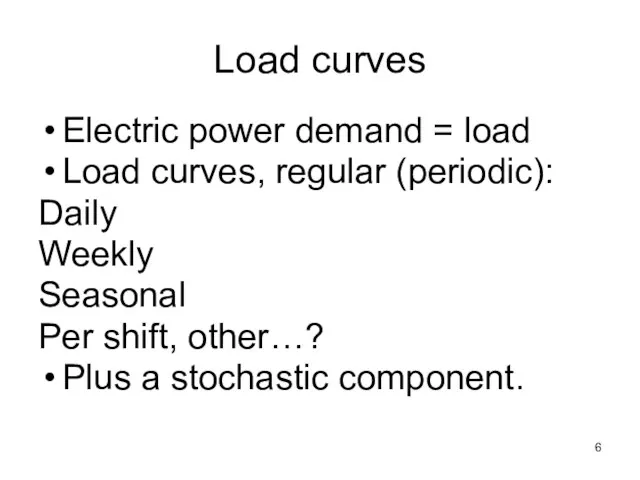
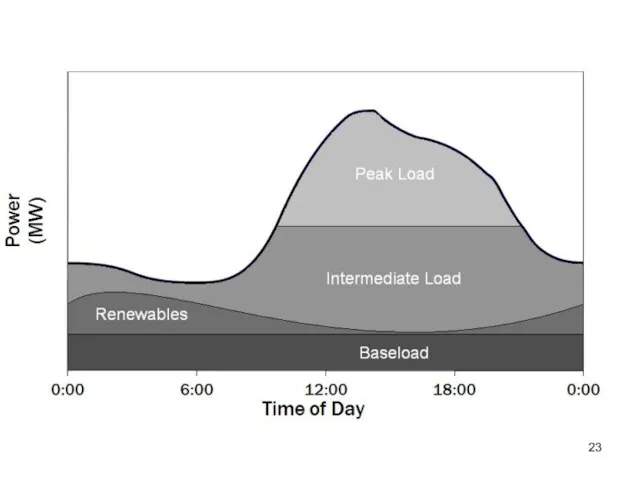
Load curves
Electric power demand = load
Load curves, regular (periodic):
Daily
Weekly
Seasonal
Per
Load curves
Electric power demand = load
Load curves, regular (periodic):
Daily
Weekly
Seasonal
Per
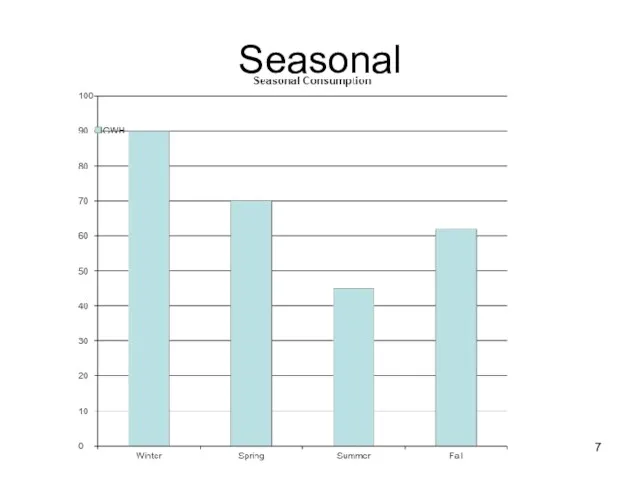
Seasonal
Seasonal
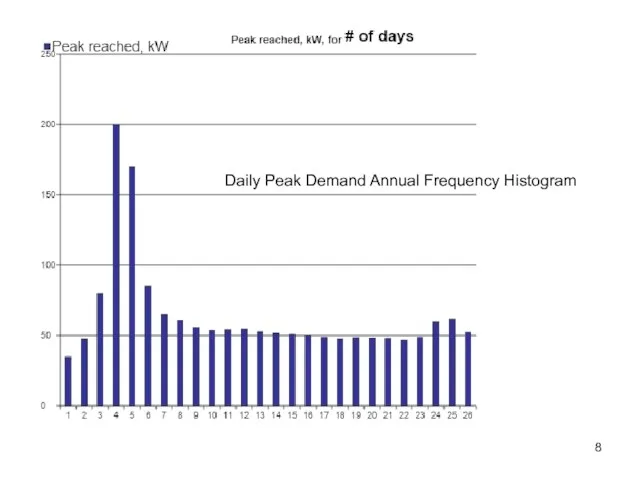
Daily Peak Demand Annual Frequency Histogram
Daily Peak Demand Annual Frequency Histogram
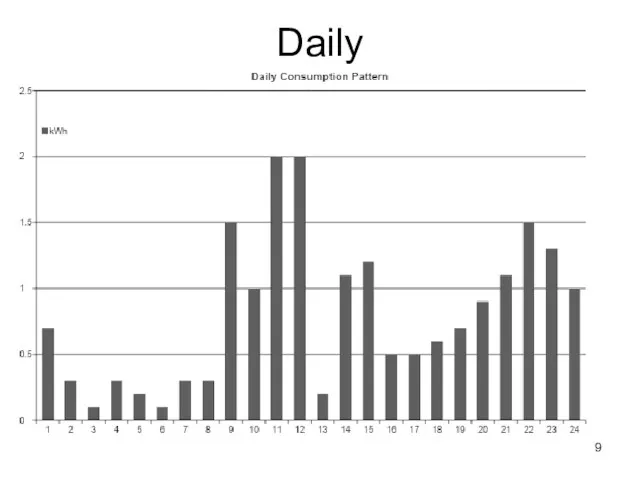
Daily
Daily
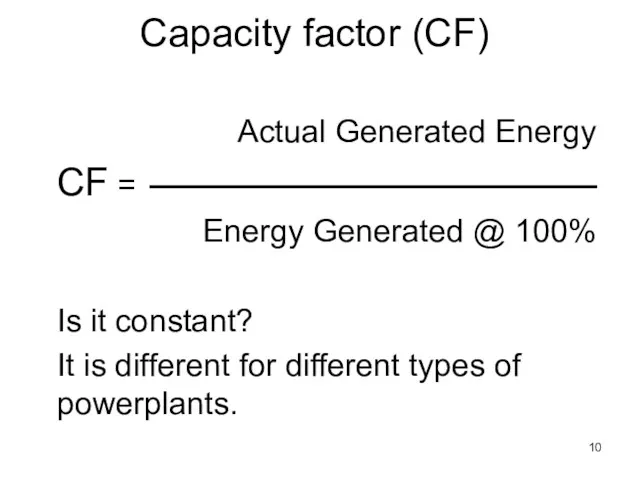
Capacity factor (CF)
Actual Generated Energy
CF =
Energy Generated @ 100%
Capacity factor (CF)
Actual Generated Energy
CF =
Energy Generated @ 100%
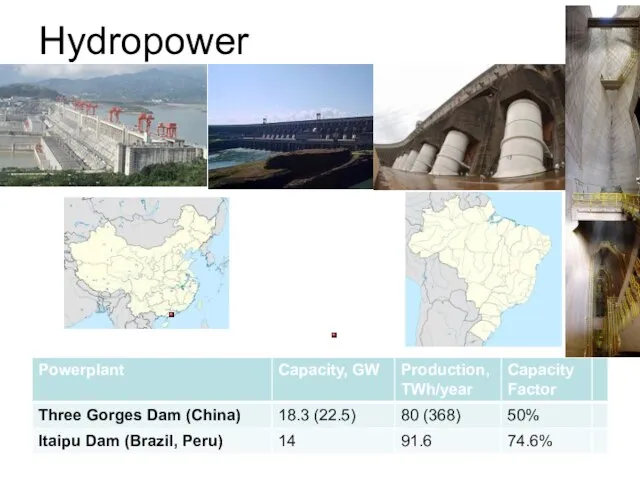
Hydropower
Hydropower
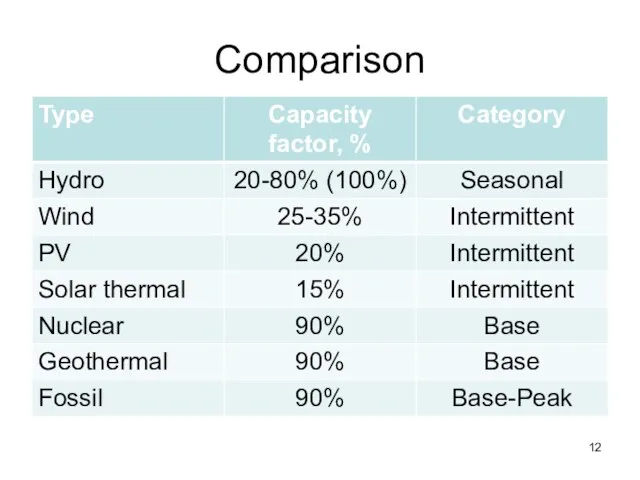
Comparison
Comparison

PV capacity factor
1kW of PV produces always annual amount kWhs equal
PV capacity factor
1kW of PV produces always annual amount kWhs equal
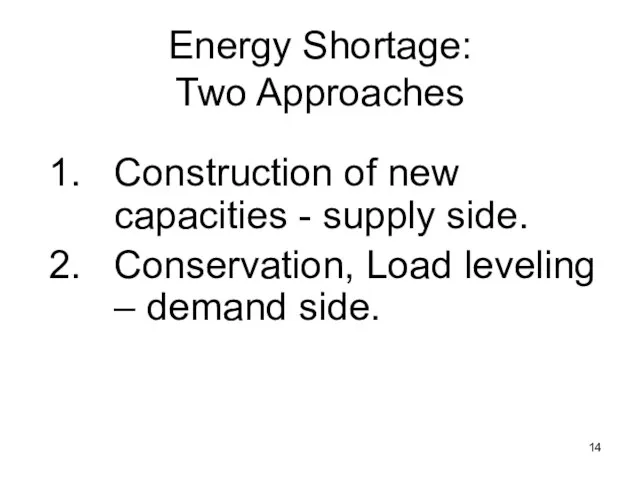
Energy Shortage:
Two Approaches
Construction of new capacities - supply side.
Conservation, Load
Energy Shortage:
Two Approaches
Construction of new capacities - supply side.
Conservation, Load
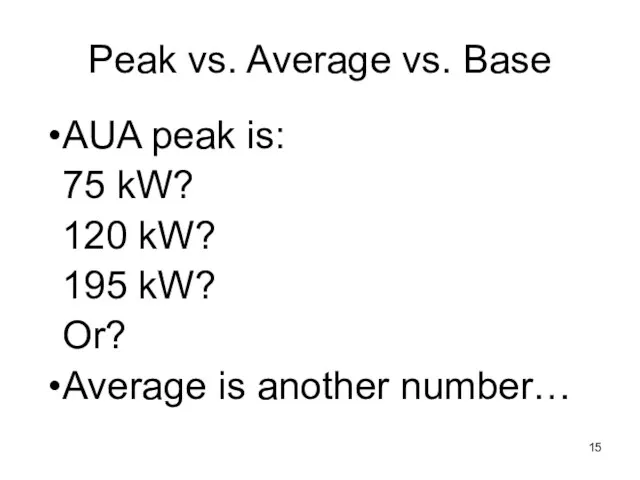
Peak vs. Average vs. Base
AUA peak is:
75 kW?
120 kW?
195
Peak vs. Average vs. Base
AUA peak is:
75 kW?
120 kW?
195
Countrywise
Peak
Average
Base
Countrywise
Peak
Average
Base
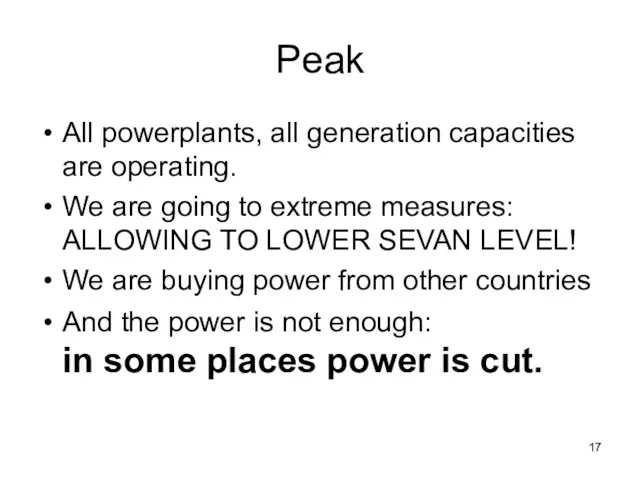
Peak
All powerplants, all generation capacities are operating.
We are going to extreme
Peak
All powerplants, all generation capacities are operating.
We are going to extreme
Base
Consumption never goes below certain amount
Metsamor NPP is providing the base
Base
Consumption never goes below certain amount
Metsamor NPP is providing the base
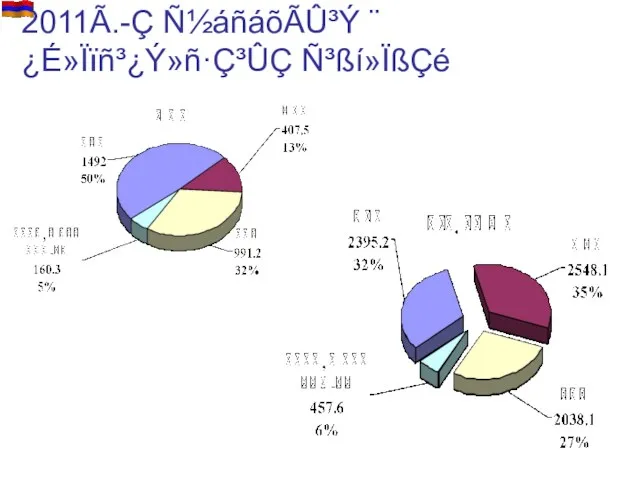
2011Ã.-Ç Ñ½áñáõÃÛ³Ý ¨
¿É»Ïïñ³¿Ý»ñ·Ç³ÛÇ Ñ³ßí»ÏßÇé
2011Ã.-Ç Ñ½áñáõÃÛ³Ý ¨
¿É»Ïïñ³¿Ý»ñ·Ç³ÛÇ Ñ³ßí»ÏßÇé
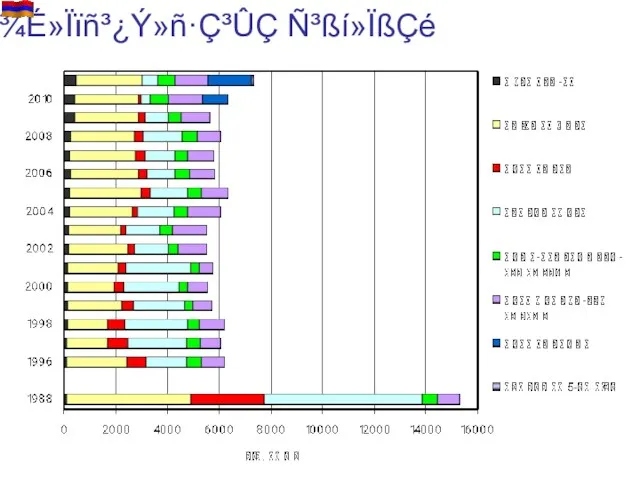
¾É»Ïïñ³¿Ý»ñ·Ç³ÛÇ Ñ³ßí»ÏßÇé
¾É»Ïïñ³¿Ý»ñ·Ç³ÛÇ Ñ³ßí»ÏßÇé
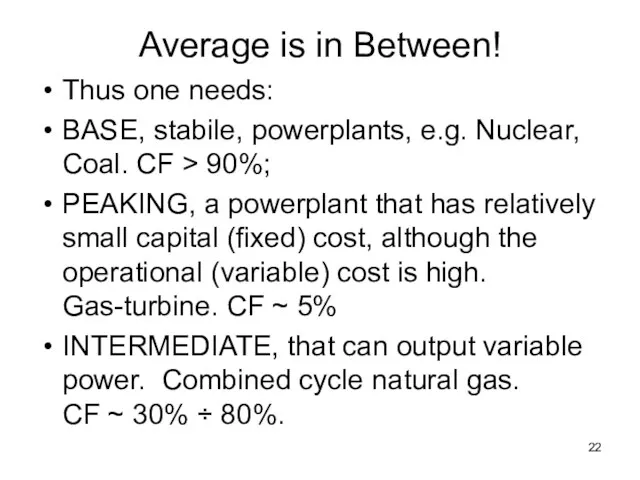
Average is in Between!
Thus one needs:
BASE, stabile, powerplants, e.g. Nuclear, Coal.
Average is in Between!
Thus one needs:
BASE, stabile, powerplants, e.g. Nuclear, Coal.
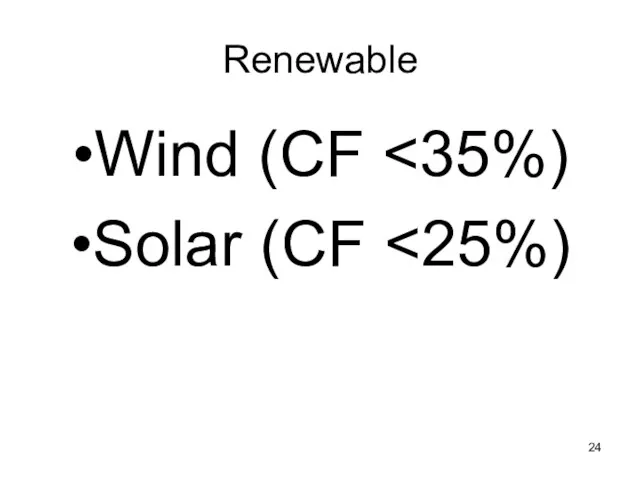
Renewable
Wind (CF <35%)
Solar (CF <25%)
Renewable
Wind (CF <35%)
Solar (CF <25%)

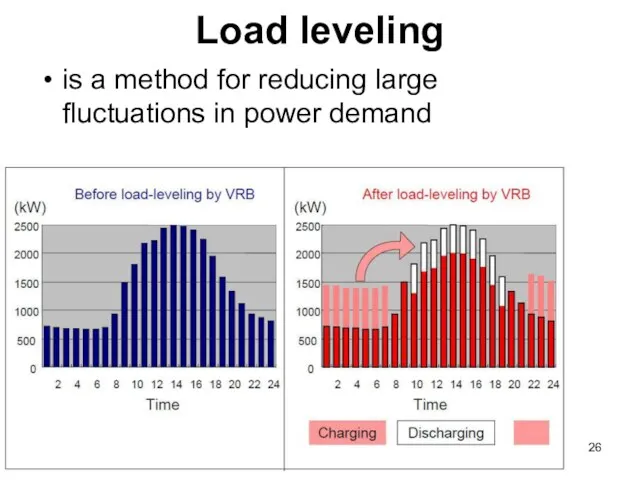
Load leveling
is a method for reducing large fluctuations in power
Load leveling
is a method for reducing large fluctuations in power
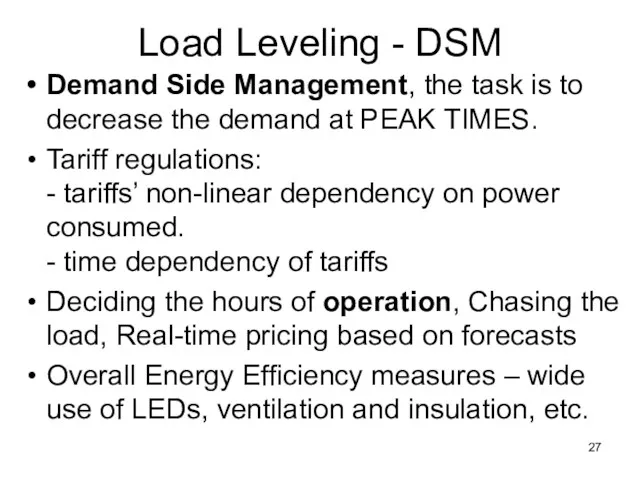
Load Leveling - DSM
Demand Side Management, the task is to decrease
Load Leveling - DSM
Demand Side Management, the task is to decrease
Elasticity
% Demand Change
E(d) =
% of Price Change
Elasticity
% Demand Change
E(d) =
% of Price Change
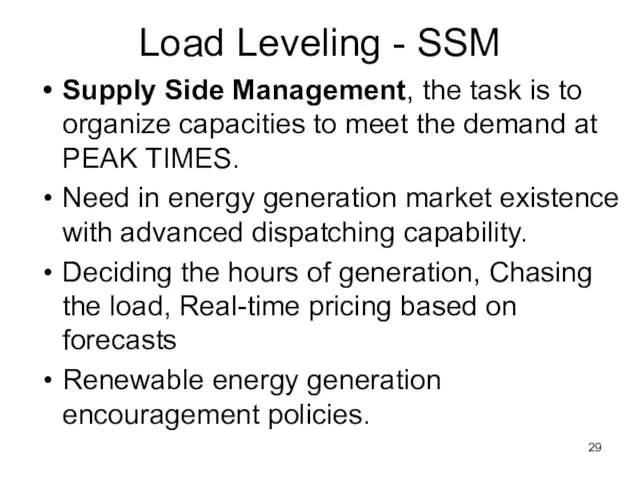
Load Leveling - SSM
Supply Side Management, the task is to organize
Load Leveling - SSM
Supply Side Management, the task is to organize
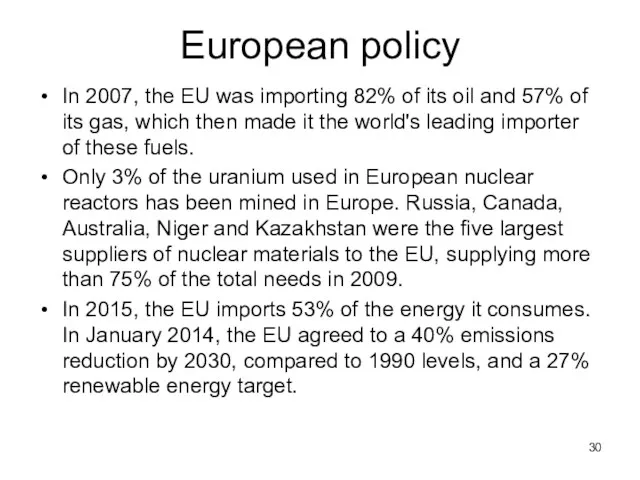
European policy
In 2007, the EU was importing 82% of its oil
European policy
In 2007, the EU was importing 82% of its oil
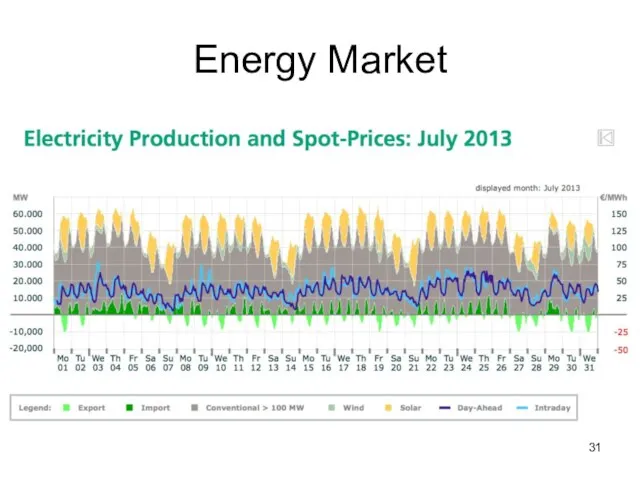
Energy Market
Energy Market
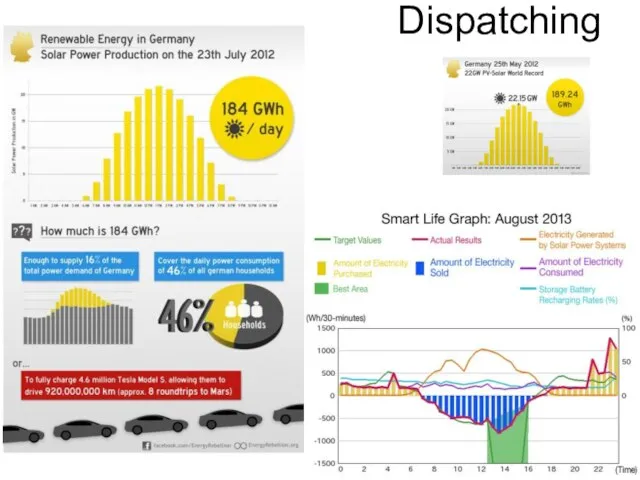
Dispatching
Dispatching

Storage
Hydro-Pump
Natural gas
Thermal
Hydrogen
Storage
Hydro-Pump
Natural gas
Thermal
Hydrogen
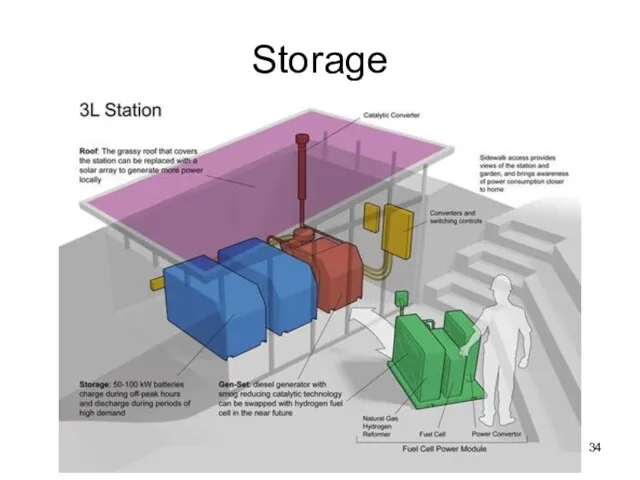
Storage
Storage
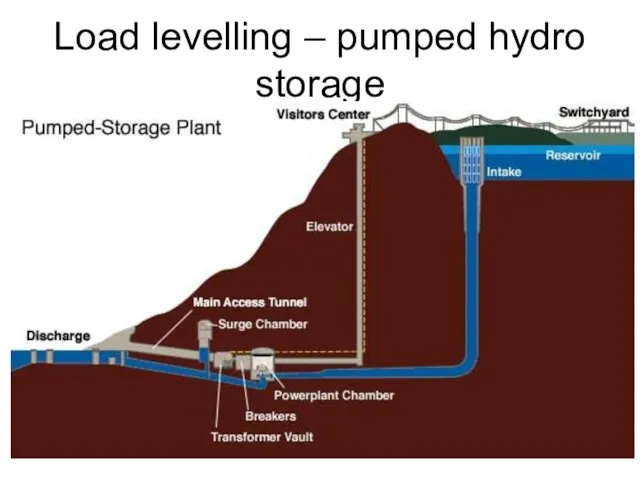
Load levelling – pumped hydro storage
Load levelling – pumped hydro storage
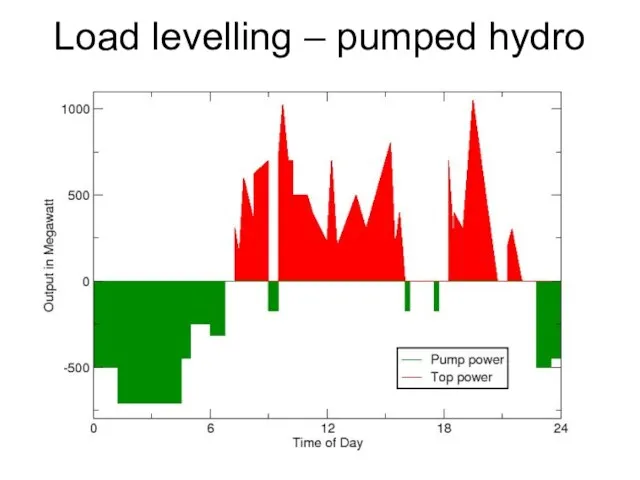
Load levelling – pumped hydro storage
Load levelling – pumped hydro storage
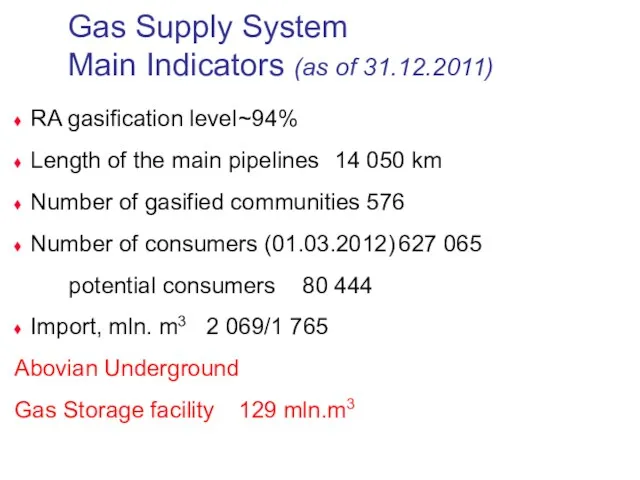
RA gasification level ~94%
Length of the main pipelines 14 050 km
Number of gasified
RA gasification level ~94%
Length of the main pipelines 14 050 km
Number of gasified
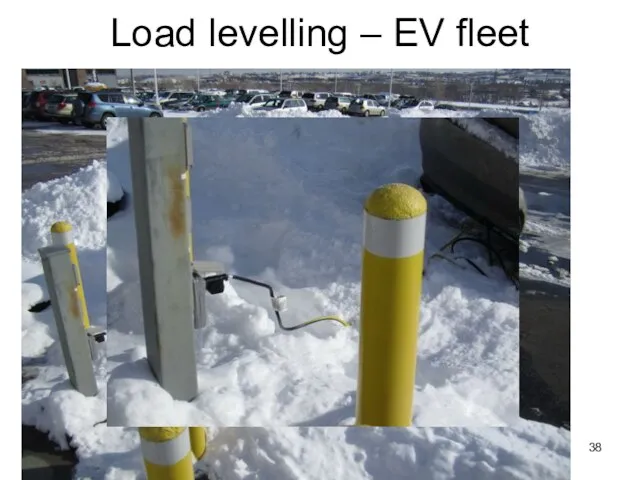
Load levelling – EV fleet
Load levelling – EV fleet
 Внешняя среда туристской организации
 Производительность труда. Тема 2.3
 Курс Экономика. Лекция 2. Базовые экономические понятия
 ТОО Досфарм
 Памятка Энергодобро – или как экономить элетричество
 Проблема бедности и отсталости
 Поняття “невиснажливого природокористування”. Досягнення балансу між основними сферами господарської діяльності
 Натуральное и товарное производство
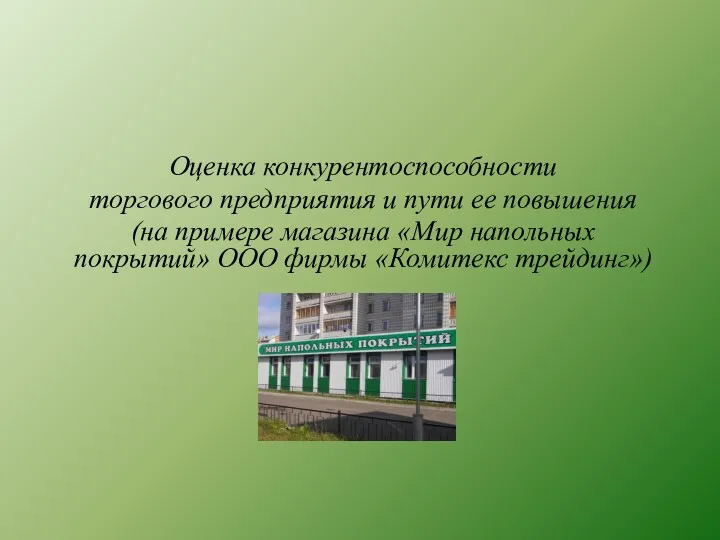 Оценка конкурентоспособности торгового предприятия и пути ее повышения
 Введение в экономику предприятия
 Прямое действие международных договоров системы ВТО (всемирная торговая организация) в России
 Характеристика Центрального федерального округа
 Методика формирования экономической стратегии
 Рынок, его механизмы и функции
 Экономический рост. Цикличность экономического развития
 Программа развития Копейского городского округа
 Инвестиционный паспорт Кологривского муниципального района Костромской области 2
 Инновационная экономика и технологическое предпринимательство
 Қазақстандағы жел энергиясының даму жолдары
 Государственно-частное партнерство: управление рисками
 Сұраныс пен ұсыныс теориясының негіздер
 Экономика и её основные участники (7 класс)
 Рыночный механизм. Основы анализа спроса и предложения
 Геополитическое и экономико-географическое положение России (ЭГП)
 Статистика цен и инфляции
 Личные доходы и проблемы их распределения
 Транснациональная компания и регионы современного мира
 Выступление генерального директора Россети Центр