- Consumers, producers and market efficiency

Содержание
- 2. 7 Consumers, Producers, and the Efficiency of Markets
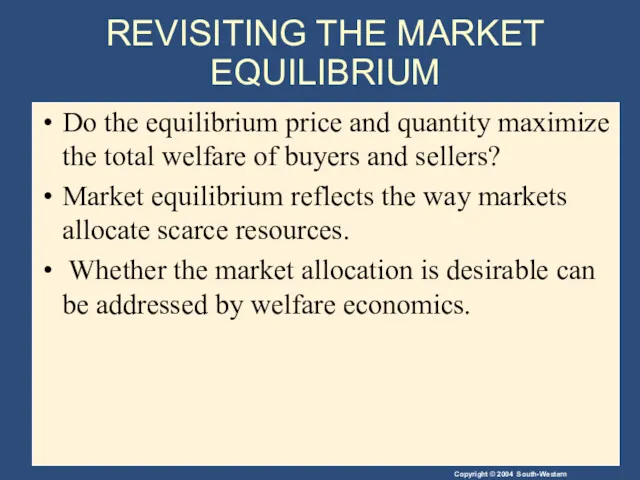
- 3. REVISITING THE MARKET EQUILIBRIUM Do the equilibrium price and quantity maximize the total welfare of buyers
- 4. Welfare Economics Welfare economics is the study of how the allocation of resources affects economic well-being.
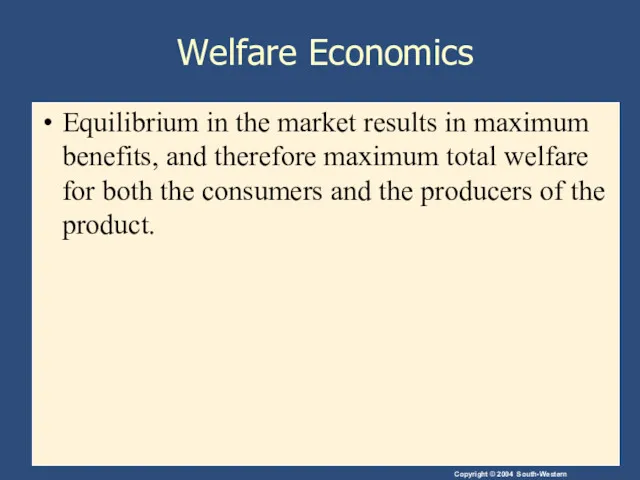
- 5. Welfare Economics Equilibrium in the market results in maximum benefits, and therefore maximum total welfare for
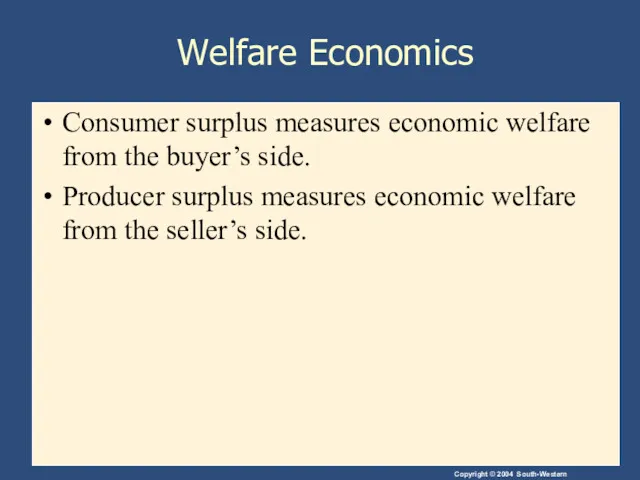
- 6. Welfare Economics Consumer surplus measures economic welfare from the buyer’s side. Producer surplus measures economic welfare
- 7. CONSUMER SURPLUS Willingness to pay is the maximum amount that a buyer will pay for a
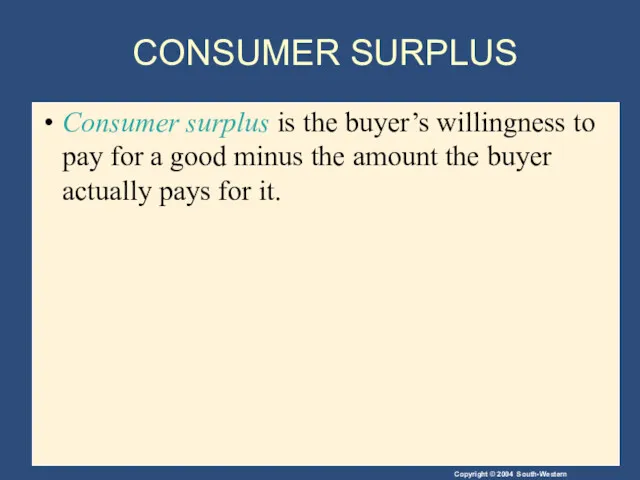
- 8. CONSUMER SURPLUS Consumer surplus is the buyer’s willingness to pay for a good minus the amount
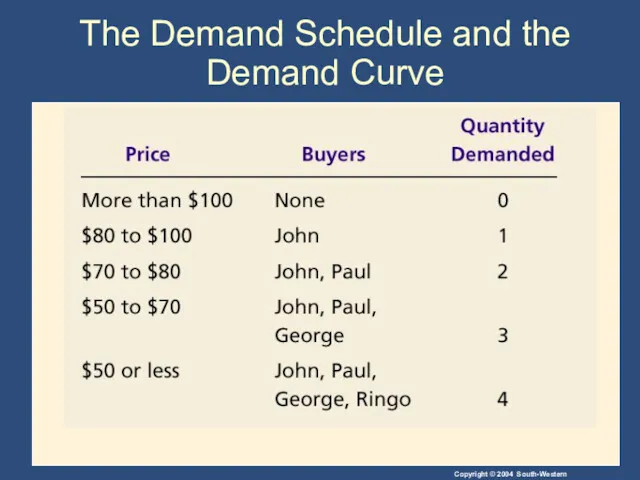
- 9. Table 1 Four Possible Buyers’ Willingness to Pay Copyright©2004 South-Western
- 10. CONSUMER SURPLUS The market demand curve depicts the various quantities that buyers would be willing and
- 11. The Demand Schedule and the Demand Curve
- 12. Figure 1 The Demand Schedule and the Demand Curve Copyright©2003 Southwestern/Thomson Learning Price of Album 0
- 13. Figure 2 Measuring Consumer Surplus with the Demand Curve Copyright©2003 Southwestern/Thomson Learning (a) Price = $80
- 14. Figure 2 Measuring Consumer Surplus with the Demand Curve Copyright©2003 Southwestern/Thomson Learning (b) Price = $70
- 15. Using the Demand Curve to Measure Consumer Surplus The area below the demand curve and above
- 16. Figure 3 How the Price Affects Consumer Surplus Copyright©2003 Southwestern/Thomson Learning Quantity (a) Consumer Surplus at
- 17. Figure 3 How the Price Affects Consumer Surplus Copyright©2003 Southwestern/Thomson Learning Quantity (b) Consumer Surplus at
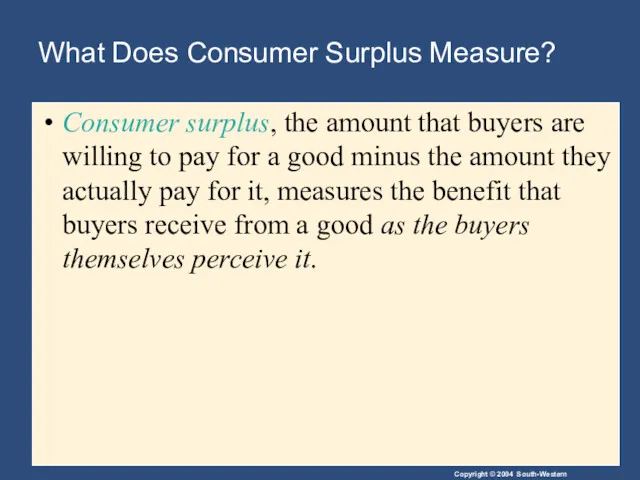
- 18. What Does Consumer Surplus Measure? Consumer surplus, the amount that buyers are willing to pay for
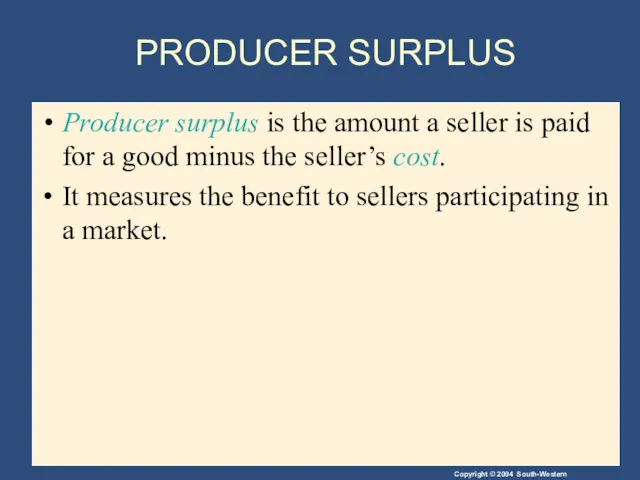
- 19. PRODUCER SURPLUS Producer surplus is the amount a seller is paid for a good minus the
- 20. Table 2 The Costs of Four Possible Sellers Copyright©2004 South-Western
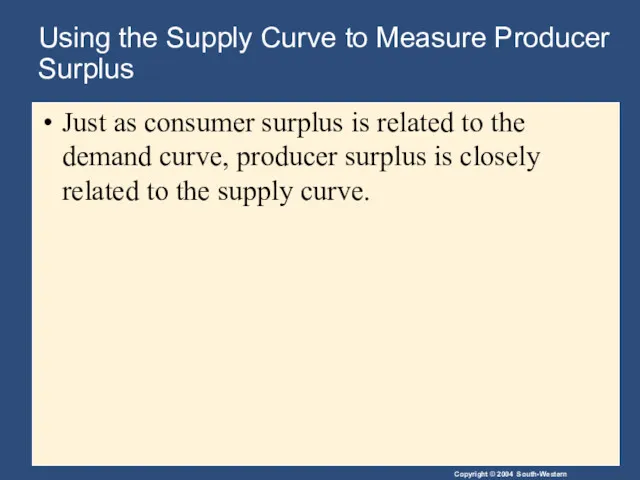
- 21. Using the Supply Curve to Measure Producer Surplus Just as consumer surplus is related to the
- 22. The Supply Schedule and the Supply Curve
- 23. Figure 4 The Supply Schedule and the Supply Curve
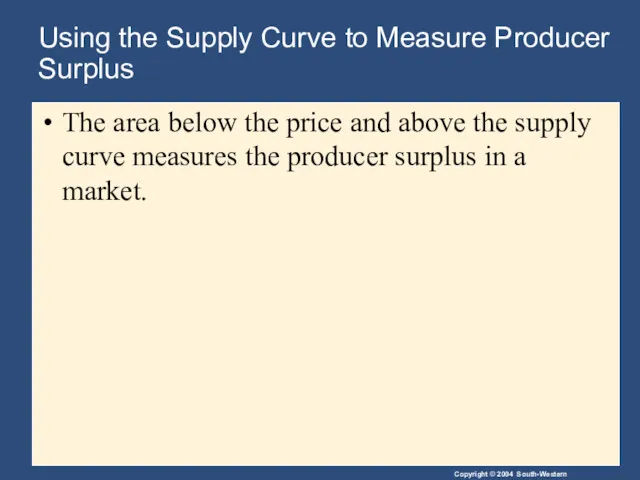
- 24. Using the Supply Curve to Measure Producer Surplus The area below the price and above the
- 25. Figure 5 Measuring Producer Surplus with the Supply Curve Copyright©2003 Southwestern/Thomson Learning Quantity of Houses Painted
- 26. Figure 5 Measuring Producer Surplus with the Supply Curve Copyright©2003 Southwestern/Thomson Learning Quantity of Houses Painted
- 27. Figure 6 How the Price Affects Producer Surplus Copyright©2003 Southwestern/Thomson Learning Quantity (a) Producer Surplus at
- 28. Figure 6 How the Price Affects Producer Surplus Copyright©2003 Southwestern/Thomson Learning Quantity (b) Producer Surplus at
- 29. MARKET EFFICIENCY Consumer surplus and producer surplus may be used to address the following question: Is
- 30. MARKET EFFICIENCY Consumer Surplus = Value to buyers – Amount paid by buyers and Producer Surplus
- 31. MARKET EFFICIENCY Total surplus = Consumer surplus + Producer surplus or Total surplus = Value to
- 32. MARKET EFFICIENCY Efficiency is the property of a resource allocation of maximizing the total surplus received
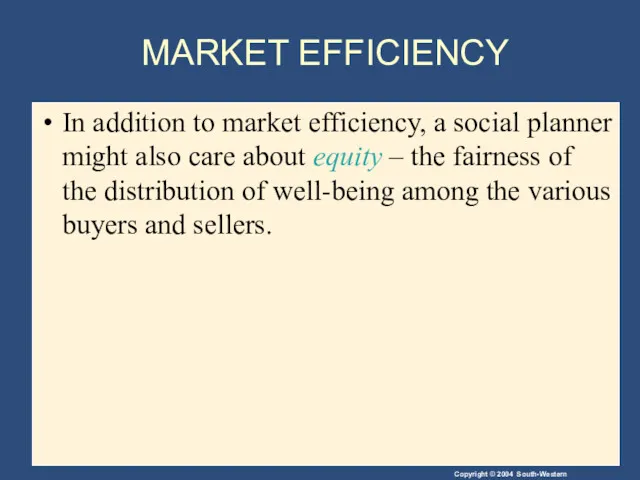
- 33. MARKET EFFICIENCY In addition to market efficiency, a social planner might also care about equity –
- 34. Figure 7 Consumer and Producer Surplus in the Market Equilibrium Copyright©2003 Southwestern/Thomson Learning Price 0 Quantity
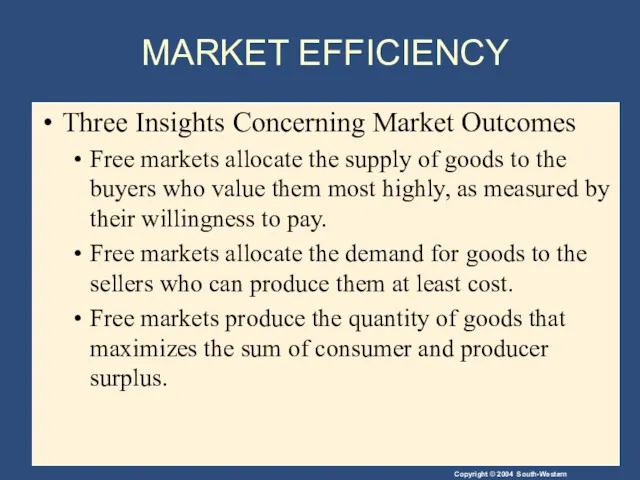
- 35. MARKET EFFICIENCY Three Insights Concerning Market Outcomes Free markets allocate the supply of goods to the
- 36. Figure 8 The Efficiency of the Equilibrium Quantity Copyright©2003 Southwestern/Thomson Learning Quantity Price 0
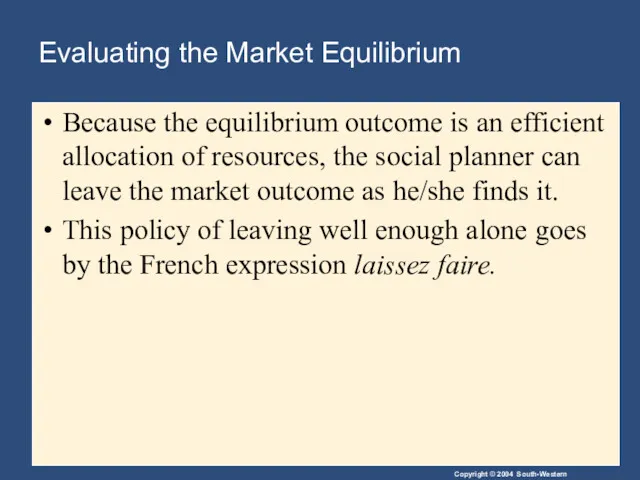
- 37. Evaluating the Market Equilibrium Because the equilibrium outcome is an efficient allocation of resources, the social
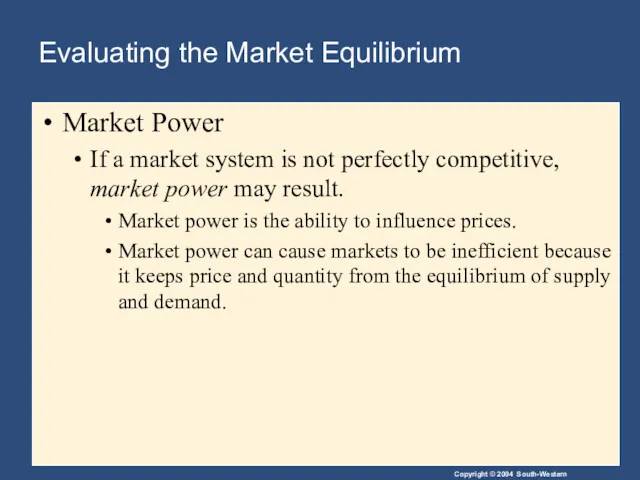
- 38. Evaluating the Market Equilibrium Market Power If a market system is not perfectly competitive, market power
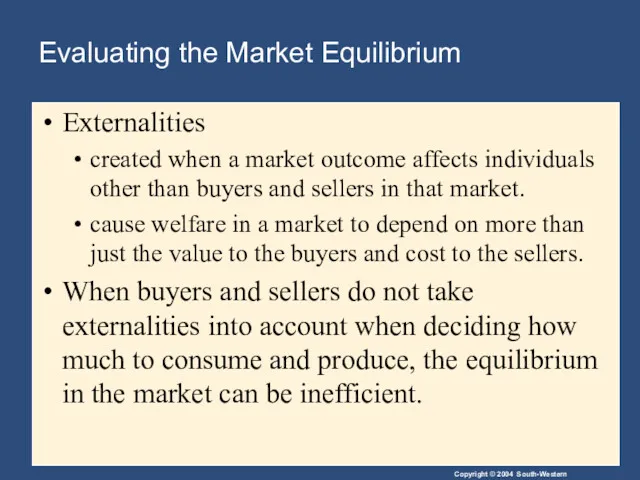
- 39. Evaluating the Market Equilibrium Externalities created when a market outcome affects individuals other than buyers and
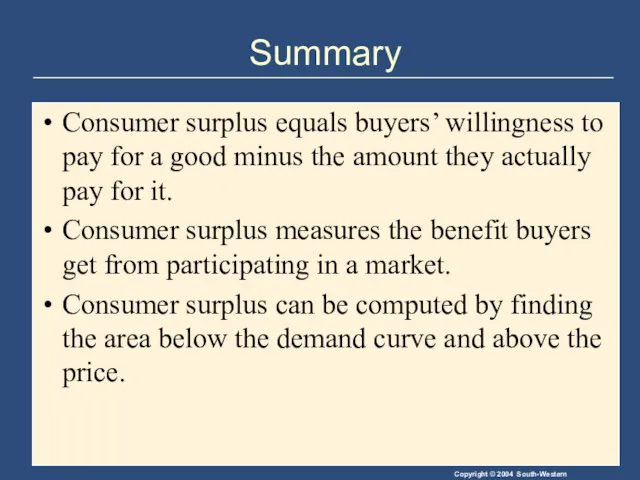
- 40. Summary Consumer surplus equals buyers’ willingness to pay for a good minus the amount they actually
- 41. Summary Producer surplus equals the amount sellers receive for their goods minus their costs of production.
- 42. Summary An allocation of resources that maximizes the sum of consumer and producer surplus is said
- 44. Скачать презентацию
7
Consumers, Producers, and the Efficiency of Markets
7
Consumers, Producers, and the Efficiency of Markets
REVISITING THE MARKET EQUILIBRIUM
Do the equilibrium price and quantity maximize the
REVISITING THE MARKET EQUILIBRIUM
Do the equilibrium price and quantity maximize the

Welfare Economics
Welfare economics is the study of how the allocation of
Welfare Economics
Welfare economics is the study of how the allocation of
Welfare Economics
Equilibrium in the market results in maximum benefits, and therefore
Welfare Economics
Equilibrium in the market results in maximum benefits, and therefore
Welfare Economics
Consumer surplus measures economic welfare from the buyer’s side.
Producer surplus
Welfare Economics
Consumer surplus measures economic welfare from the buyer’s side.
Producer surplus

CONSUMER SURPLUS
Willingness to pay is the maximum amount that a buyer
CONSUMER SURPLUS
Willingness to pay is the maximum amount that a buyer
CONSUMER SURPLUS
Consumer surplus is the buyer’s willingness to pay for a
CONSUMER SURPLUS
Consumer surplus is the buyer’s willingness to pay for a

Table 1 Four Possible Buyers’ Willingness to Pay
Copyright©2004 South-Western
Table 1 Four Possible Buyers’ Willingness to Pay
Copyright©2004 South-Western
CONSUMER SURPLUS
The market demand curve depicts the various quantities that buyers
CONSUMER SURPLUS
The market demand curve depicts the various quantities that buyers
The Demand Schedule and the Demand Curve
The Demand Schedule and the Demand Curve
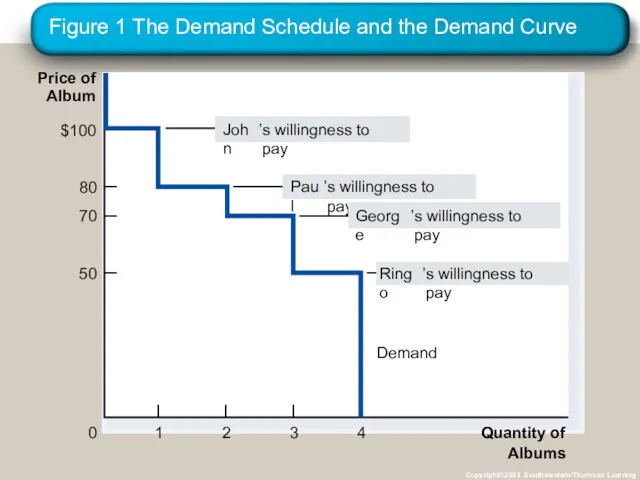
Figure 1 The Demand Schedule and the Demand Curve
Copyright©2003 Southwestern/Thomson Learning
Price
Figure 1 The Demand Schedule and the Demand Curve
Copyright©2003 Southwestern/Thomson Learning
Price
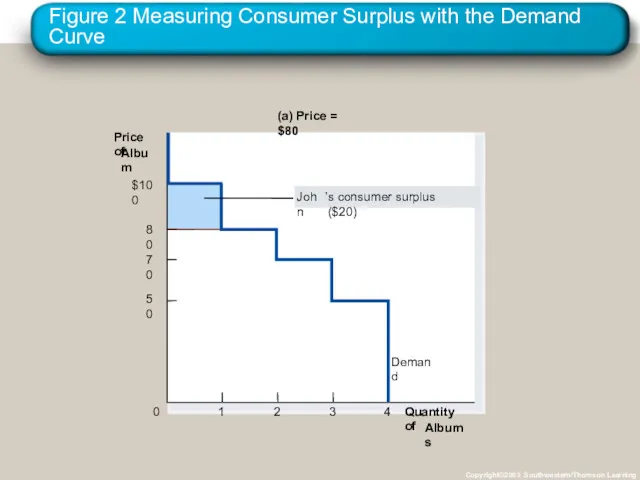
Figure 2 Measuring Consumer Surplus with the Demand Curve
Copyright©2003 Southwestern/Thomson Learning
(a)
Figure 2 Measuring Consumer Surplus with the Demand Curve
Copyright©2003 Southwestern/Thomson Learning
(a)
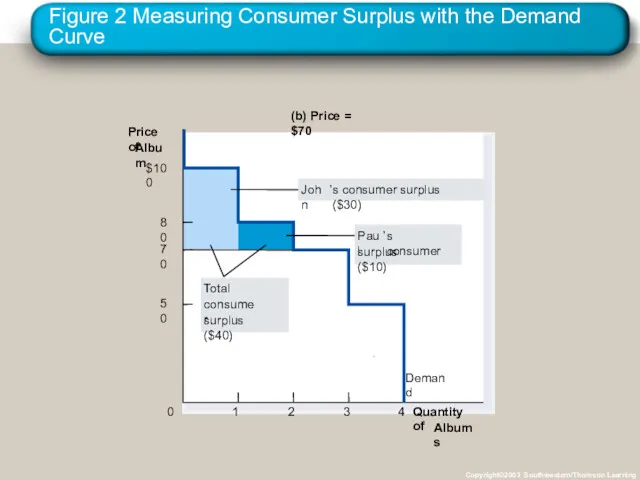
Figure 2 Measuring Consumer Surplus with the Demand Curve
Copyright©2003 Southwestern/Thomson Learning
(b)
Figure 2 Measuring Consumer Surplus with the Demand Curve
Copyright©2003 Southwestern/Thomson Learning
(b)
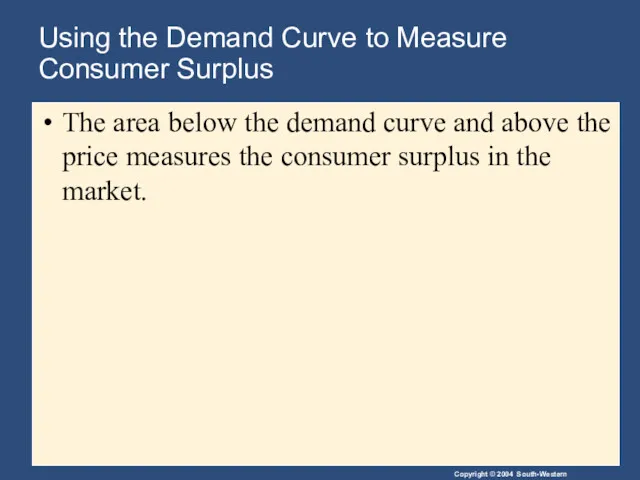
Using the Demand Curve to Measure Consumer Surplus
The area below the
Using the Demand Curve to Measure Consumer Surplus
The area below the
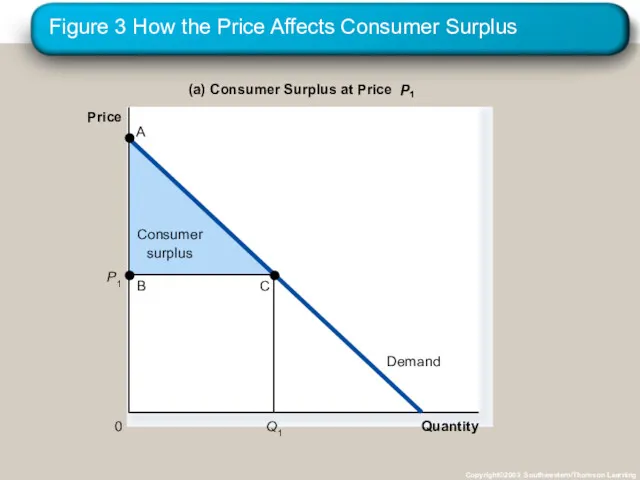
Figure 3 How the Price Affects Consumer Surplus
Copyright©2003 Southwestern/Thomson Learning
Quantity
(a) Consumer
Figure 3 How the Price Affects Consumer Surplus
Copyright©2003 Southwestern/Thomson Learning
Quantity
(a) Consumer
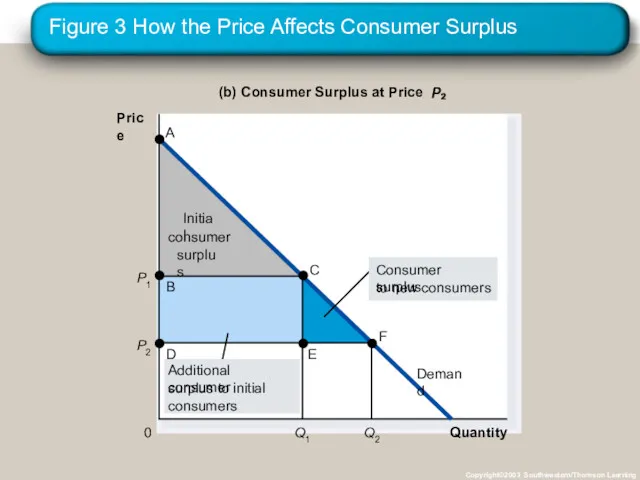
Figure 3 How the Price Affects Consumer Surplus
Copyright©2003 Southwestern/Thomson Learning
Quantity
(b) Consumer
Figure 3 How the Price Affects Consumer Surplus
Copyright©2003 Southwestern/Thomson Learning
Quantity
(b) Consumer
What Does Consumer Surplus Measure?
Consumer surplus, the amount that buyers are
What Does Consumer Surplus Measure?
Consumer surplus, the amount that buyers are
PRODUCER SURPLUS
Producer surplus is the amount a seller is paid for
PRODUCER SURPLUS
Producer surplus is the amount a seller is paid for
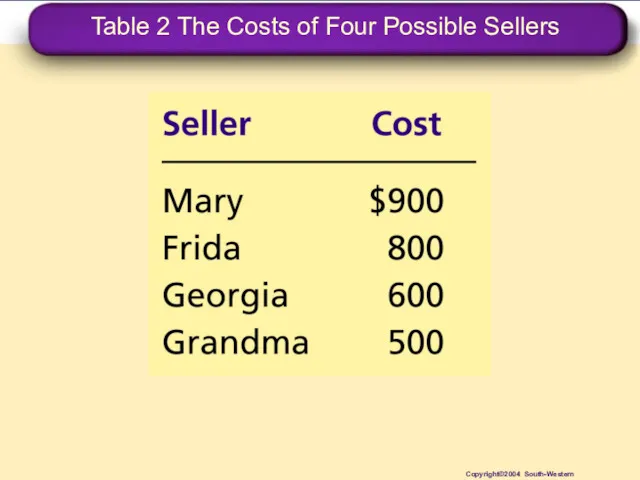
Table 2 The Costs of Four Possible Sellers
Copyright©2004 South-Western
Table 2 The Costs of Four Possible Sellers
Copyright©2004 South-Western
Using the Supply Curve to Measure Producer Surplus
Just as consumer surplus
Using the Supply Curve to Measure Producer Surplus
Just as consumer surplus
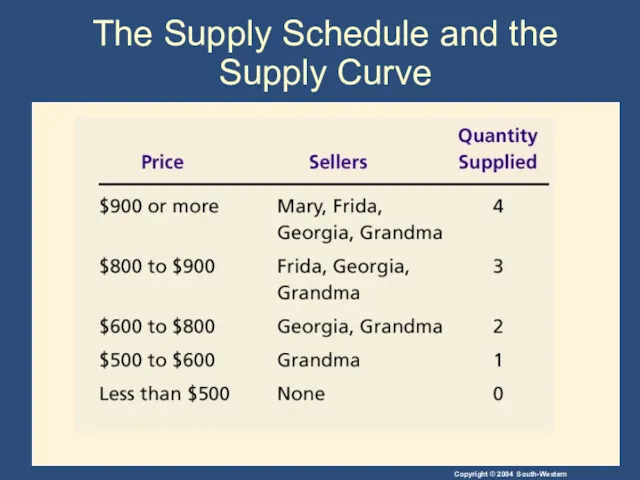
The Supply Schedule and the Supply Curve
The Supply Schedule and the Supply Curve
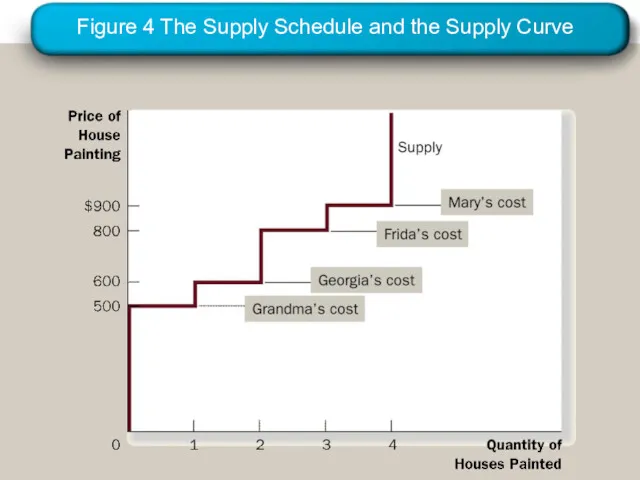
Figure 4 The Supply Schedule and the Supply Curve
Figure 4 The Supply Schedule and the Supply Curve
Using the Supply Curve to Measure Producer Surplus
The area below the
Using the Supply Curve to Measure Producer Surplus
The area below the
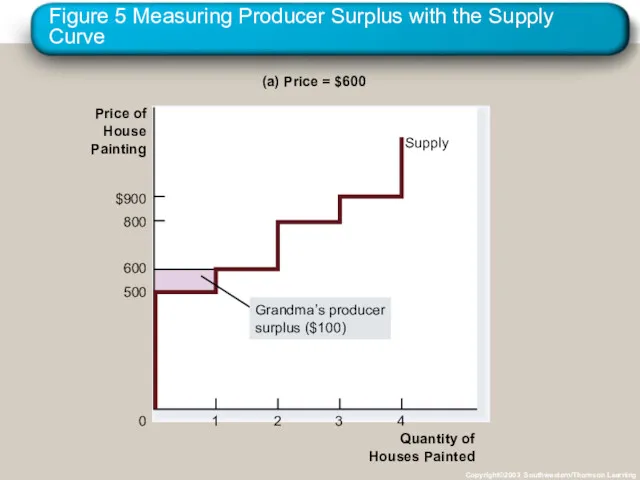
Figure 5 Measuring Producer Surplus with the Supply Curve
Copyright©2003 Southwestern/Thomson Learning
Quantity
Figure 5 Measuring Producer Surplus with the Supply Curve
Copyright©2003 Southwestern/Thomson Learning
Quantity
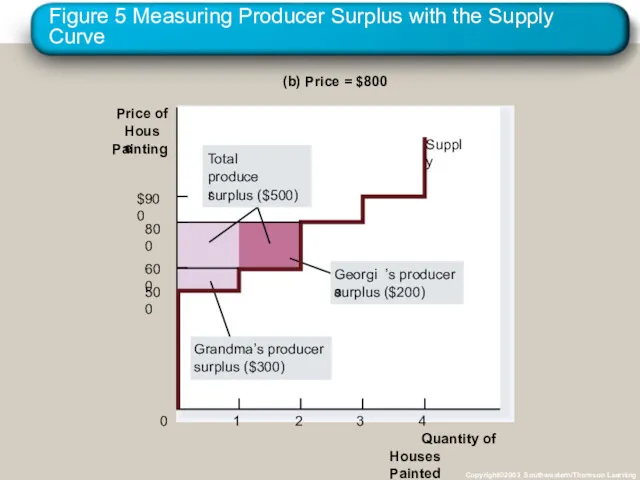
Figure 5 Measuring Producer Surplus with the Supply Curve
Copyright©2003 Southwestern/Thomson Learning
Quantity
Figure 5 Measuring Producer Surplus with the Supply Curve
Copyright©2003 Southwestern/Thomson Learning
Quantity
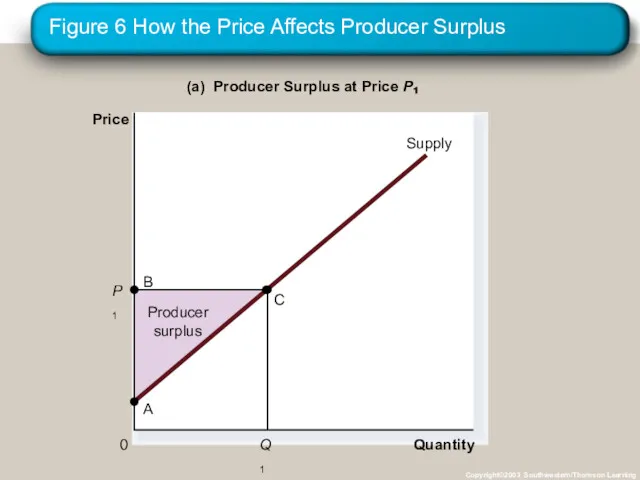
Figure 6 How the Price Affects Producer Surplus
Copyright©2003 Southwestern/Thomson Learning
Quantity
(a) Producer
Figure 6 How the Price Affects Producer Surplus
Copyright©2003 Southwestern/Thomson Learning
Quantity
(a) Producer
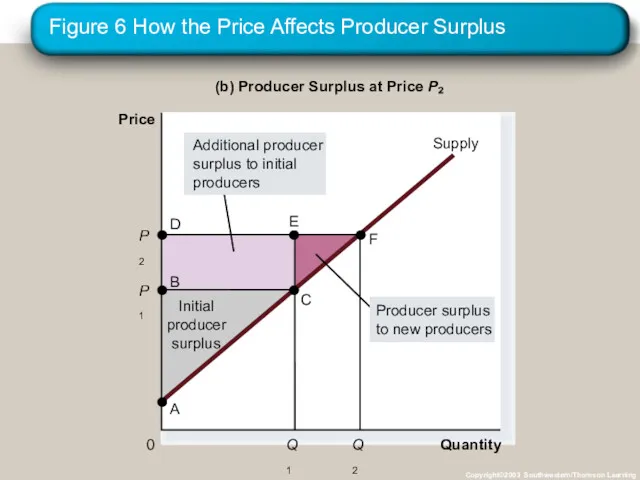
Figure 6 How the Price Affects Producer Surplus
Copyright©2003 Southwestern/Thomson Learning
Quantity
(b) Producer
Figure 6 How the Price Affects Producer Surplus
Copyright©2003 Southwestern/Thomson Learning
Quantity
(b) Producer
MARKET EFFICIENCY
Consumer surplus and producer surplus may be used to address
MARKET EFFICIENCY
Consumer surplus and producer surplus may be used to address
MARKET EFFICIENCY
Consumer Surplus
= Value to buyers – Amount paid by
MARKET EFFICIENCY
Consumer Surplus
= Value to buyers – Amount paid by
MARKET EFFICIENCY
Total surplus
= Consumer surplus + Producer surplus
or
Total surplus
=
MARKET EFFICIENCY
Total surplus
= Consumer surplus + Producer surplus
or
Total surplus
=
MARKET EFFICIENCY
Efficiency is the property of a resource allocation of maximizing
MARKET EFFICIENCY
Efficiency is the property of a resource allocation of maximizing
MARKET EFFICIENCY
In addition to market efficiency, a social planner might also
MARKET EFFICIENCY
In addition to market efficiency, a social planner might also
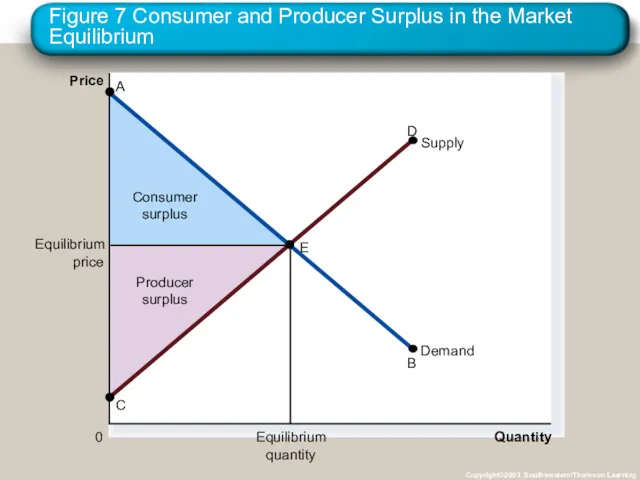
Figure 7 Consumer and Producer Surplus in the Market Equilibrium
Copyright©2003 Southwestern/Thomson
Figure 7 Consumer and Producer Surplus in the Market Equilibrium
Copyright©2003 Southwestern/Thomson
MARKET EFFICIENCY
Three Insights Concerning Market Outcomes
Free markets allocate the supply
MARKET EFFICIENCY
Three Insights Concerning Market Outcomes
Free markets allocate the supply
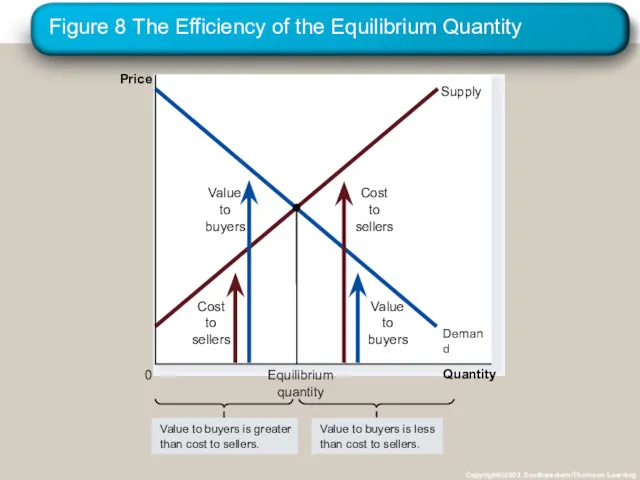
Figure 8 The Efficiency of the Equilibrium Quantity
Copyright©2003 Southwestern/Thomson Learning
Quantity
Price
0
Figure 8 The Efficiency of the Equilibrium Quantity
Copyright©2003 Southwestern/Thomson Learning
Quantity
Price
0
Evaluating the Market Equilibrium
Because the equilibrium outcome is an efficient allocation
Evaluating the Market Equilibrium
Because the equilibrium outcome is an efficient allocation
Evaluating the Market Equilibrium
Market Power
If a market system is not
Evaluating the Market Equilibrium
Market Power
If a market system is not
Evaluating the Market Equilibrium
Externalities
created when a market outcome affects individuals
Evaluating the Market Equilibrium
Externalities
created when a market outcome affects individuals
Summary
Consumer surplus equals buyers’ willingness to pay for a good minus
Summary
Consumer surplus equals buyers’ willingness to pay for a good minus
Summary
Producer surplus equals the amount sellers receive for their goods minus
Summary
Producer surplus equals the amount sellers receive for their goods minus
Summary
An allocation of resources that maximizes the sum of consumer and
Summary
An allocation of resources that maximizes the sum of consumer and
 Анализ формирования и использования прибыли на предприятиях торговли ООО Спортмастер, г. Иваново
 Государство и рынок. Модуль 6. Часть 2
 Банкротство. Коэффициенты ликвидности, рентабельности. Финансовый рычаг
 Model United Nations. Writing the Delegate’s opening speech
 Бизнес – план создания спорт - бара
 Повышение конкурентоспособности предприятия
 Контролирующие иностранные компании и контролирующие лица
 Энергетика и окружающая среда. Общие проблемы производства энергии
 Великая депрессия в США
 Стратегия развития АО СПК Shymkent на 2019–2023 годы
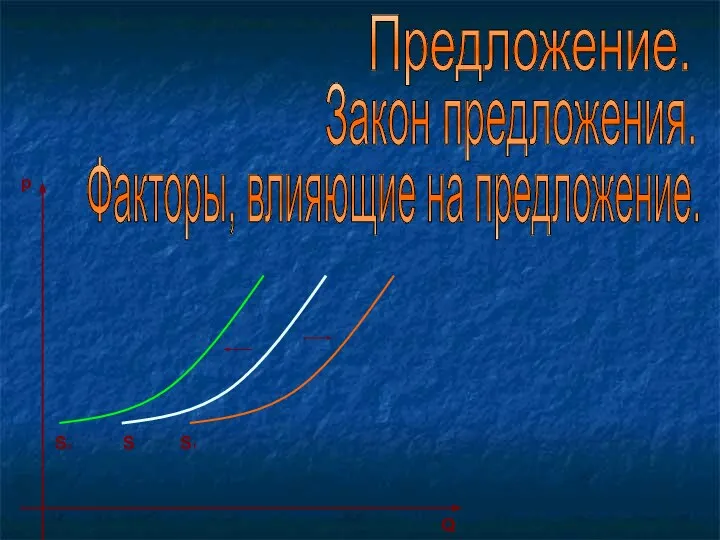 Предложение. Закон предложения. Факторы, влияющие на предложение
 Организация производства на предприятии
 Вторинний та третинний сектор економіки
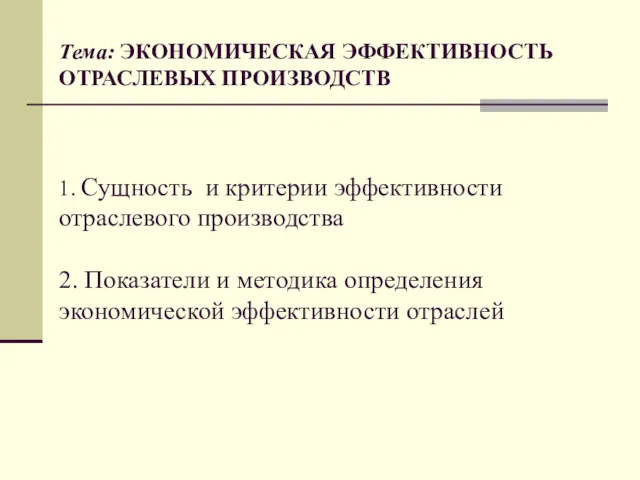 Экономическая эффективность отраслевых производств
 Методы оценки стоимости НИОКР на основе потребительской полезности
 Особые экономические зоны как инструмент оптимизации налоговой нагрузки современного предприятия
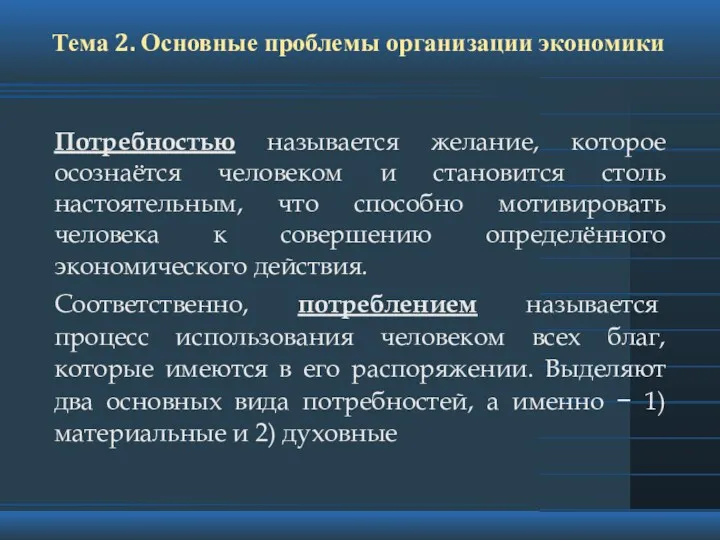 Основные проблемы организации экономики. Тема 2
 Безработица. Занятие 10
 Основы теории потребления
 Макроэкономическое регулирование. Сущность государственного регулирования рыночной экономики
 Методическая разработка учебной темы Экономические системы на различных ступенях экономического образования школьников
 Основные направления развития экономики Узбекистана для привлечения иностранных инвесторов
 Совокупный спрос. Причины отрицательного наклона кривой совокупного спроса. Неценовые факторы совокупного спроса
 Макроекономічні показники в системі національних рахунків
 РФ в 2000–2012 годах: основные тенденции социально-экономического и общественно-политического развития на современном этапе
 Макроэкономическая динамика: экономические циклы
 Трудовые, финансовые и материальные ресурсы здравоохранения и пути повышения эффективности их использования в экономике
 Экономические основы политического механизма в общественном секторе. Тема 5