- Financial Economy

Содержание
- 2. Course Logic Financial Economics Stylized Facts & Random Walks Theory Birth of Modern Portfolio Theory CAPM,
- 3. Buzzwords and concepts Asset class Super class Business cycle Investment style Active/Passive Long/Short Value strategy Growth
- 4. The Plan What is asset class Should we add new asset class to existing asset mix?
- 5. Asset classes: examples Cash and money market instruments Equities Debts Alternatives Real Estate Commodities Gold Hedge
- 6. Super Asset Classes capital assets: claim on the future cash flows of an enterprise provide a
- 7. Bonds and Equities Bonds and equities are dominating as investment assets Equities account for biggest part
- 8. INCLUSION OF NEW ASSET CLASS Part II.1
- 9. Expression for deciding whether to include new asset class in asset mix If this equation holds,
- 10. Tangency portfolio Notice that the tangency portfolio T is optimal in the sense that it has
- 11. ASSET CLASSES AND BUSINESS CYCLE Part II.2
- 12. Attractive Investment Opportunities in Various Business Cycle Stages
- 13. Key variables to watch cycle Confidence: business, consumer GDP Inflation Unemployment Output gap Treasuries spread Central
- 14. EQUITIES: INTRO Part II.3
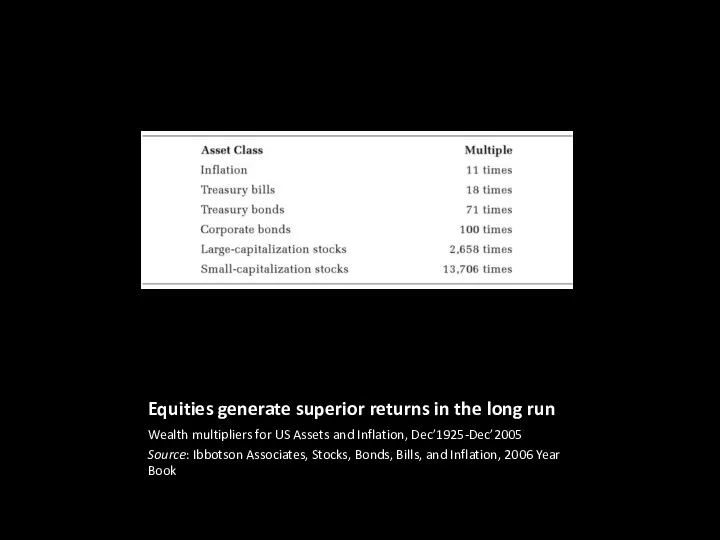
- 15. Equities generate superior returns in the long run Wealth multipliers for US Assets and Inflation, Dec’1925-Dec’2005
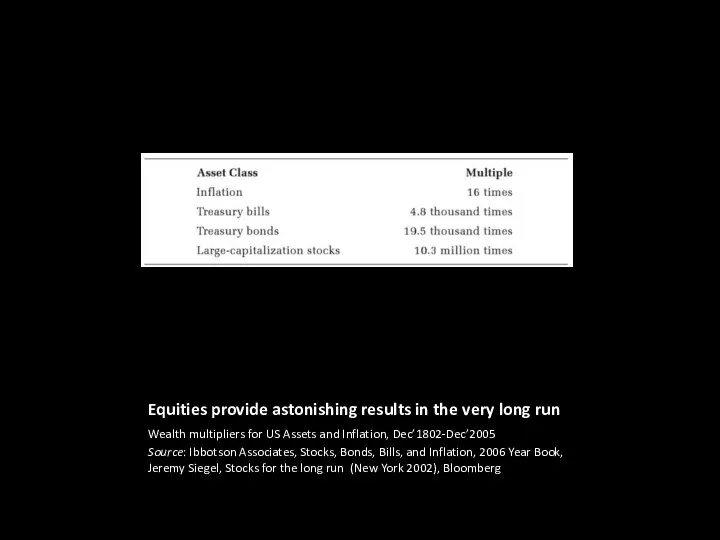
- 16. Equities provide astonishing results in the very long run Wealth multipliers for US Assets and Inflation,
- 17. Exponential growth of $1 Invested in U.S. Stocks and Bonds on Dec. 31, 1870 Sources: Stocks:
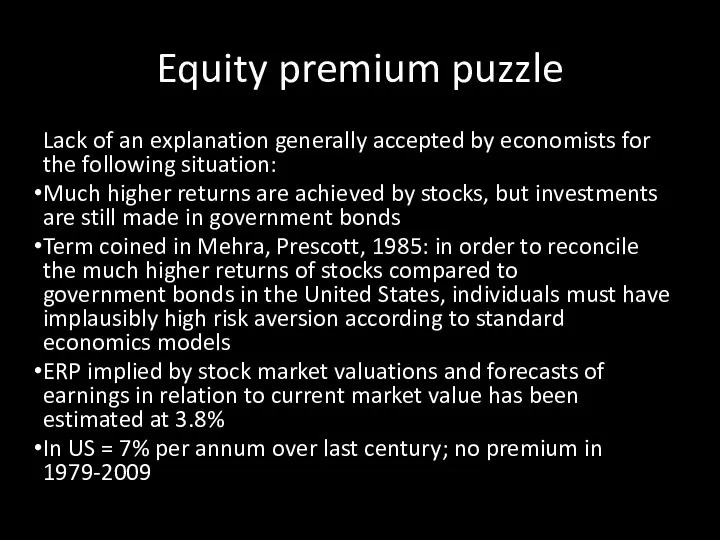
- 18. Equity premium puzzle Lack of an explanation generally accepted by economists for the following situation: Much
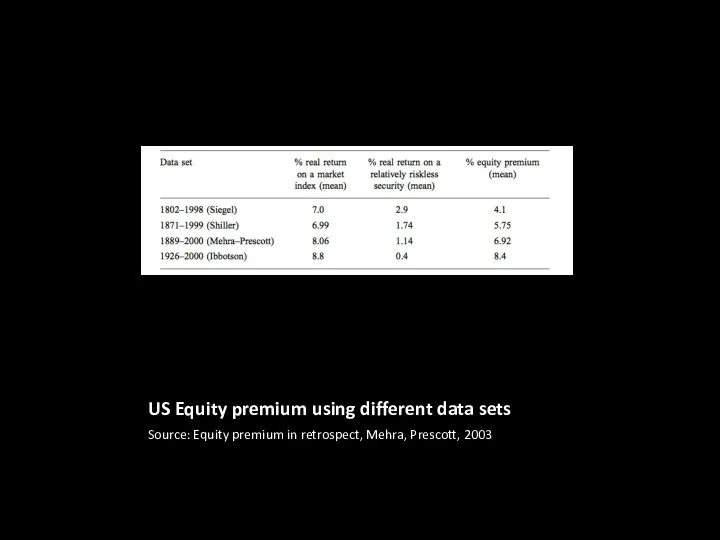
- 19. US Equity premium using different data sets Source: Equity premium in retrospect, Mehra, Prescott, 2003
- 20. Evolution of the Required Equity Premium (REP) used or recommended in 150 finance and valuation textbooks
- 21. Moving average (last 5 years) of the REP used or recommended in 150 finance and valuation
- 22. The term EP is used to designate 4 different concepts Historical equity premium (HEP): historical differential
- 23. Market Risk Premium for the USA used in 2011 Source: Fernández, 2012
- 24. Are equities really profitable? Survivorship bias: did you know in advance that UK and US would
- 25. Share of equities in market capitalization of investment universe consisting 7 major asset classes Source: Mikaelyan
- 26. Equity Allocations for Institutional Investors Source: Greenwich Associates, 2003. For many investors hierarchy of questions when
- 27. Equities as instrument in PM - inflation hedge — an asset is IH if its returns
- 28. Approaches to Equity Inv. passive management: after costs the return on the average actively managed dollar
- 29. Definitions active return — portfolio's return in excess of the benchmark portfolio active risk — risk
- 30. Returns succesfull active manager will have expected active return of 2+%, but tracking error is likely
- 31. Example The table below shows the active return of an equity portfolio. Calculate the portfolio’s tracking
- 32. Solution
- 33. Passive Equity Investing simple indexing types of indices: price weighted, value weighted, equal weighted major indices
- 34. What makes a good index? It must provide some useful information about the market that is
- 35. Why make an index? considerable research needed, what’s the benefit? some sell-side institutions develop indices as
- 36. Weighting shemes Price-weighted Volume-weighted Cap-weighted / modified cap (MICEX) Free-float weighted Equal (dollar) – weighted /
- 37. Types of indices Broad market Total market Cap range Sector indices Geographic Markets: advanced/emerging/frontier Exchange Concept
- 38. Implementing an indexing strategy Indexed separate or pooled accounts Low cost index mutual funds widely accessible
- 39. 3 methods of indexation full replication Every index security is held with approximately the same weight
- 40. Active Equity Investing equity styles Value vs. Growth vs. Market oriented Style index
- 41. Main types of active strategies Value, value investors are more concerned about buying a stock that
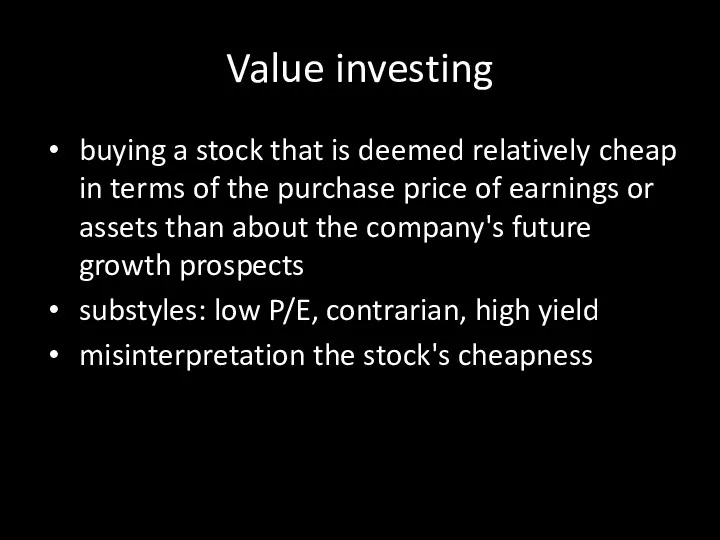
- 42. Value investing buying a stock that is deemed relatively cheap in terms of the purchase price
- 43. P/E ratios as a predictor of twenty-year returns Source: Robert Shiller, Irrational Exhuberance The horizontal axis
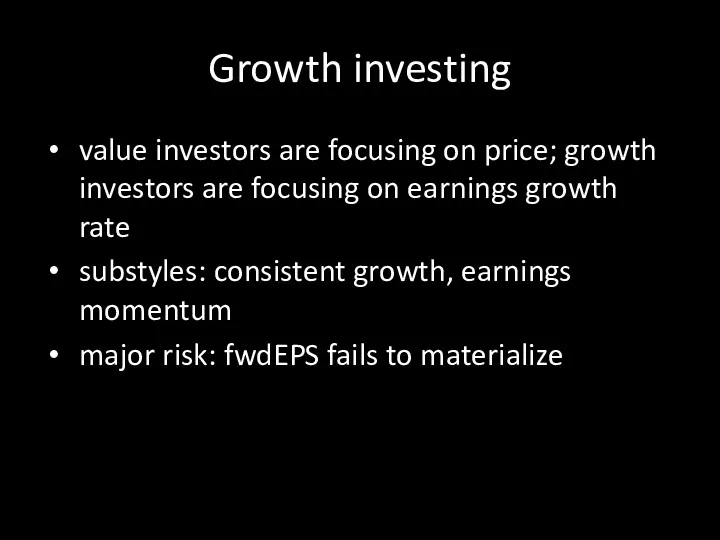
- 44. Growth investing value investors are focusing on price; growth investors are focusing on earnings growth rate
- 45. Morningstar Equity Style Box
- 46. Risk/return of Morningstar style indices 2003-2010 Source: Morningstar What’s the sense in Large Core and Value?
- 47. Flaws of indexation Several researchers criticize fundamental indexation on both theoretical and empirical grounds Collared weighting
- 48. Risks of value/growth The main risk for a value investor is the potential for misinterpreting a
- 49. Long/short strategies long-only strategy can capture one overall alpha. in long–short strategy the value added can
- 50. EQUITIES: RETURN MODELS Part II.4
- 51. Models of equity return Historical Estimates premium approach, DCF, Gordon growth, Grinold-Kroner, Singer-Terhaar, Pastor-Stambaugh Barra model
- 52. Historical estimates: geometric mean focus of MVO (Markowiyz, 1952): tradeoff between StdDev and expected return many
- 53. Geometric mean and StdDev
- 54. Example CMA for 5 asset classes Isogeometric mean curves
- 55. DCF You all know it very well, don’t you?
- 56. Historical Premium Approach
- 57. Supply-side premium
- 58. Gordon Model
- 59. Growth rate Expected Real GDP + expected inflation Sometimes: + excess corporate growth (some sectors)
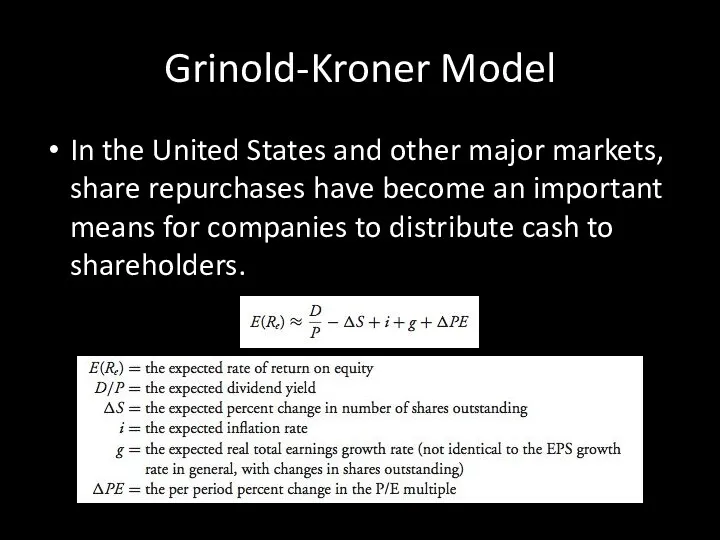
- 60. Grinold-Kroner Model In the United States and other major markets, share repurchases have become an important
- 61. Example
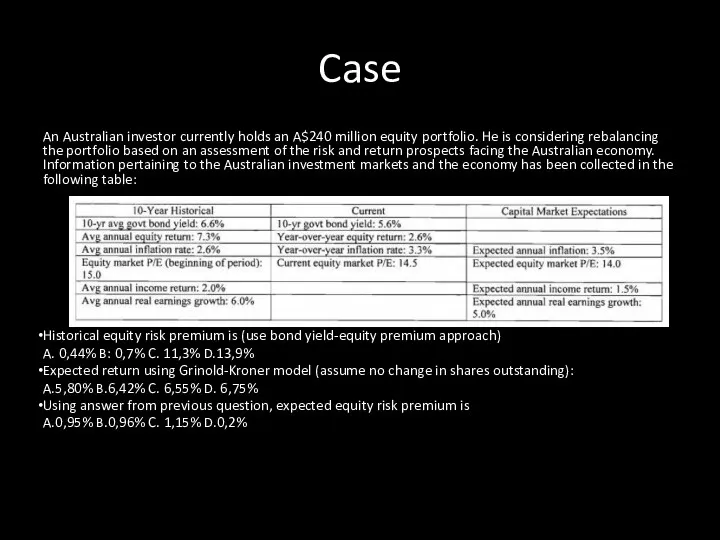
- 62. Case An Australian investor currently holds an A$240 million equity portfolio. He is considering rebalancing the
- 63. Answer
- 64. Singer-Terhaar’s ICAPM “ICAPM minus imperfections” Market Sharpe Ratio? 0.28-0.3
- 65. Case Suppose that an investor predicts that the standard deviation of Canadian bonds will be 7.0
- 66. ICAPM drawbacks the ICAPM assumes perfect markets (markets without any frictional costs, where all assets trade
- 67. Adjustments to ICAPM Most markets lie between the extremes of perfect market integration and complete market
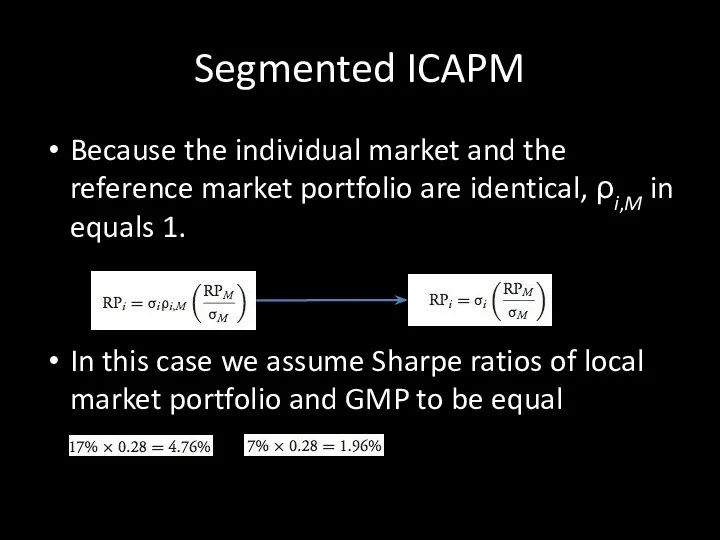
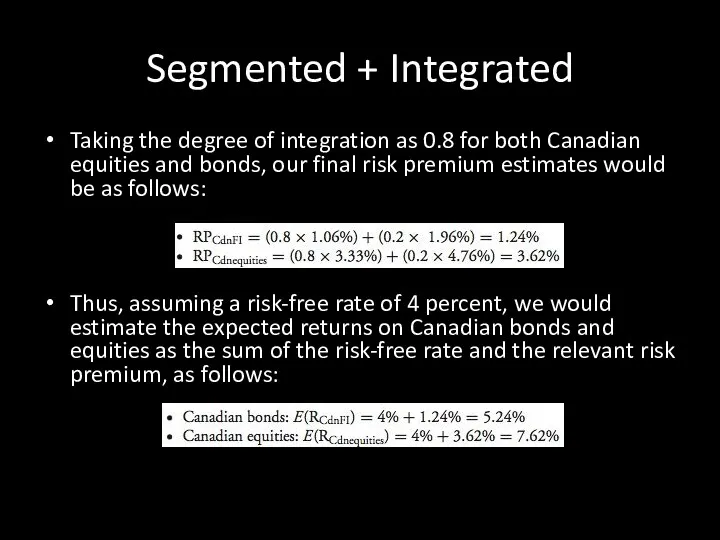
- 68. Segmented ICAPM Because the individual market and the reference market portfolio are identical, ρi,M in equals
- 69. Segmented + Integrated Taking the degree of integration as 0.8 for both Canadian equities and bonds,
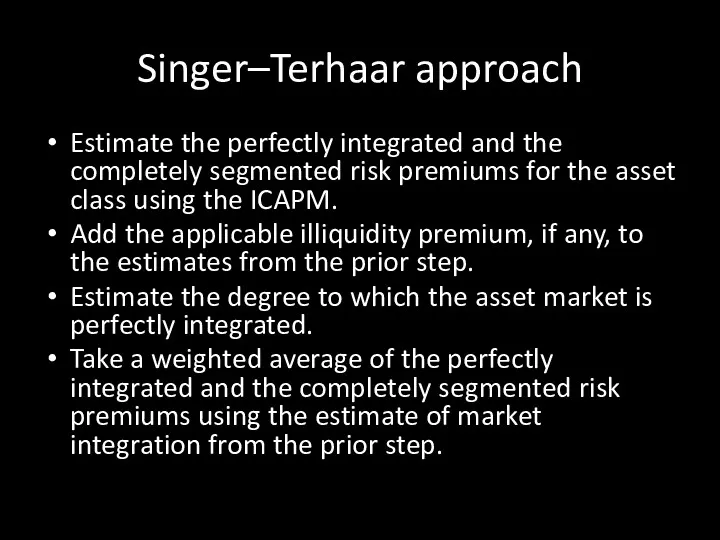
- 70. Singer–Terhaar approach Estimate the perfectly integrated and the completely segmented risk premiums for the asset class
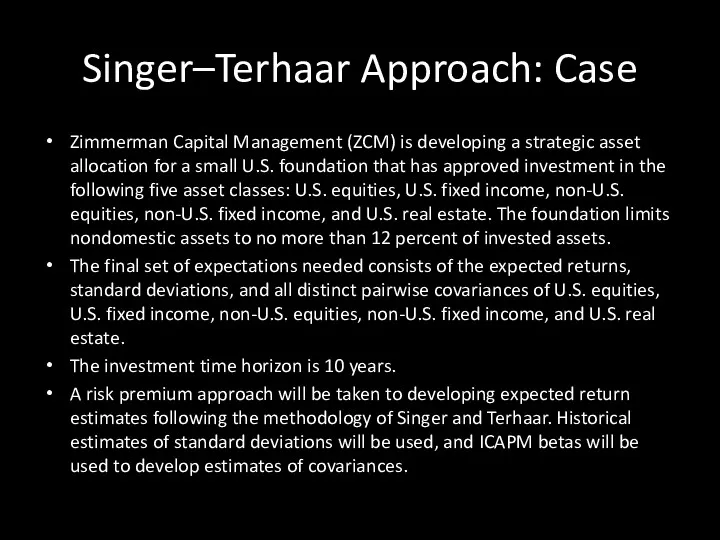
- 71. Singer–Terhaar Approach: Case Zimmerman Capital Management (ZCM) is developing a strategic asset allocation for a small
- 72. Case II Exhibit below supplies the standard deviation estimates and gives relevant inputs for other quantities
- 73. Case III Based on the information given, address the following problems: CalculatetheexpectedreturnsonU.S.equities,U.S.fixedincome,non-U.S.equi- ties, non-U.S. fixed income,
- 74. Solution - Integrated Case
- 75. Solution – Segmented Case
- 76. Solution to 1
- 77. Solution to 2 Based on Equation 4-3b with one factor, the covariance between any two assets
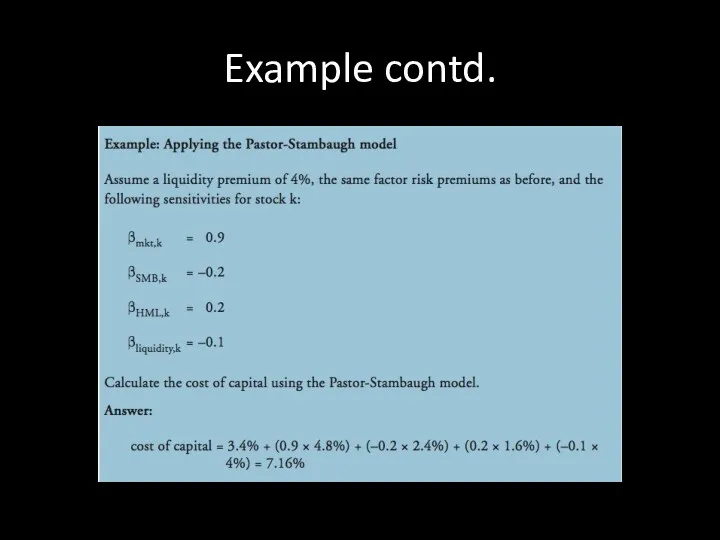
- 78. Pastor-Stambaugh the Pastor-Stambaugh model adds a liquidity factor to the Fama-French model. the baseline value for
- 79. Example
- 80. Example contd.
- 81. Adjusted betas when making forecasts of the equity risk premium, some analysts recommend adjusting the beta
- 82. Example
- 83. DEBTS: INTRO AND STRATEGIES Part II.5
- 84. Debts PM Strategies pure bond indexing, enhanced indexing by matching primary risk factors, by small risk
- 85. Pure bond indexing objectives Matching benchmark return Technique matching the portfolio’s characteristics to the benchmark’s risk
- 86. Enhanced indexing Objective: enhancing return Techniques: matching primary risk factors (sampling), primary risk factors to match
- 87. Other techniques As even perfectly indexed portfolio will still underperform the benchmark by the amount of
- 88. Active Management by Larger Risk Factor Mismatches Objective: earning sufficient return to cover administrative as well
- 89. Full-Blown Active Objectives: outperform at all costs Techniques: tilting, relative value, and duration strategies advantages disadvantages
- 90. Summary of bonds portfolio managing strategies Source: Maginn et al.
- 91. Aligning Risk Exposures portfolio and benchmark risk profiles can be measured along several dimensions duration, key
- 93. Скачать презентацию
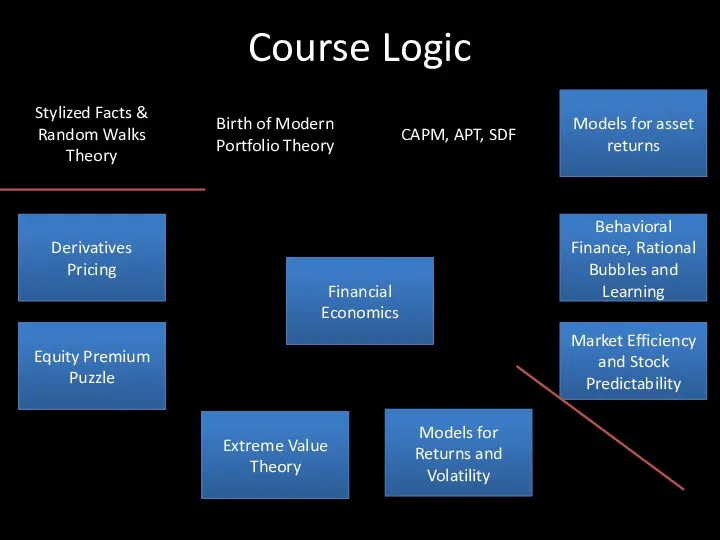
Course Logic
Financial
Economics
Stylized Facts &
Random Walks Theory
Birth of Modern Portfolio Theory
CAPM,
Course Logic
Financial
Economics
Stylized Facts &
Random Walks Theory
Birth of Modern Portfolio Theory
CAPM,
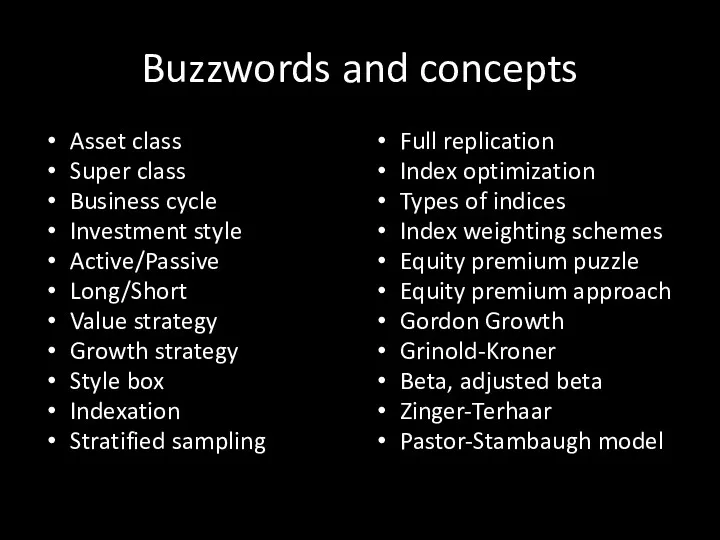
Buzzwords and concepts
Asset class
Super class
Business cycle
Investment style
Active/Passive
Long/Short
Value strategy
Growth strategy
Style box
Indexation
Stratified sampling
Full
Buzzwords and concepts
Asset class
Super class
Business cycle
Investment style
Active/Passive
Long/Short
Value strategy
Growth strategy
Style box
Indexation
Stratified sampling
Full
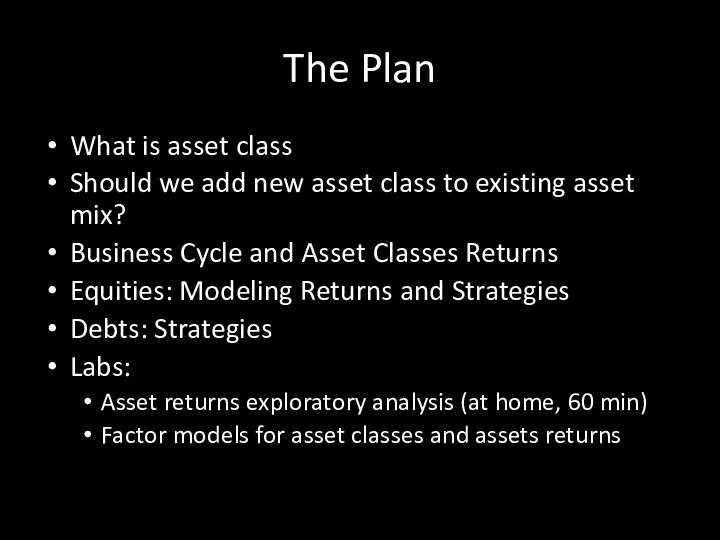
The Plan
What is asset class
Should we add new asset class to
The Plan
What is asset class
Should we add new asset class to
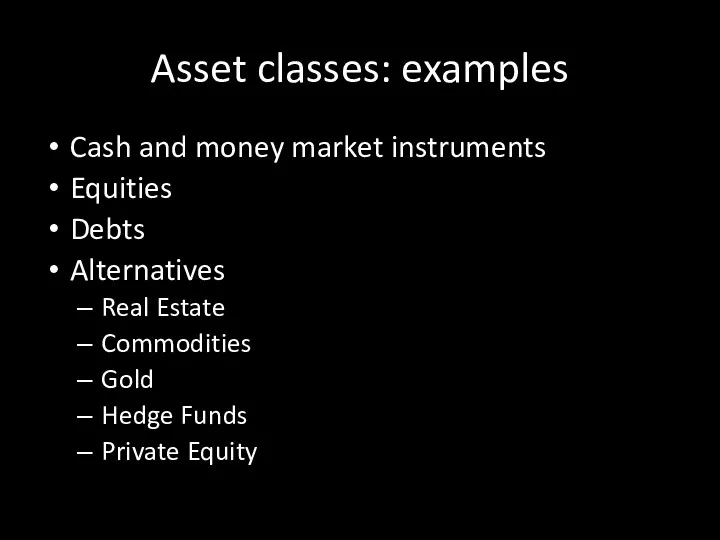
Asset classes: examples
Cash and money market instruments
Equities
Debts
Alternatives
Real Estate
Commodities
Gold
Hedge Funds
Private Equity
Asset classes: examples
Cash and money market instruments
Equities
Debts
Alternatives
Real Estate
Commodities
Gold
Hedge Funds
Private Equity
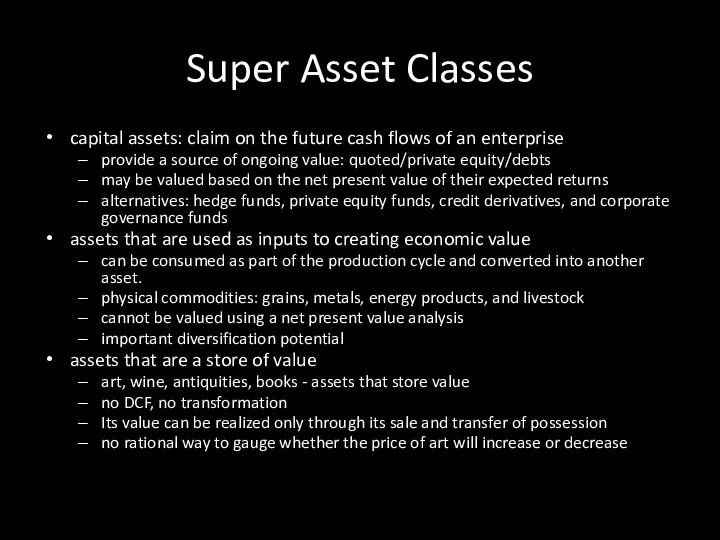
Super Asset Classes
capital assets: claim on the future cash flows of
Super Asset Classes
capital assets: claim on the future cash flows of
Bonds and Equities
Bonds and equities are dominating as investment assets
Equities account
Bonds and Equities
Bonds and equities are dominating as investment assets
Equities account

INCLUSION OF NEW ASSET CLASS
Part II.1
INCLUSION OF NEW ASSET CLASS
Part II.1
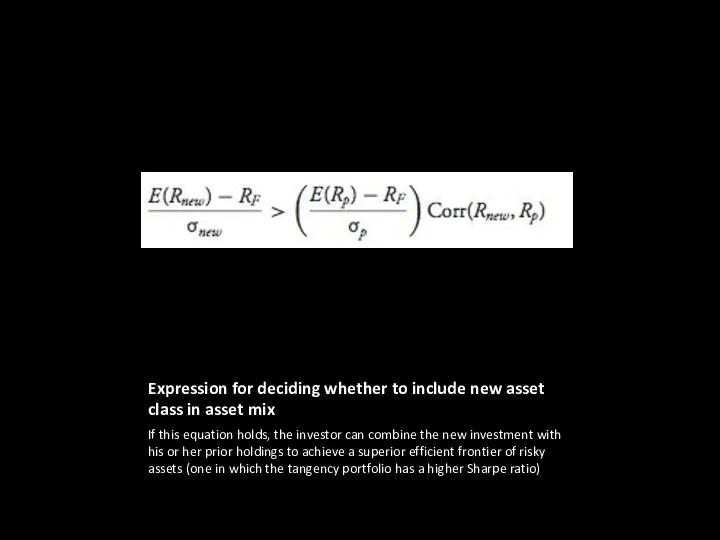
Expression for deciding whether to include new asset class in asset
Expression for deciding whether to include new asset class in asset
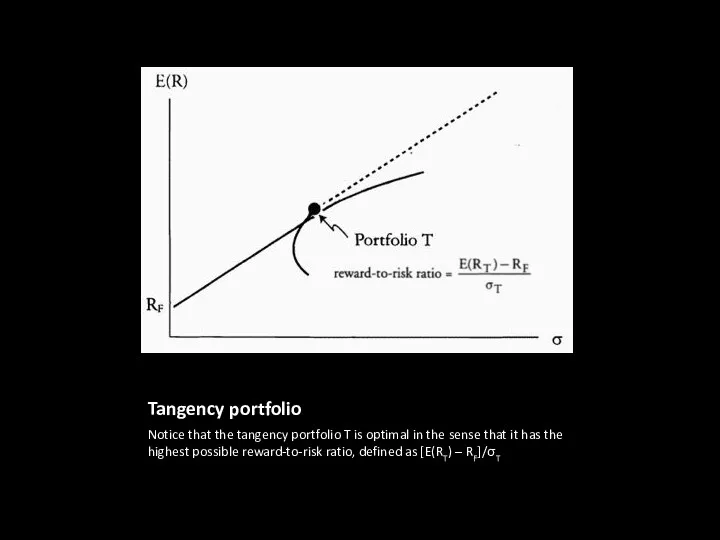
Tangency portfolio
Notice that the tangency portfolio T is optimal in the
Tangency portfolio
Notice that the tangency portfolio T is optimal in the

ASSET CLASSES AND BUSINESS CYCLE
Part II.2
ASSET CLASSES AND BUSINESS CYCLE
Part II.2
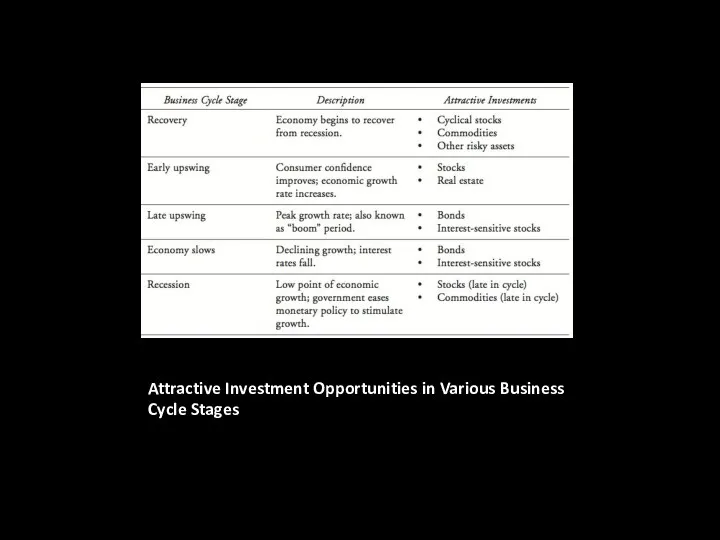
Attractive Investment Opportunities in Various Business Cycle Stages
Attractive Investment Opportunities in Various Business Cycle Stages
Key variables to watch cycle
Confidence: business, consumer
GDP
Inflation
Unemployment
Output gap
Treasuries spread
Central bank policy
Key variables to watch cycle
Confidence: business, consumer
GDP
Inflation
Unemployment
Output gap
Treasuries spread
Central bank policy

EQUITIES: INTRO
Part II.3
EQUITIES: INTRO
Part II.3
Equities generate superior returns in the long run
Wealth multipliers for US
Equities generate superior returns in the long run
Wealth multipliers for US
Equities provide astonishing results in the very long run
Wealth multipliers for
Equities provide astonishing results in the very long run
Wealth multipliers for
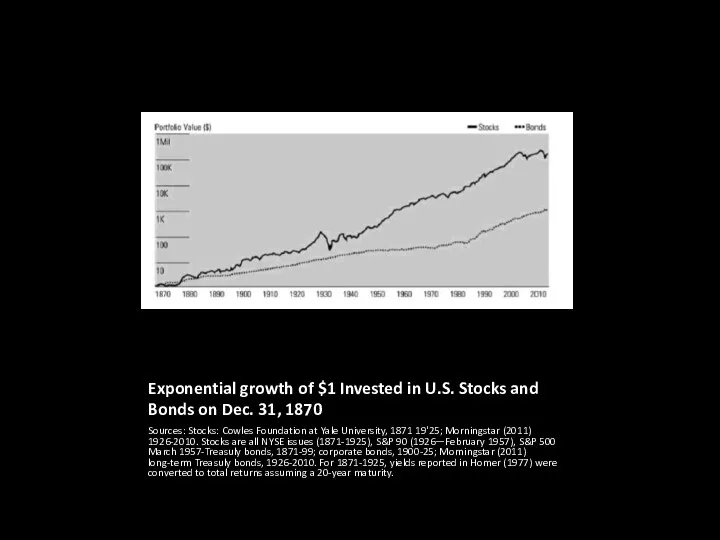
Exponential growth of $1 Invested in U.S. Stocks and Bonds on
Exponential growth of $1 Invested in U.S. Stocks and Bonds on
Equity premium puzzle
Lack of an explanation generally accepted by economists for
Equity premium puzzle
Lack of an explanation generally accepted by economists for
US Equity premium using different data sets
Source: Equity premium in retrospect,
US Equity premium using different data sets
Source: Equity premium in retrospect,
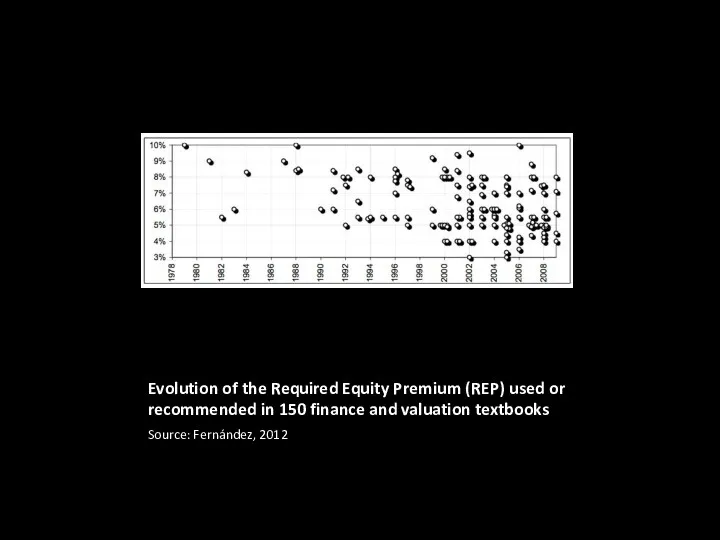
Evolution of the Required Equity Premium (REP) used or recommended in
Evolution of the Required Equity Premium (REP) used or recommended in
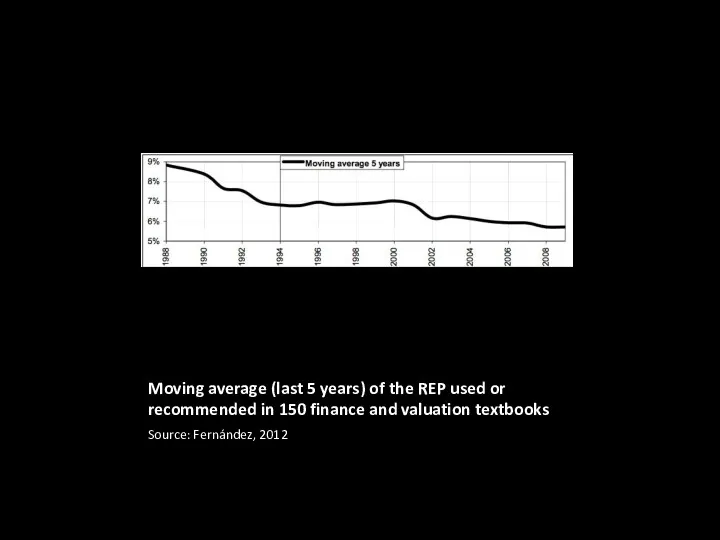
Moving average (last 5 years) of the REP used or recommended
Moving average (last 5 years) of the REP used or recommended
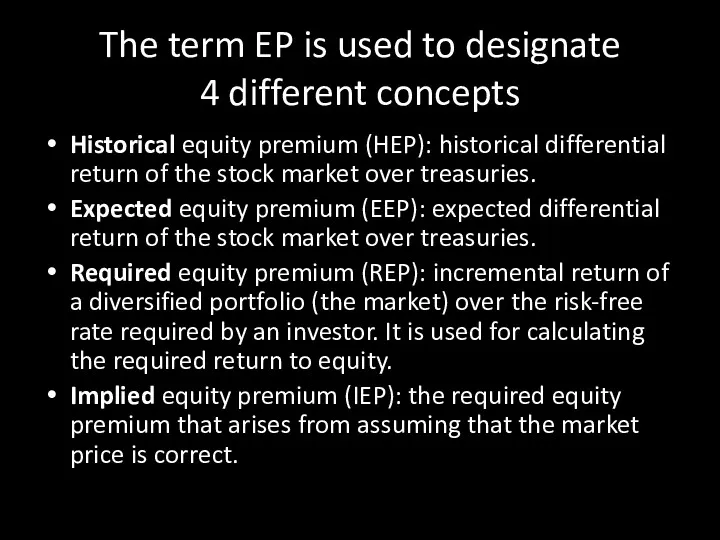
The term EP is used to designate
4 different concepts
Historical
The term EP is used to designate
4 different concepts
Historical
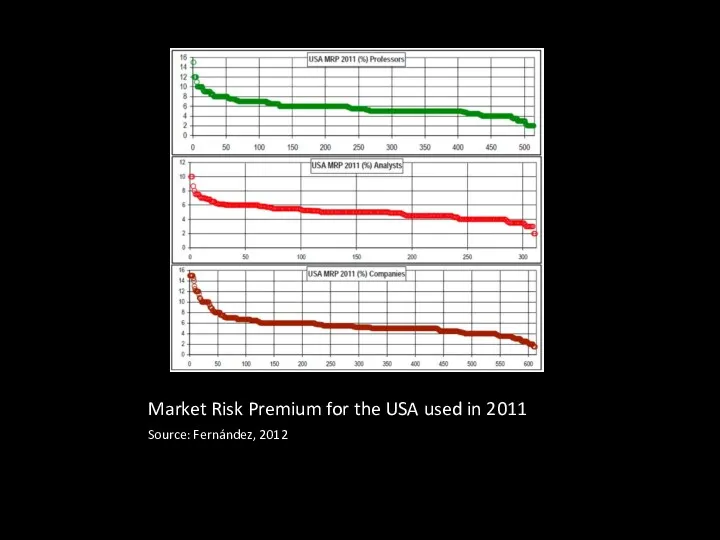
Market Risk Premium for the USA used in 2011
Source: Fernández,
Market Risk Premium for the USA used in 2011
Source: Fernández,
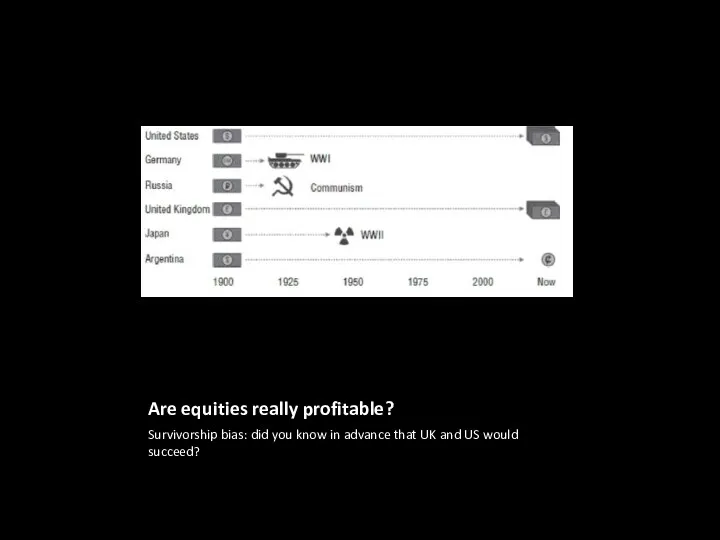
Are equities really profitable?
Survivorship bias: did you know in advance that
Are equities really profitable?
Survivorship bias: did you know in advance that
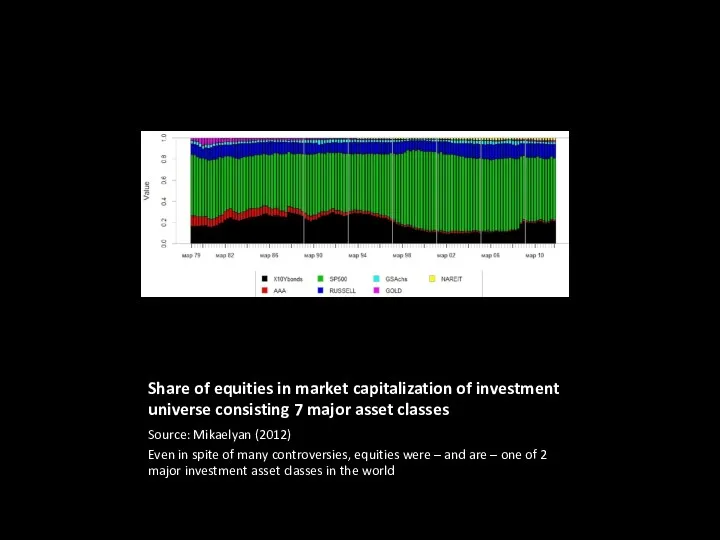
Share of equities in market capitalization of investment universe consisting 7
Share of equities in market capitalization of investment universe consisting 7
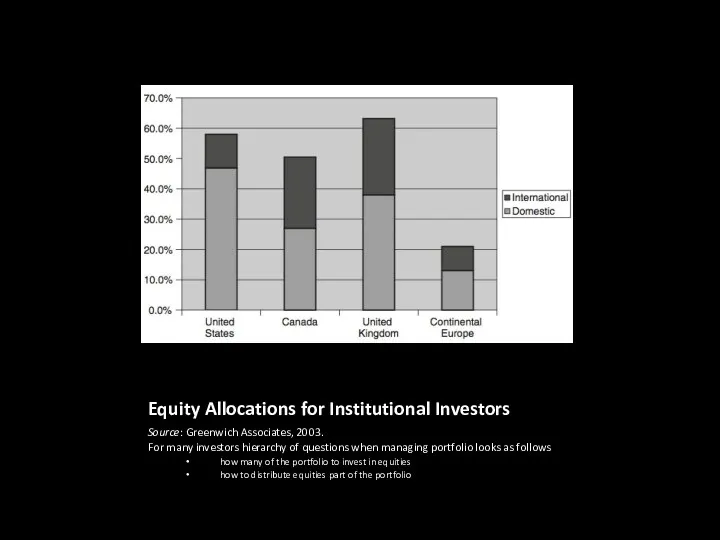
Equity Allocations for Institutional Investors
Source: Greenwich Associates, 2003.
For many investors
Equity Allocations for Institutional Investors
Source: Greenwich Associates, 2003.
For many investors
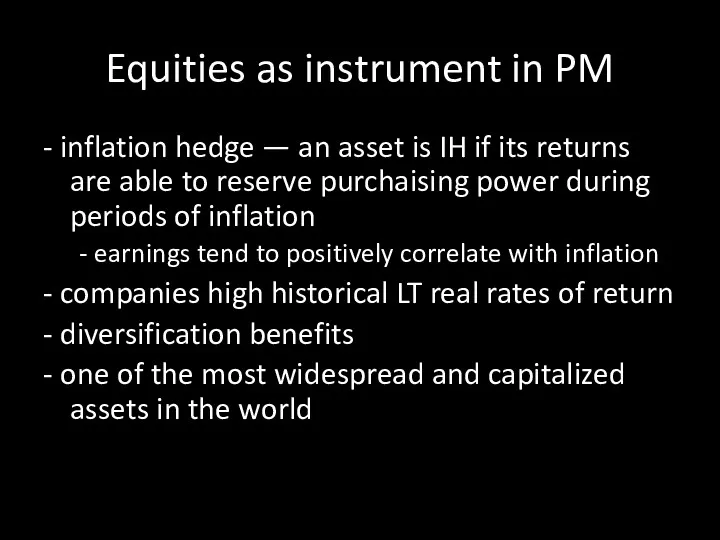
Equities as instrument in PM
- inflation hedge — an asset is
Equities as instrument in PM
- inflation hedge — an asset is
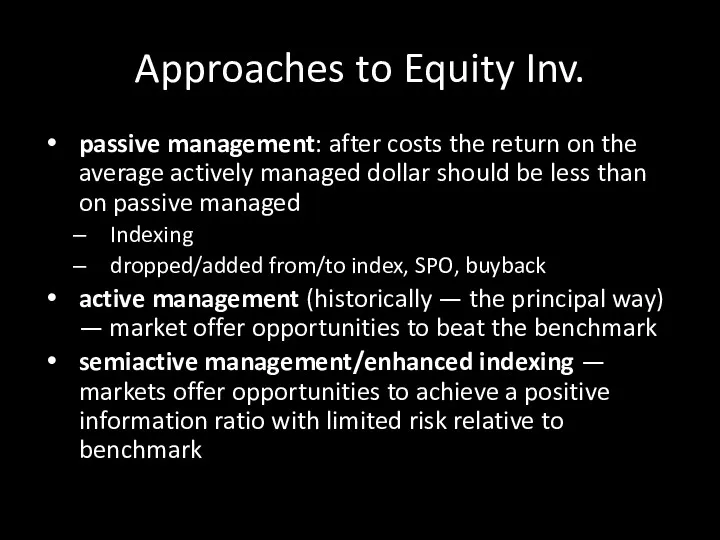
Approaches to Equity Inv.
passive management: after costs the return on the
Approaches to Equity Inv.
passive management: after costs the return on the
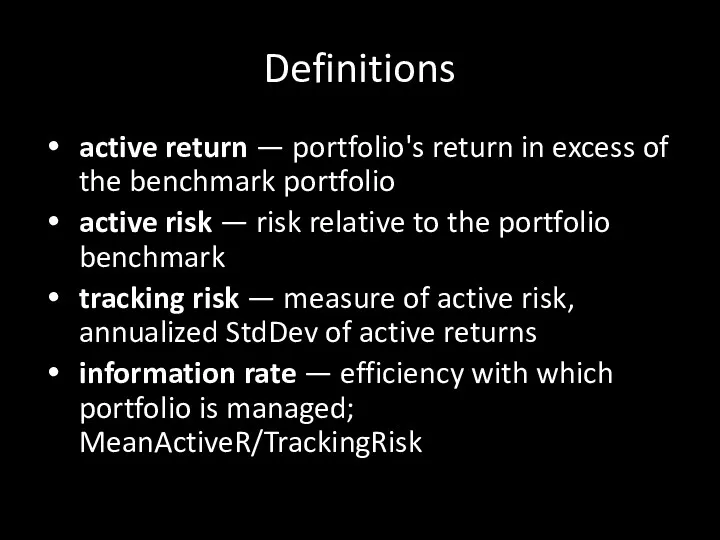
Definitions
active return — portfolio's return in excess of the benchmark portfolio
active
Definitions
active return — portfolio's return in excess of the benchmark portfolio
active
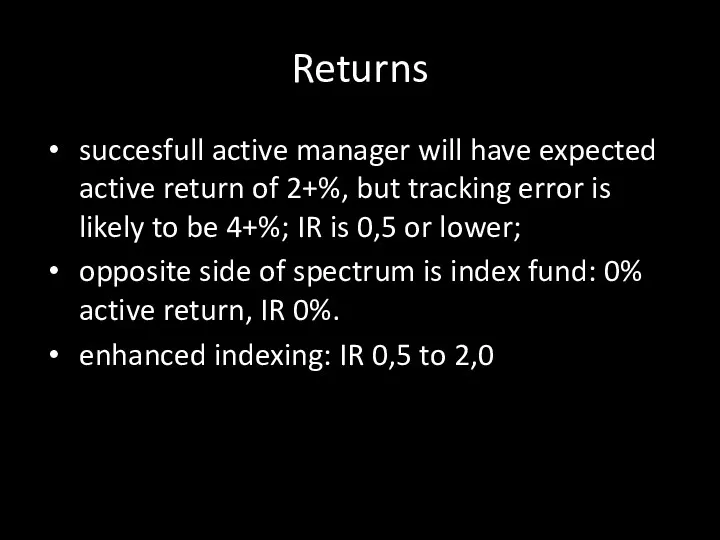
Returns
succesfull active manager will have expected active return of 2+%, but
Returns
succesfull active manager will have expected active return of 2+%, but
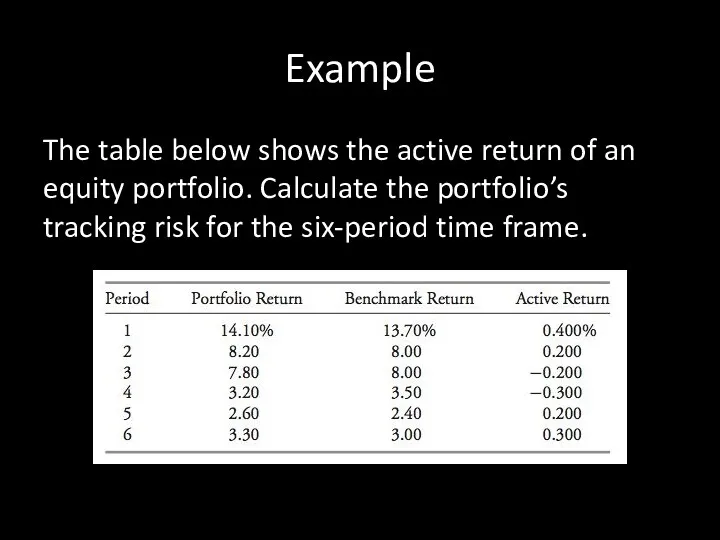
Example
The table below shows the active return of an equity portfolio.
Example
The table below shows the active return of an equity portfolio.
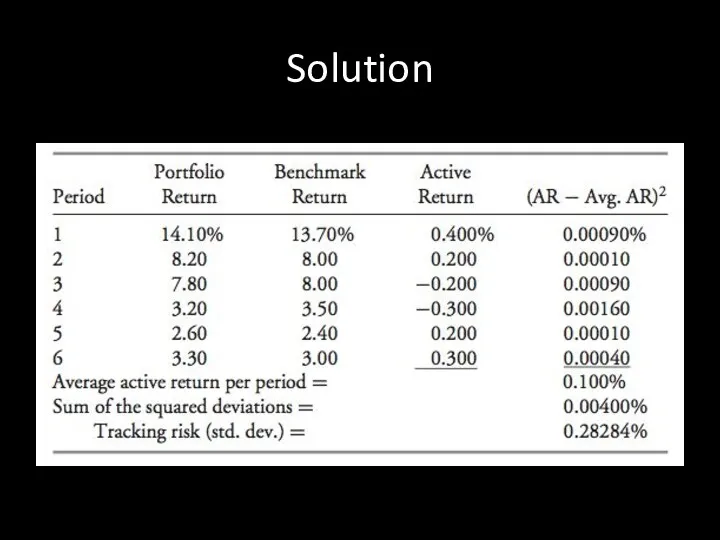
Solution
Solution
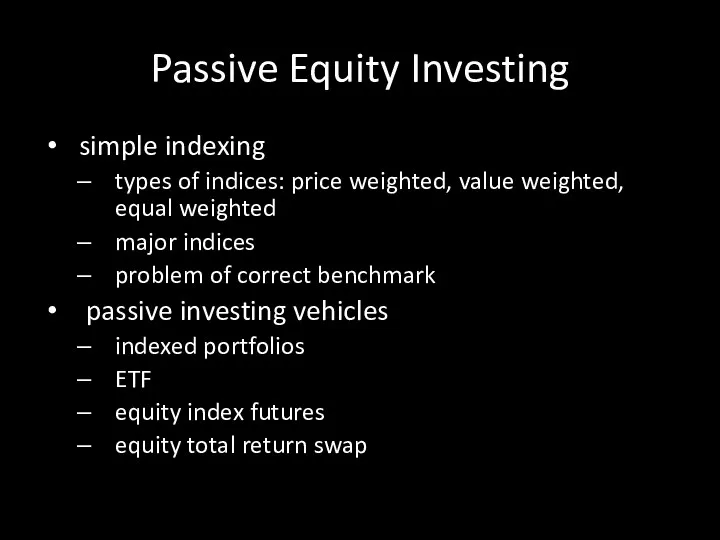
Passive Equity Investing
simple indexing
types of indices: price weighted, value weighted, equal
Passive Equity Investing
simple indexing
types of indices: price weighted, value weighted, equal
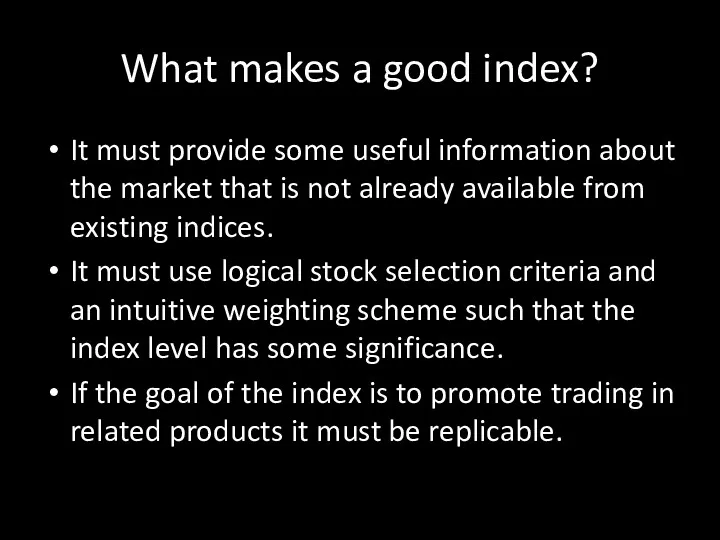
What makes a good index?
It must provide some useful information about
What makes a good index?
It must provide some useful information about
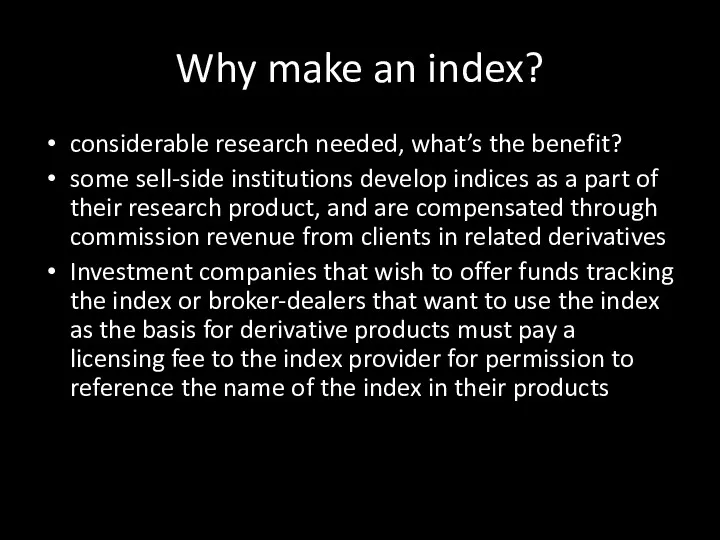
Why make an index?
considerable research needed, what’s the benefit?
some sell-side institutions
Why make an index?
considerable research needed, what’s the benefit?
some sell-side institutions
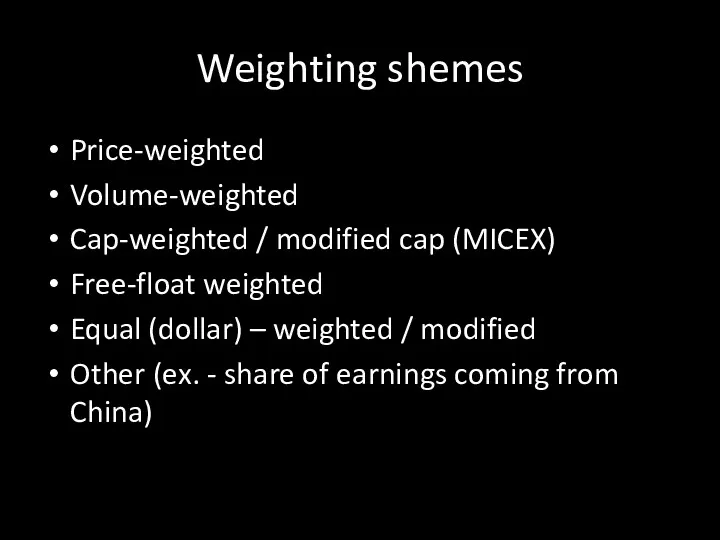
Weighting shemes
Price-weighted
Volume-weighted
Cap-weighted / modified cap (MICEX)
Free-float weighted
Equal (dollar) – weighted /
Weighting shemes
Price-weighted
Volume-weighted
Cap-weighted / modified cap (MICEX)
Free-float weighted
Equal (dollar) – weighted /
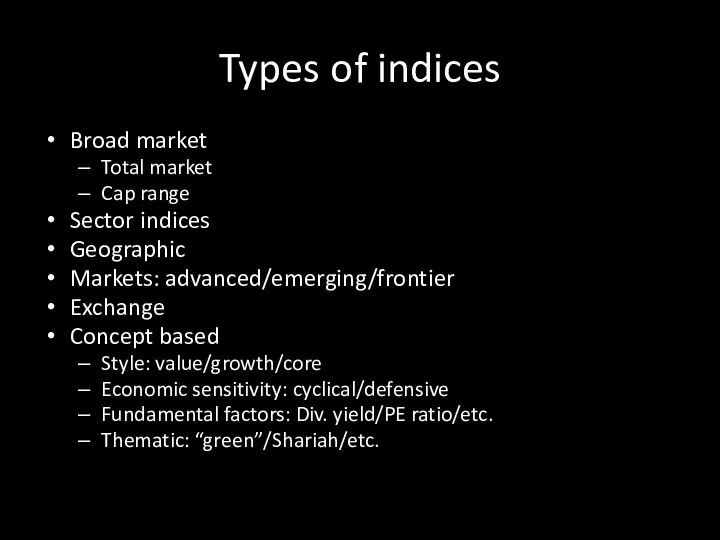
Types of indices
Broad market
Total market
Cap range
Sector indices
Geographic
Markets: advanced/emerging/frontier
Exchange
Concept based
Style: value/growth/core
Economic sensitivity:
Types of indices
Broad market
Total market
Cap range
Sector indices
Geographic
Markets: advanced/emerging/frontier
Exchange
Concept based
Style: value/growth/core
Economic sensitivity:
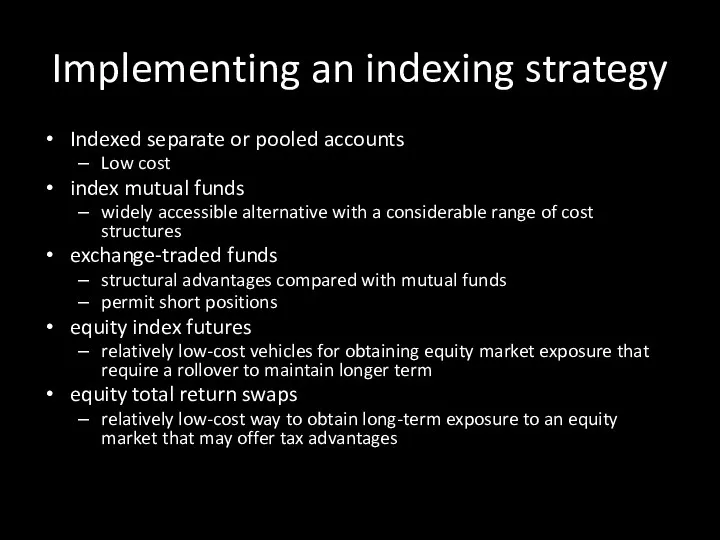
Implementing an indexing strategy
Indexed separate or pooled accounts
Low cost
index mutual funds
widely
Implementing an indexing strategy
Indexed separate or pooled accounts
Low cost
index mutual funds
widely
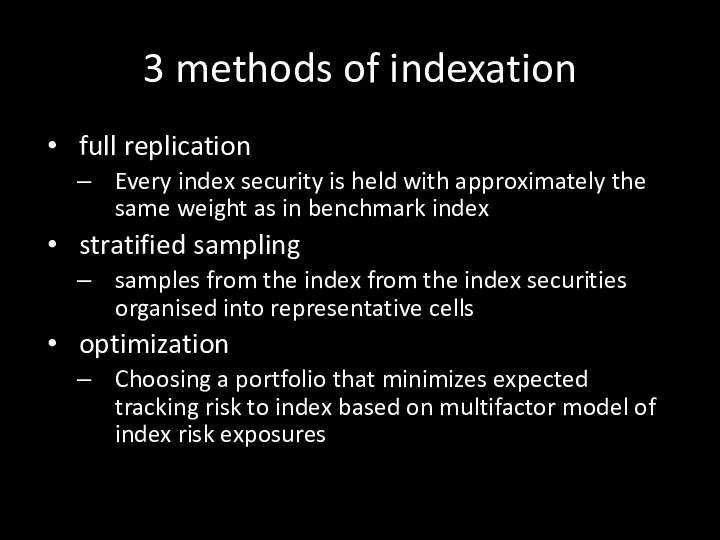
3 methods of indexation
full replication
Every index security is held with approximately
3 methods of indexation
full replication
Every index security is held with approximately
Active Equity Investing
equity styles
Value vs. Growth vs. Market oriented
Style index
Active Equity Investing
equity styles
Value vs. Growth vs. Market oriented
Style index

Main types of active strategies
Value,
value investors are more concerned about
Main types of active strategies
Value,
value investors are more concerned about
Value investing
buying a stock that is deemed relatively cheap in terms
Value investing
buying a stock that is deemed relatively cheap in terms
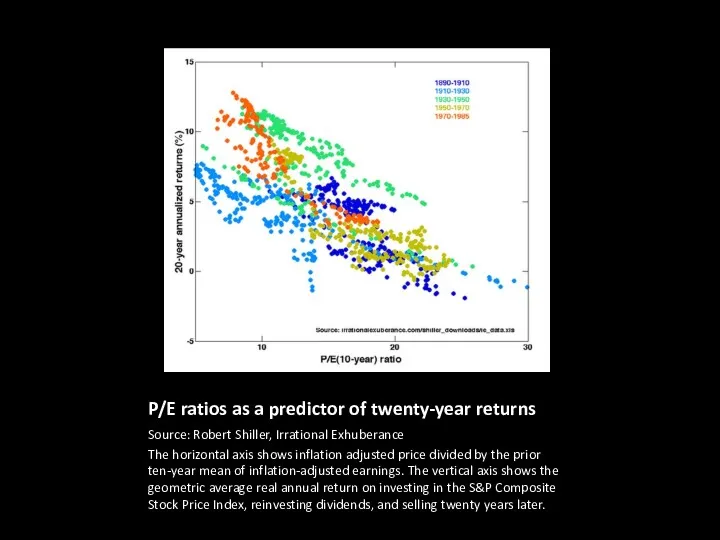
P/E ratios as a predictor of twenty-year returns
Source: Robert Shiller, Irrational
P/E ratios as a predictor of twenty-year returns
Source: Robert Shiller, Irrational
Growth investing
value investors are focusing on price; growth investors are focusing
Growth investing
value investors are focusing on price; growth investors are focusing
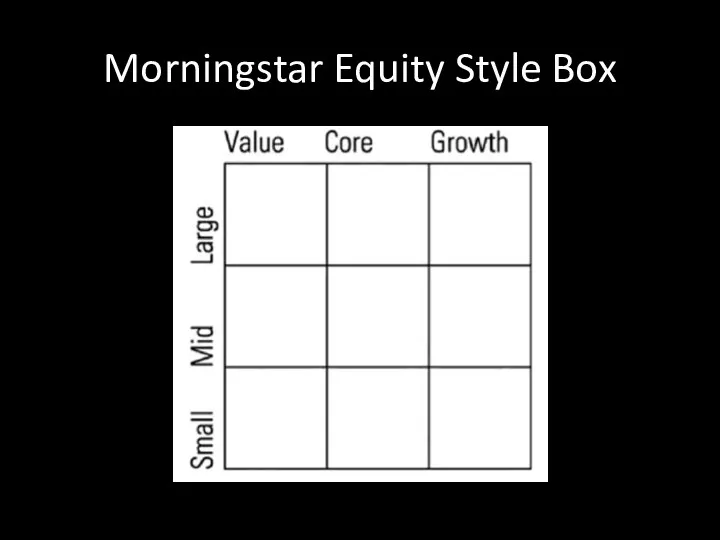
Morningstar Equity Style Box
Morningstar Equity Style Box
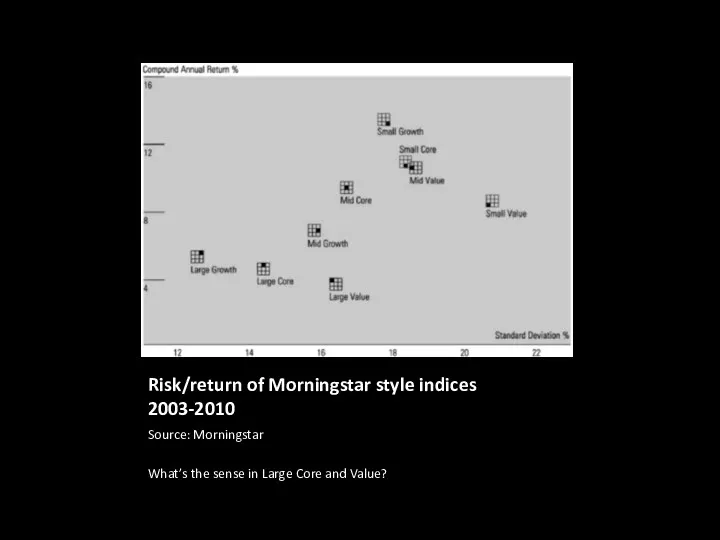
Risk/return of Morningstar style indices 2003-2010
Source: Morningstar
What’s the sense in Large
Risk/return of Morningstar style indices 2003-2010
Source: Morningstar
What’s the sense in Large
Flaws of indexation
Several researchers criticize fundamental indexation on both theoretical and
Flaws of indexation
Several researchers criticize fundamental indexation on both theoretical and
Risks of value/growth
The main risk for a value investor is the
Risks of value/growth
The main risk for a value investor is the
Long/short strategies
long-only strategy can capture one overall alpha.
in long–short strategy
Long/short strategies
long-only strategy can capture one overall alpha.
in long–short strategy

EQUITIES: RETURN MODELS
Part II.4
EQUITIES: RETURN MODELS
Part II.4
Models of equity return
Historical Estimates
premium approach,
DCF,
Gordon growth,
Grinold-Kroner,
Singer-Terhaar,
Models of equity return
Historical Estimates
premium approach,
DCF,
Gordon growth,
Grinold-Kroner,
Singer-Terhaar,
Historical estimates: geometric mean
focus of MVO (Markowiyz, 1952): tradeoff between StdDev
Historical estimates: geometric mean
focus of MVO (Markowiyz, 1952): tradeoff between StdDev
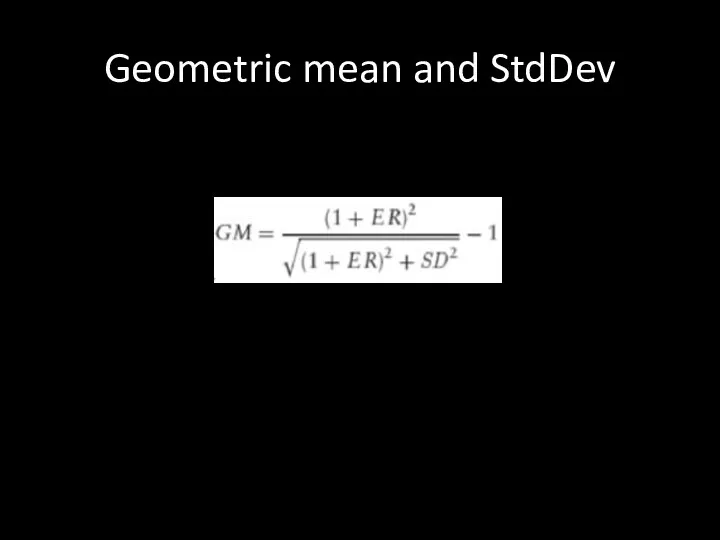
Geometric mean and StdDev
Geometric mean and StdDev
Example
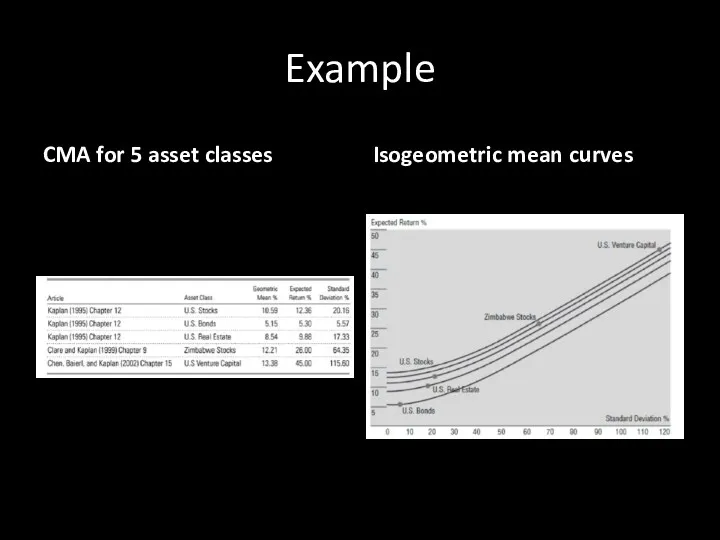
CMA for 5 asset classes
Isogeometric mean curves
Example
CMA for 5 asset classes
Isogeometric mean curves

DCF
You all know it very well, don’t you?
DCF
You all know it very well, don’t you?
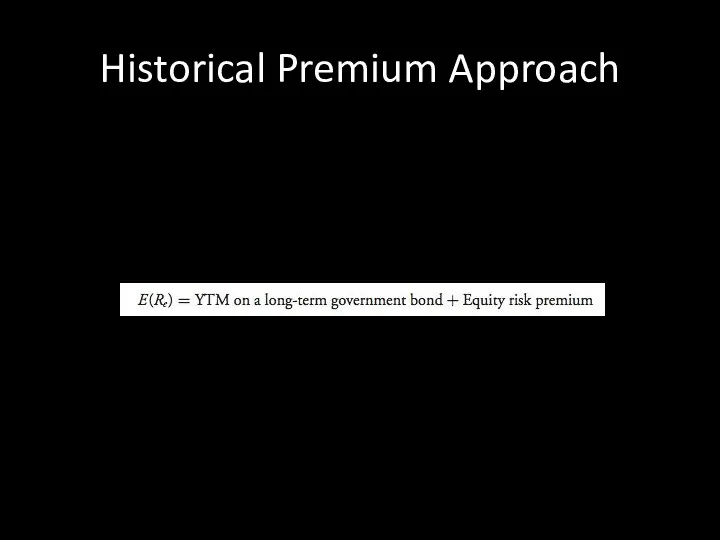
Historical Premium Approach
Historical Premium Approach
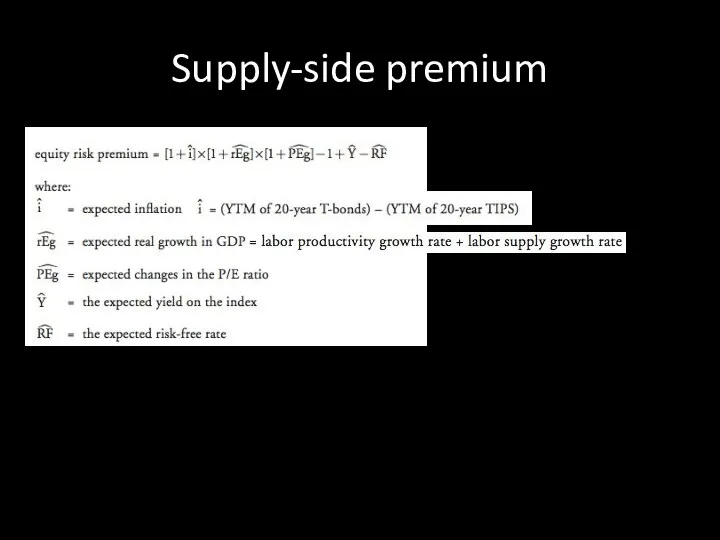
Supply-side premium
Supply-side premium
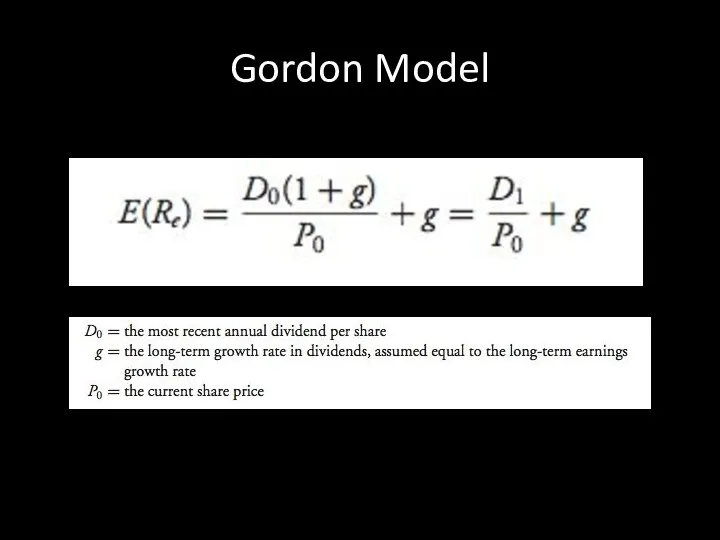
Gordon Model
Gordon Model
Growth rate
Expected Real GDP + expected inflation
Sometimes: + excess corporate growth
Growth rate
Expected Real GDP + expected inflation
Sometimes: + excess corporate growth
Grinold-Kroner Model
In the United States and other major markets, share repurchases
Grinold-Kroner Model
In the United States and other major markets, share repurchases
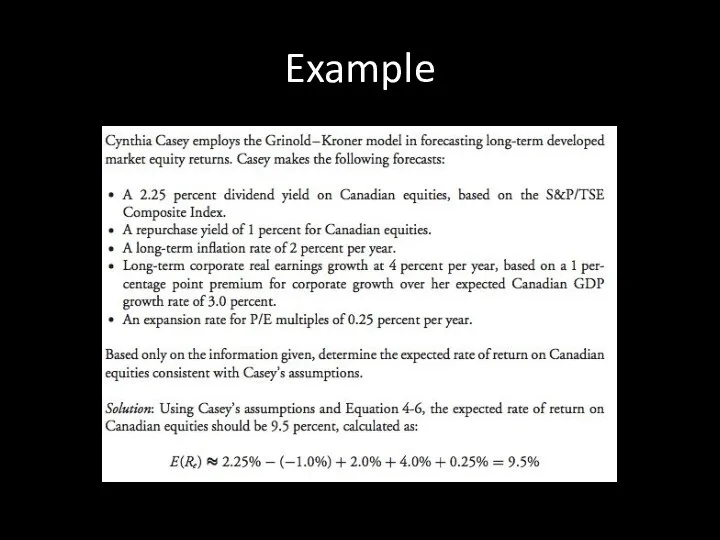
Example
Example
Case
An Australian investor currently holds an A$240 million equity portfolio. He
Case
An Australian investor currently holds an A$240 million equity portfolio. He
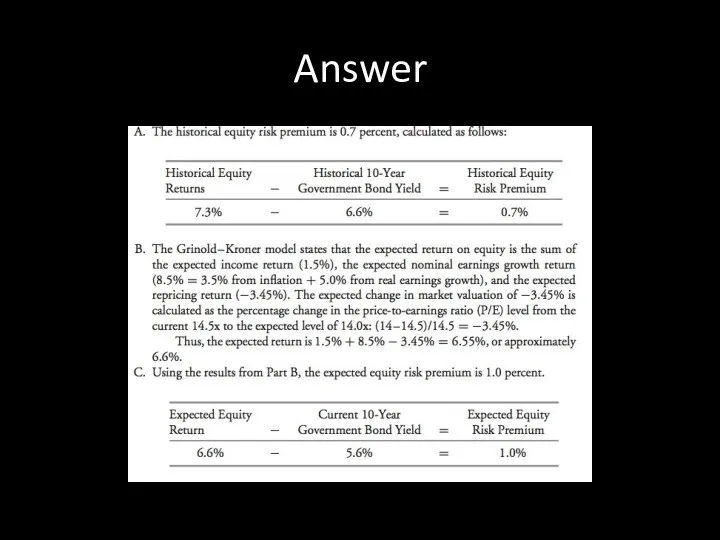
Answer
Answer
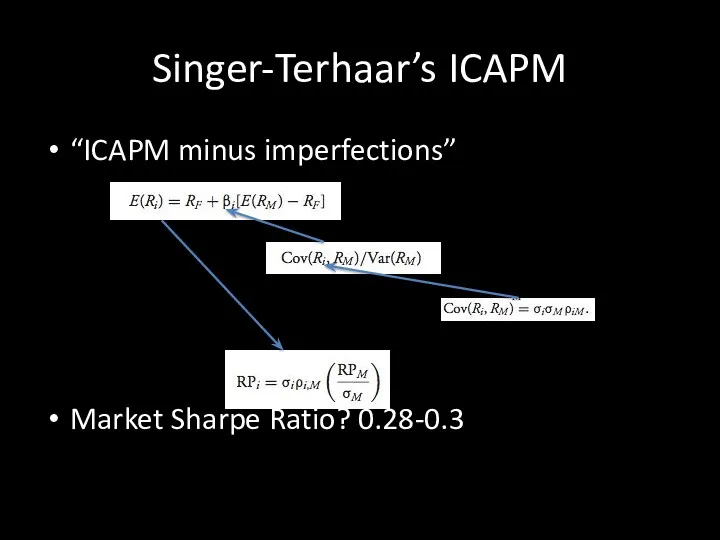
Singer-Terhaar’s ICAPM
“ICAPM minus imperfections”
Market Sharpe Ratio? 0.28-0.3
Singer-Terhaar’s ICAPM
“ICAPM minus imperfections”
Market Sharpe Ratio? 0.28-0.3
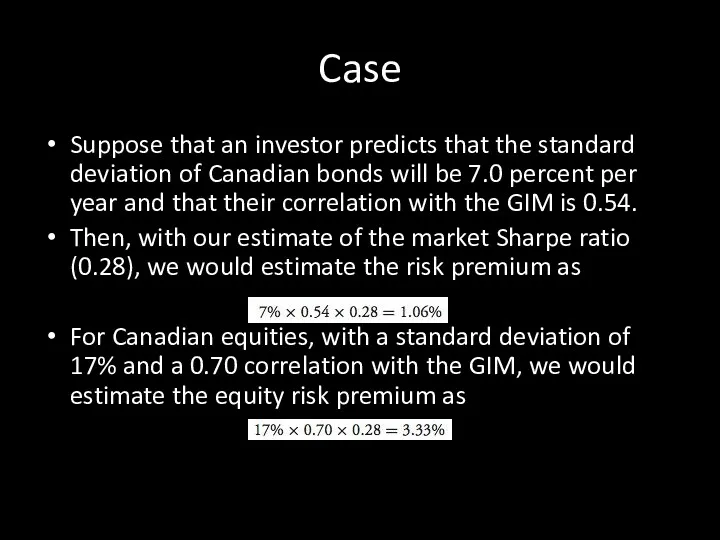
Case
Suppose that an investor predicts that the standard deviation of Canadian
Case
Suppose that an investor predicts that the standard deviation of Canadian
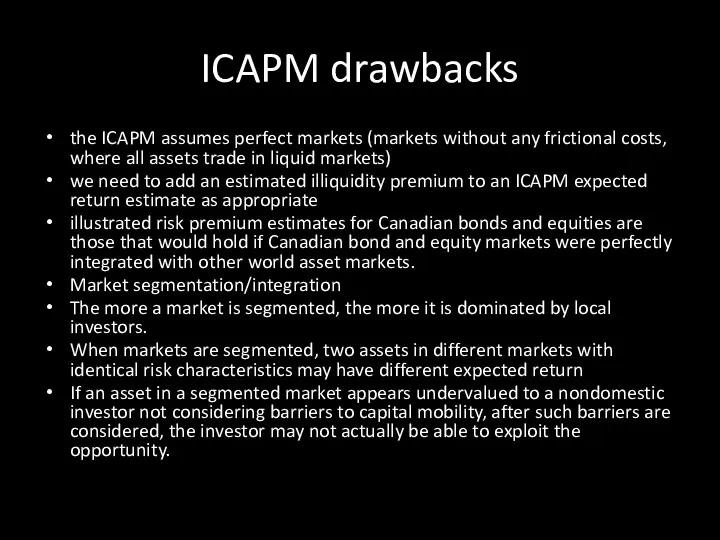
ICAPM drawbacks
the ICAPM assumes perfect markets (markets without any frictional costs,
ICAPM drawbacks
the ICAPM assumes perfect markets (markets without any frictional costs,
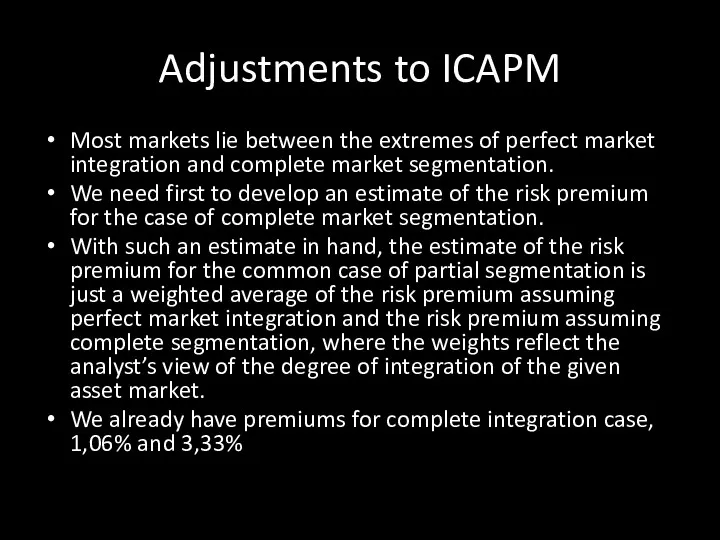
Adjustments to ICAPM
Most markets lie between the extremes of perfect market
Adjustments to ICAPM
Most markets lie between the extremes of perfect market
Segmented ICAPM
Because the individual market and the reference market portfolio are
Segmented ICAPM
Because the individual market and the reference market portfolio are
Segmented + Integrated
Taking the degree of integration as 0.8 for both
Segmented + Integrated
Taking the degree of integration as 0.8 for both
Singer–Terhaar approach
Estimate the perfectly integrated and the completely segmented risk premiums
Singer–Terhaar approach
Estimate the perfectly integrated and the completely segmented risk premiums
Singer–Terhaar Approach: Case
Zimmerman Capital Management (ZCM) is developing a strategic asset
Singer–Terhaar Approach: Case
Zimmerman Capital Management (ZCM) is developing a strategic asset
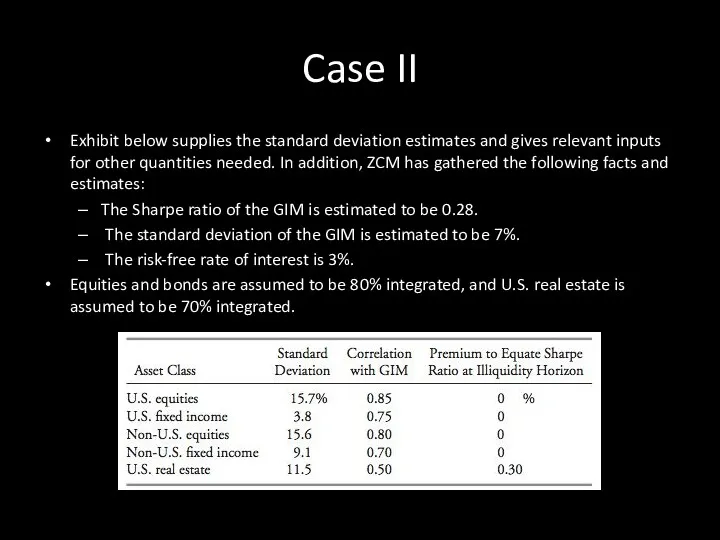
Case II
Exhibit below supplies the standard deviation estimates and gives relevant
Case II
Exhibit below supplies the standard deviation estimates and gives relevant
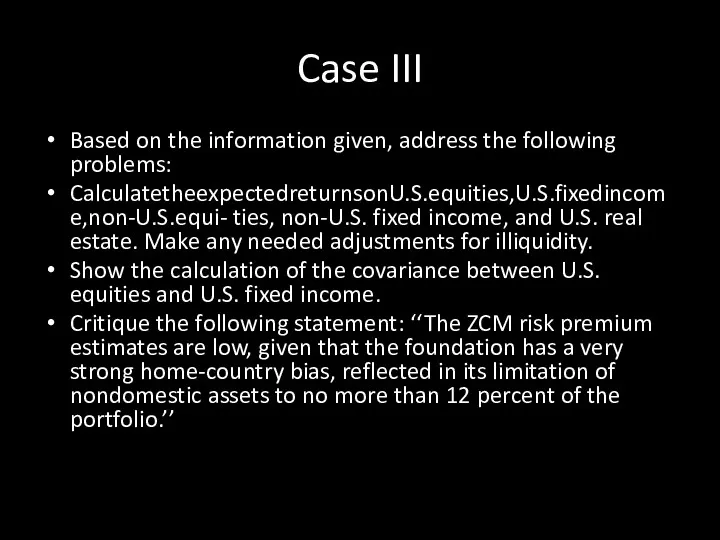
Case III
Based on the information given, address the following problems:
CalculatetheexpectedreturnsonU.S.equities,U.S.fixedincome,non-U.S.equi-
Case III
Based on the information given, address the following problems:
CalculatetheexpectedreturnsonU.S.equities,U.S.fixedincome,non-U.S.equi-
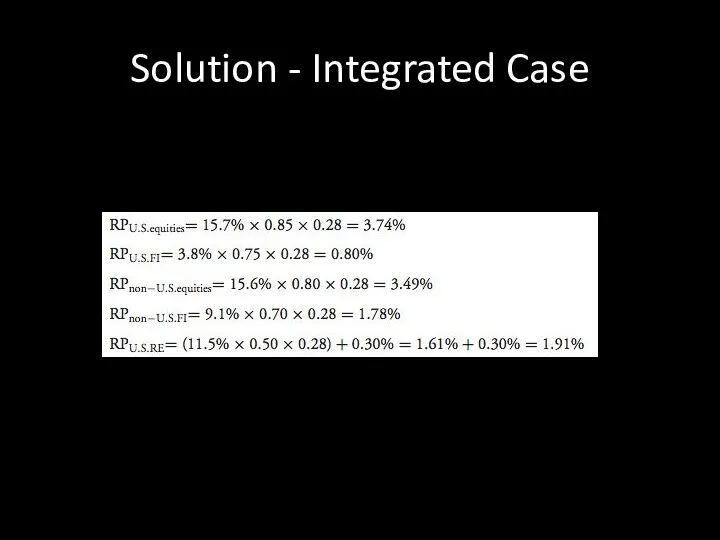
Solution - Integrated Case
Solution - Integrated Case
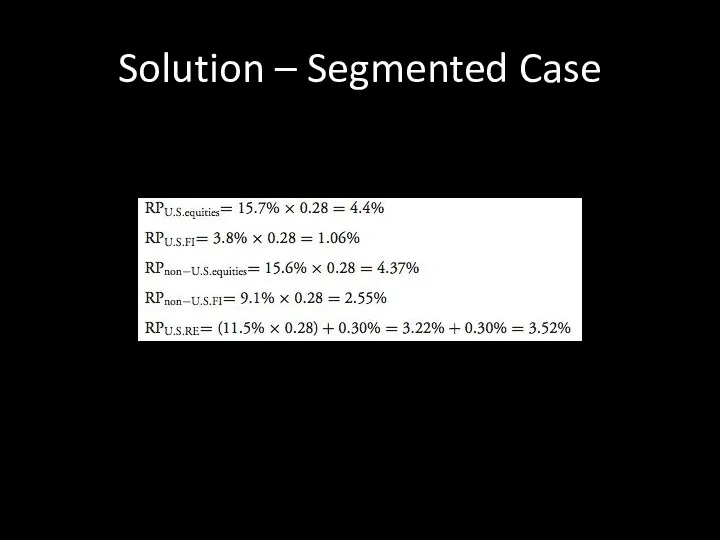
Solution – Segmented Case
Solution – Segmented Case
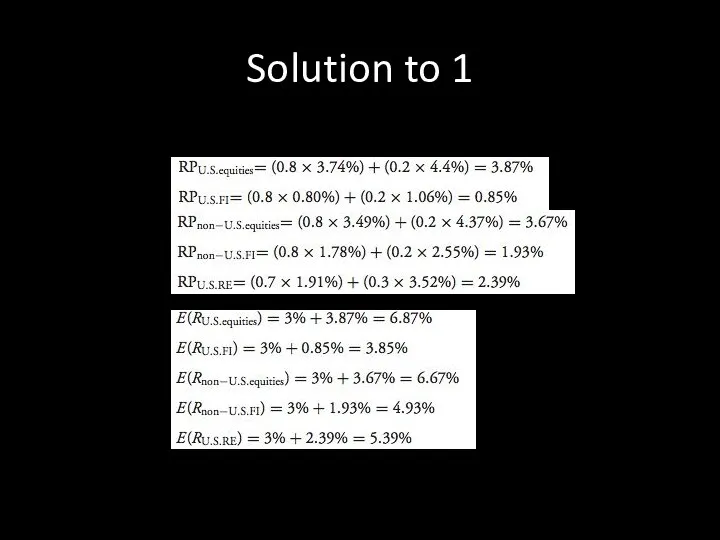
Solution to 1
Solution to 1
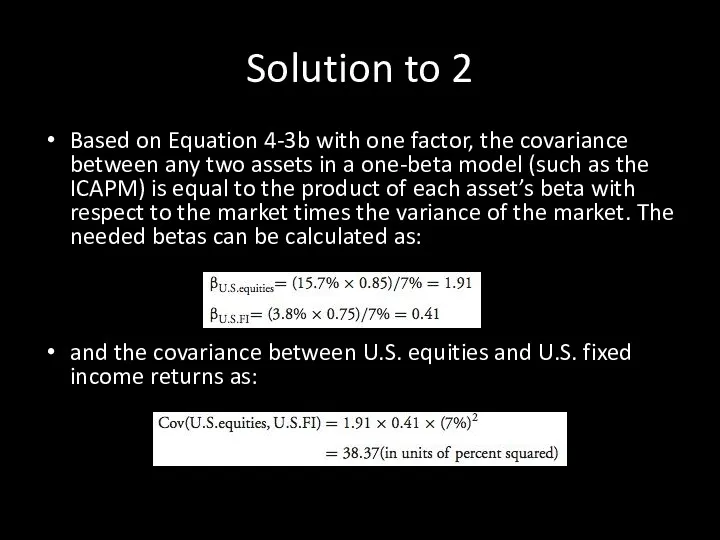
Solution to 2
Based on Equation 4-3b with one factor, the covariance
Solution to 2
Based on Equation 4-3b with one factor, the covariance
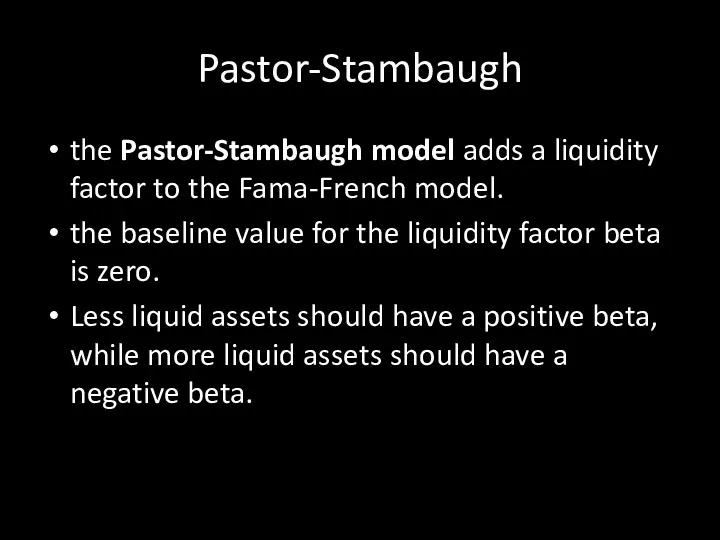
Pastor-Stambaugh
the Pastor-Stambaugh model adds a liquidity factor to the Fama-French model.
Pastor-Stambaugh
the Pastor-Stambaugh model adds a liquidity factor to the Fama-French model.
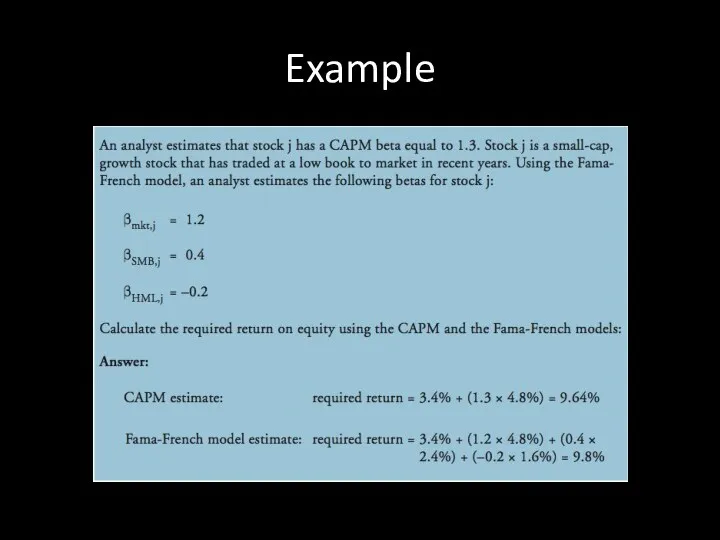
Example
Example
Example contd.
Example contd.
Adjusted betas
when making forecasts of the equity risk premium, some analysts
Adjusted betas
when making forecasts of the equity risk premium, some analysts
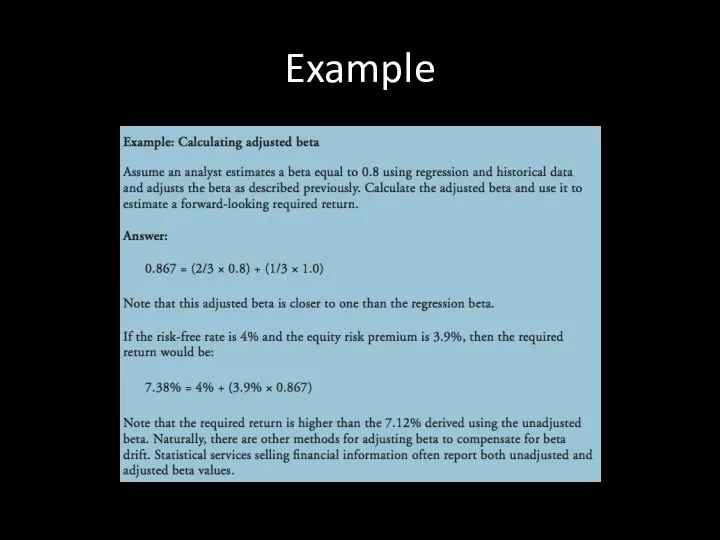
Example
Example

DEBTS: INTRO AND STRATEGIES
Part II.5
DEBTS: INTRO AND STRATEGIES
Part II.5
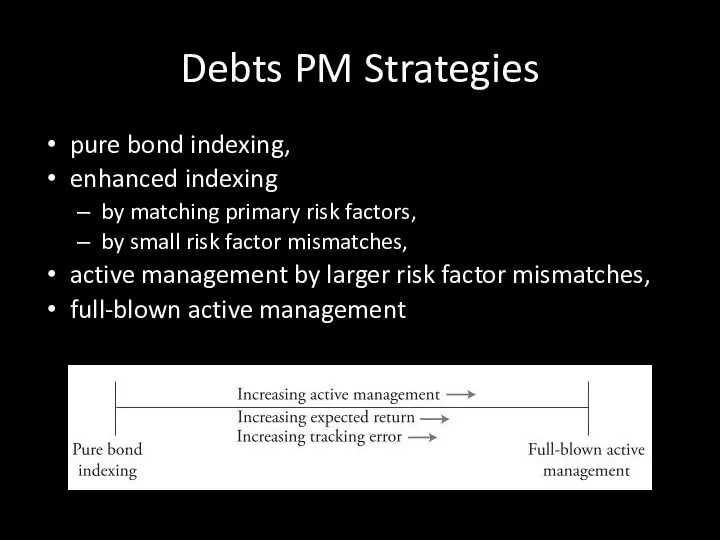
Debts PM Strategies
pure bond indexing,
enhanced indexing
by matching primary risk
Debts PM Strategies
pure bond indexing,
enhanced indexing
by matching primary risk
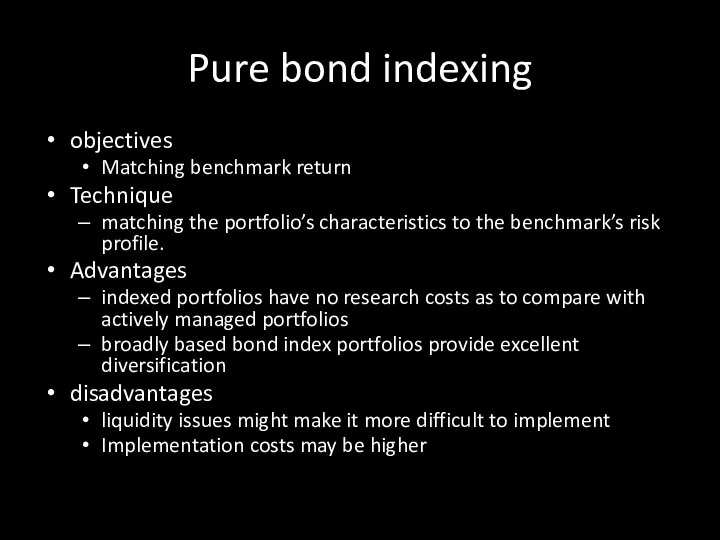
Pure bond indexing
objectives
Matching benchmark return
Technique
matching the portfolio’s characteristics to the
Pure bond indexing
objectives
Matching benchmark return
Technique
matching the portfolio’s characteristics to the
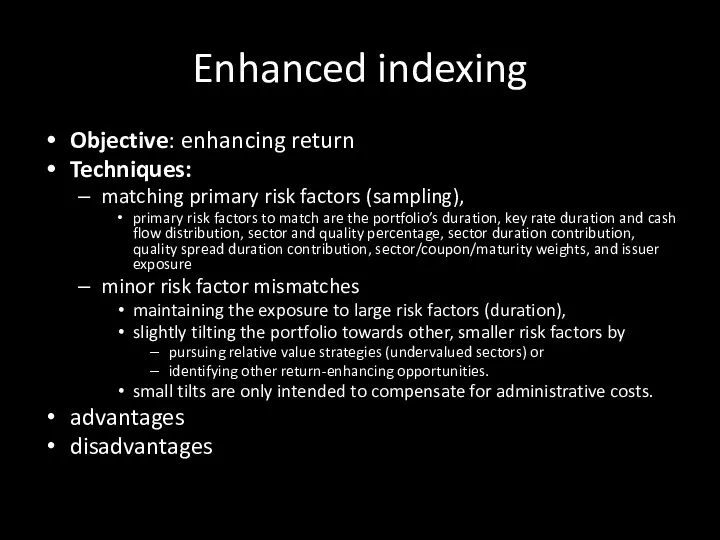
Enhanced indexing
Objective: enhancing return
Techniques:
matching primary risk factors (sampling),
primary
Enhanced indexing
Objective: enhancing return
Techniques:
matching primary risk factors (sampling),
primary
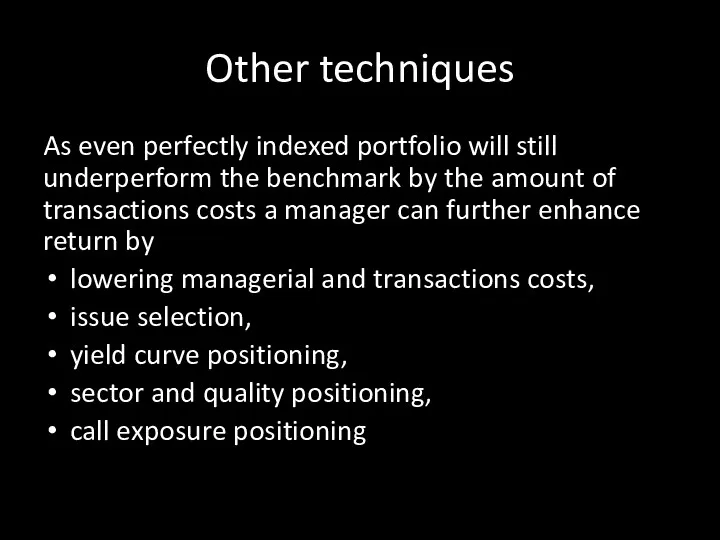
Other techniques
As even perfectly indexed portfolio will still underperform the benchmark
Other techniques
As even perfectly indexed portfolio will still underperform the benchmark
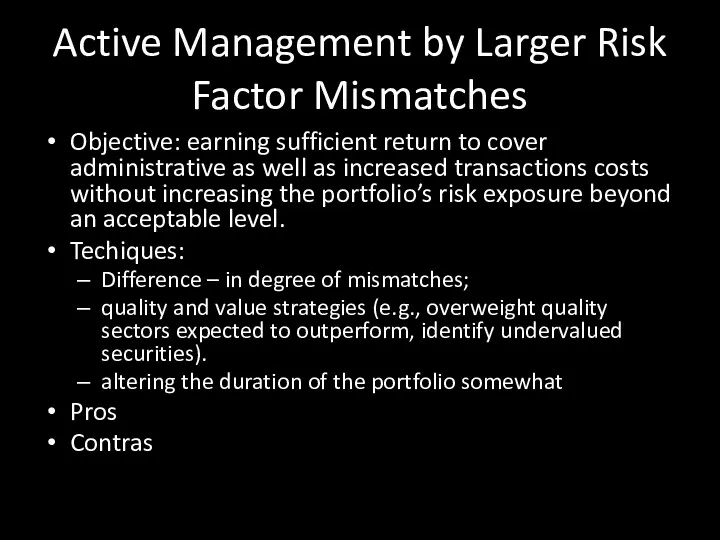
Active Management by Larger Risk Factor Mismatches
Objective: earning sufficient return
Active Management by Larger Risk Factor Mismatches
Objective: earning sufficient return
Full-Blown Active
Objectives: outperform at all costs
Techniques: tilting, relative value, and duration
Full-Blown Active
Objectives: outperform at all costs
Techniques: tilting, relative value, and duration
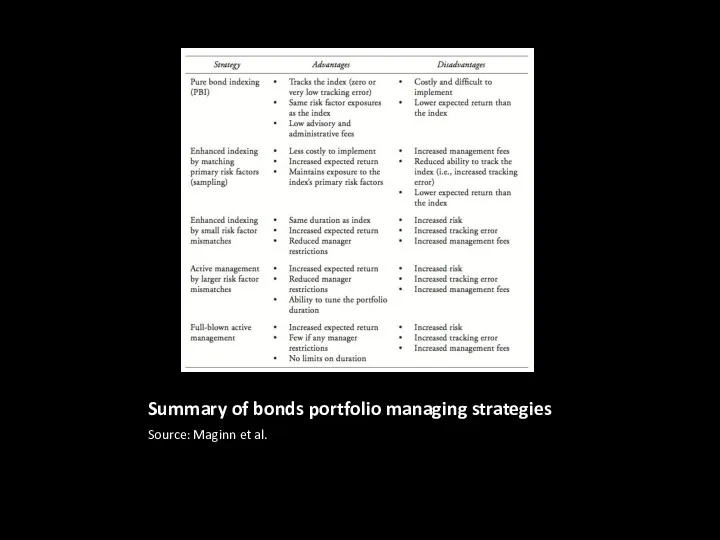
Summary of bonds portfolio managing strategies
Source: Maginn et al.
Summary of bonds portfolio managing strategies
Source: Maginn et al.
Aligning Risk Exposures
portfolio and benchmark risk profiles can be measured
Aligning Risk Exposures
portfolio and benchmark risk profiles can be measured
 Предприятие в условиях рыночной экономики. (Тема 1)
 Хозяйство США. Роль США в мировом хозяйстве
 МИГРАЦИОННЫЙ КРИЗИС
 Приоритеты программной стратегии России
 Взаимодействие глобальных проблем
 Economy of the Arkhangelsk region. Fishing industry
 Виды и модели рынка труда
 Внешнеэкономическая и экономическая безопасность России
 Экономическое стимулирование природоохранной деятельности (Тема 12)
 Экономика производителя
 Причины и следствия мирового финансового кризиса 2008 года
 Мировая экономика. (11 класс)
 Тема 7. Кругооборот і оборот капіталу. Лекція 1. Рух капіталу, його стадії і форми. Функціональні форми капіталу
 Сущность и виды предпринимательства
 Экономический рост и институты
 Национальная экономика: цели и результаты развития
 Инновационный процесс: сущность, этапы, модели
 Экономика родного края
 Глобалізація. Види глобалізації
 Финансовая система и финансовая политика государства
 Анализ эффективности инструментов государственного регулирования рынка труда в РФ и ЕС
 Внутренняя среда организации
 США в глобальной экономике и роли в странах АТР
 Теоритические основы устойчивого развития территорий
 Генезис основных бизнес-моделей в экономике медиа
 Історія розвитку стандартизації у різних країнах світу
 Мониторинг социально-экономических показателей развития города Тамбова
 Нұрлы жол – Нұрлы болашаққа бастар жол