- International business management. Course revision

Содержание
- 2. COURSE REVISION The following topics highlight the prime learning points for the course They are not
- 3. QUESTION 1: COMPULSORY You must do Question 1 For the remaining questions you choose 3 out
- 4. TOPIC 1: ECONOMIC RISK ANALYSIS FOR EMERGING ECONOMIES
- 5. ECONOMIC RISK ANALYSIS (ERA) IMF uses quantitative analysis for evaluating economies Economic risk is present in
- 6. FINDING THE DATA Most of the data is available from the World Bank The data is
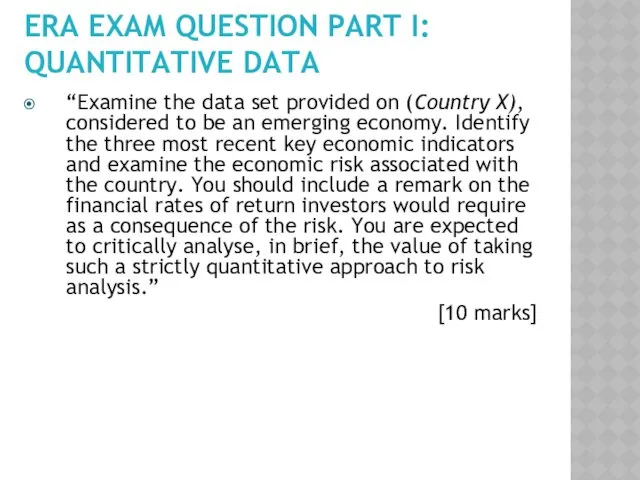
- 7. ERA EXAM QUESTION PART I: QUANTITATIVE DATA “Examine the data set provided on (Country X), considered
- 8. 1. GDP GROWTH Question: is the economy growing at a sustainable rate? Answer: target 2.0-3.0% developed,
- 9. GDP GROWTH TARGETS Need to find a balance between a booming economy and recession An overheating
- 10. GDP RISK AND RETURN FOR EMERGING ECONOMIES Emerging economies can sustain high rates of growth as
- 11. 2: INFLATION Question: Are prices under control? Answer: compare the inflation with the 2.0% target Various
- 12. INFLATION AND RISK/RETURN Most central banks are targeting 2.0% CPI inflation Some central banks will accept
- 13. 3: CURRENT ACCOUNT DEFICIT – CAD Question: how great is the short-term trade burden? Answer: compare
- 14. CURRENT ACCOUNT DEFICIT – CAD For developing economies CAD can be a cause for concern Fall
- 15. CRITICISM OF THE IMF QUANTITATIVE APPROACH Many feel that the IMF style of analysis does more
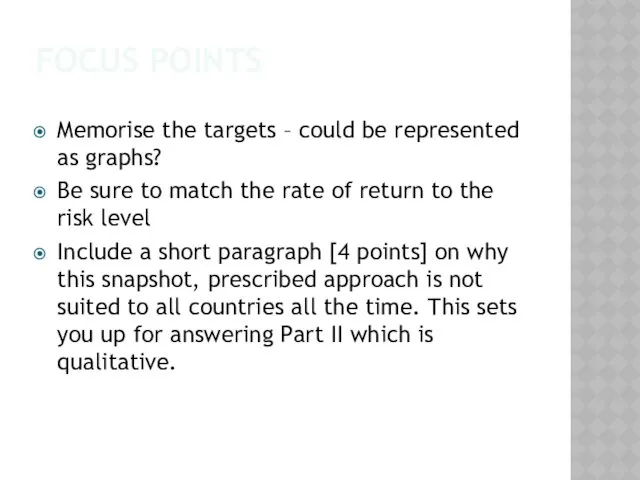
- 16. FOCUS POINTS Memorise the targets – could be represented as graphs? Be sure to match the
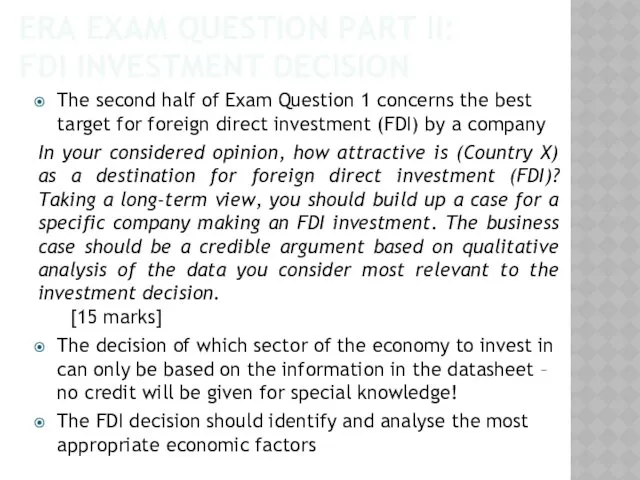
- 17. ERA EXAM QUESTION PART II: FDI INVESTMENT DECISION The second half of Exam Question 1 concerns
- 18. FACTORS INFLUENCING FDI The economic factors that are appropriate to the FDI decision depend upon the
- 19. GREENWICH MNEMONIC - GLIFTS GLIFTS is only there to help you remember – it should not
- 20. USING GLIFTS G – GDP per capita growth rate (the trend). May indicate a growing productivity,
- 21. OTHER INTERESTING DATA… An entrepreneur will browse data looking for items of interest This is when
- 22. SOURCES World Bank IMF (for CAD/GDP) – latest World Economic Outlook report Australia CAD/GDP – Mr
- 23. FOCUS POINTS Prepare a range of case study companies in advance and think about what they
- 24. QUESTIONS 2-6: UNCOMPULSORY 5 questions, you choose 3 of them Each requires a mini-essay answer: Start
- 25. TOPIC 2: RISK & UNCERTAINTY
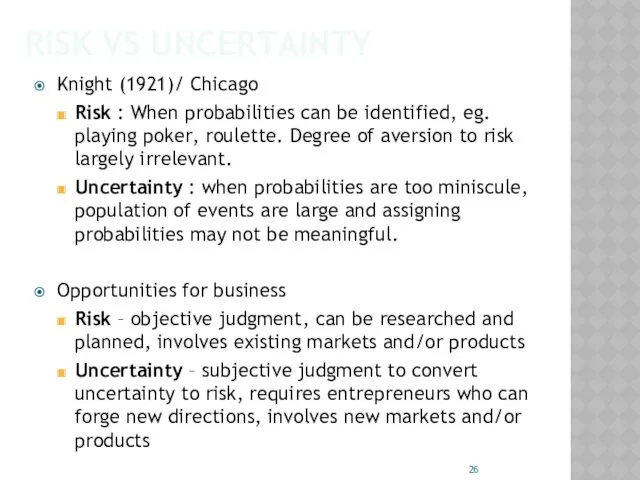
- 26. RISK VS UNCERTAINTY Knight (1921)/ Chicago Risk : When probabilities can be identified, eg. playing poker,
- 27. TYPES OF UNCERTAINTY Level 1 : past predictive, trend analysis Predicting the demand for pizzas during
- 28. UNCERTAINTY TYPES COMPARED… Pizza demand Technology possibilities Product plan Election
- 29. RISK AND PLANNING Hope of success >>>> Assured Failure Assured Success No Risk No Risk 100/0
- 30. THE RISK/UNCERTAINTY CALCULUS Scale of potential harm War vs local fire Likelihood of occurrence Earthquake vs
- 31. RISK, UNCERTAINTY AND REWARD Risk is the strategist’s best friend The degree of risk is compensated
- 32. RISK ANALYSIS STEPS Step I : Sorting Environmental Data Performance : GDP, Inflation, BoP etc Strategy:
- 33. FOCUS POINTS You should be aware that risk is a normal part of the business environment
- 34. TOPIC 3: INTERNATIONAL TRADE
- 35. MERCANTALISM Principal: wealth based on holdings of gold The Concept: Trade is a zero sum game:
- 36. ADAM SMITH AND ABSOLUTE ADVANTAGE Principle: Adam Smith – both nations can gain from trade The
- 37. COMPARATIVE ADVANTAGE Principle: Ricardo (1817) – even a country with all absolute advantages is comparatively better
- 38. MERCANTILISM AND DEVELOPING ECONOMIES Mercantilism allows a country to build up industry based on export sales
- 39. FOCUS POINTS Familiarise yourself with the temptations of mercantilism and how countries think they can gain
- 40. TOPIC 4: FIVE FORCES MODEL
- 41. PORTER’S PERSPECTIVE Asserted that industry attractiveness is not a function of specific technology or product attributes
- 42. THE 5 FORCES MODEL All forces work together to shape the competitive landscape of the industry
- 43. THE BARGAINING POWER OF BUYERS The extent to which the buyer can influence the prices Can
- 44. POWER OF SUPPLIERS The extent to which the suppliers can influence the cost of production in
- 45. THREAT OF NEW ENTRANTS The threat from the market getting flooded with new players Can happen
- 46. THREAT OF SUBSTITUTES The ability to use another product for similar use Can happen when… Different
- 47. EXTENT OF INTER-FIRM COMPETITION An increase in the number of firms will increase competitive rivalry… will
- 48. FACTORS NOT FORCES The competitive forces impact on profitability – some items are factors but do
- 49. ANDREW GROVE: SIX FORCES MODEL Model adds role of complementors to the Five Forces model Complementors
- 50. FOCUS POINTS Consider case studies that don’t just illustrate how the model works but reveal additional
- 51. TOPIC 5: INTERNATIONAL MARKETING
- 52. KOTLER: THE 4 PS Product Value of the product to the consumer Adaptations New product development
- 53. 1. PRODUCT – DELIVERING VALUE Legal requirement Safety – pharmaceuticals Environment – cars Non-tariff barriers Cultural
- 54. NEW PRODUCT DEVELOPMENT (NPD) Rate of NPD greater in countries where It is an R&D intensive
- 55. 2: PRICE – INTERNATIONAL ISSUES Government controls Minimum and maximum prices Prohibition against dumping Taxation Market
- 56. PRICING RISK Inflation A “paper profit” may be pumped up by inflation on inventory Tax is
- 57. 3: PROMOTION Push strategy Emphasizes personal selling within the distribution chain Requires intense use of a
- 58. 4: PLACE Different distribution systems due to Country-specific differences Consumer spending habits Retail concentration Choosing the
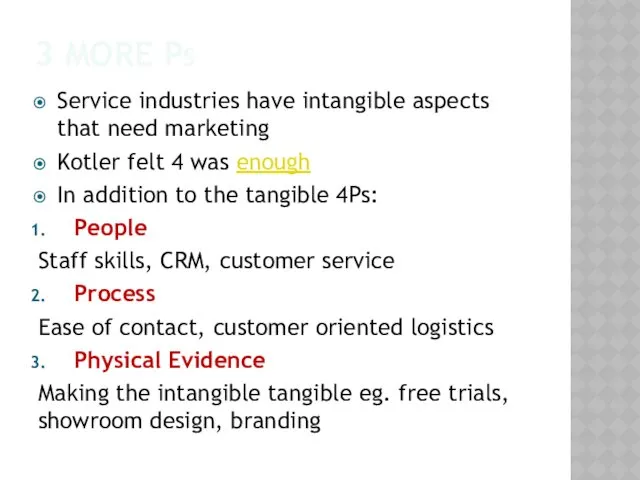
- 59. 3 MORE PS Service industries have intangible aspects that need marketing Kotler felt 4 was enough
- 60. FOCUS POINTS You need to do more than illustrate how the 4Ps work, you need to
- 61. TOPIC 6: STRATEGIC ALLIANCES
- 62. STRATEGIC ALLIANCES TYPES Joint Venture - JV Partners create a separate firm The joint venture shares
- 63. 1: JOINT VENTURE Definition The term “joint venture” tends to describe the purpose of the alliance
- 64. 2: EQUITY STRATEGIC ALLIANCE Definition Partner firms take different sized shares Often used for a new
- 65. 3: NON-EQUITY STRATEGIC ALLIANCE Definition Partner firms share no ownership interest No separate firm is created
- 66. 4: GLOBAL STRATEGIC ALLIANCE Definition Partner firms share no ownership interest No separate firm is created
- 68. Скачать презентацию
COURSE REVISION
The following topics highlight the prime learning points for the
COURSE REVISION
The following topics highlight the prime learning points for the

QUESTION 1: COMPULSORY
You must do Question 1
For the remaining questions you
QUESTION 1: COMPULSORY
You must do Question 1
For the remaining questions you
TOPIC 1: ECONOMIC RISK ANALYSIS FOR EMERGING ECONOMIES
TOPIC 1: ECONOMIC RISK ANALYSIS FOR EMERGING ECONOMIES

ECONOMIC RISK ANALYSIS (ERA)
IMF uses quantitative analysis for evaluating economies
Economic risk
ECONOMIC RISK ANALYSIS (ERA)
IMF uses quantitative analysis for evaluating economies
Economic risk
FINDING THE DATA
Most of the data is available from the World
FINDING THE DATA
Most of the data is available from the World
ERA EXAM QUESTION PART I: QUANTITATIVE DATA
“Examine the data set provided
ERA EXAM QUESTION PART I: QUANTITATIVE DATA
“Examine the data set provided
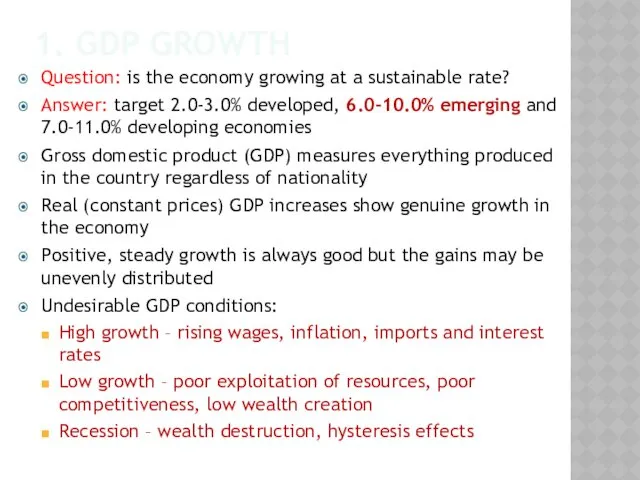
1. GDP GROWTH
Question: is the economy growing at a sustainable rate?
Answer:
1. GDP GROWTH
Question: is the economy growing at a sustainable rate?
Answer:
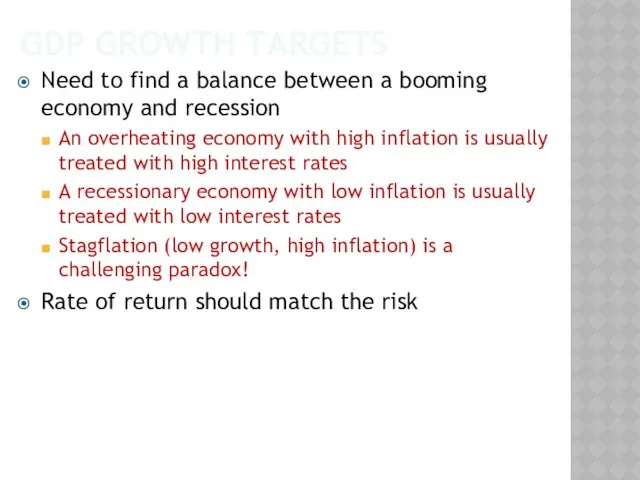
GDP GROWTH TARGETS
Need to find a balance between a booming economy
GDP GROWTH TARGETS
Need to find a balance between a booming economy
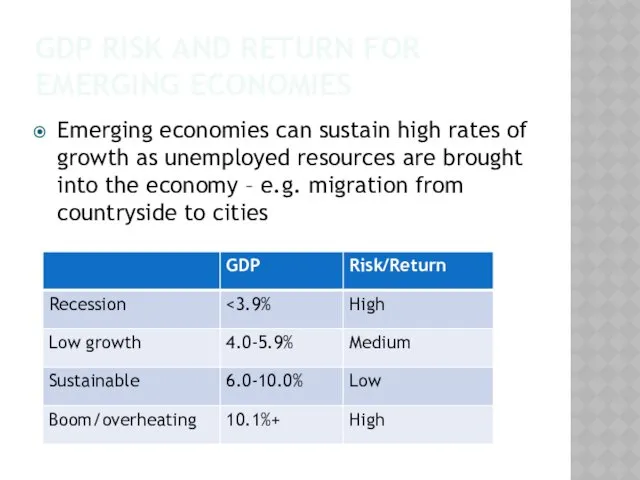
GDP RISK AND RETURN FOR EMERGING ECONOMIES
Emerging economies can sustain high
GDP RISK AND RETURN FOR EMERGING ECONOMIES
Emerging economies can sustain high
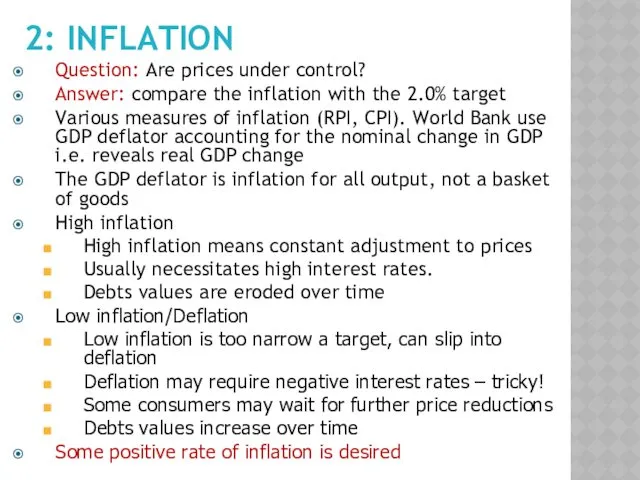
2: INFLATION
Question: Are prices under control?
Answer: compare the inflation with the
2: INFLATION
Question: Are prices under control?
Answer: compare the inflation with the

INFLATION AND RISK/RETURN
Most central banks are targeting 2.0% CPI inflation
Some central
INFLATION AND RISK/RETURN
Most central banks are targeting 2.0% CPI inflation
Some central

3: CURRENT ACCOUNT DEFICIT – CAD
Question: how great is the short-term
3: CURRENT ACCOUNT DEFICIT – CAD
Question: how great is the short-term
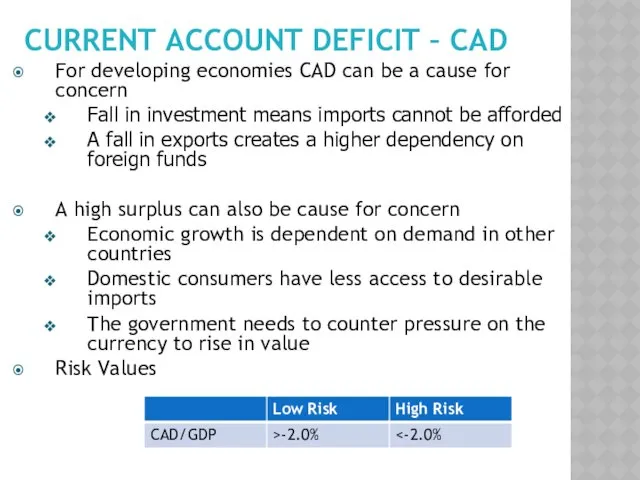
CURRENT ACCOUNT DEFICIT – CAD
For developing economies CAD can be a
CURRENT ACCOUNT DEFICIT – CAD
For developing economies CAD can be a

CRITICISM OF THE IMF QUANTITATIVE APPROACH
Many feel that the IMF style
CRITICISM OF THE IMF QUANTITATIVE APPROACH
Many feel that the IMF style
FOCUS POINTS
Memorise the targets – could be represented as graphs?
Be sure
FOCUS POINTS
Memorise the targets – could be represented as graphs?
Be sure
ERA EXAM QUESTION PART II:
FDI INVESTMENT DECISION
The second half of
ERA EXAM QUESTION PART II:
FDI INVESTMENT DECISION
The second half of

FACTORS INFLUENCING FDI
The economic factors that are appropriate to the FDI
FACTORS INFLUENCING FDI
The economic factors that are appropriate to the FDI

GREENWICH MNEMONIC - GLIFTS
GLIFTS is only there to help you remember
GREENWICH MNEMONIC - GLIFTS
GLIFTS is only there to help you remember

USING GLIFTS
G – GDP per capita growth rate (the trend). May
USING GLIFTS
G – GDP per capita growth rate (the trend). May

OTHER INTERESTING DATA…
An entrepreneur will browse data looking for items of
OTHER INTERESTING DATA…
An entrepreneur will browse data looking for items of

SOURCES
World Bank
IMF (for CAD/GDP) – latest World Economic Outlook report
Australia CAD/GDP
SOURCES
World Bank
IMF (for CAD/GDP) – latest World Economic Outlook report
Australia CAD/GDP

FOCUS POINTS
Prepare a range of case study companies in advance and
FOCUS POINTS
Prepare a range of case study companies in advance and

QUESTIONS 2-6: UNCOMPULSORY
5 questions, you choose 3 of them
Each requires a
QUESTIONS 2-6: UNCOMPULSORY
5 questions, you choose 3 of them
Each requires a

TOPIC 2: RISK & UNCERTAINTY
TOPIC 2: RISK & UNCERTAINTY
RISK VS UNCERTAINTY
Knight (1921)/ Chicago
Risk : When probabilities can be identified,
RISK VS UNCERTAINTY
Knight (1921)/ Chicago
Risk : When probabilities can be identified,

TYPES OF UNCERTAINTY
Level 1 : past predictive, trend analysis
Predicting the demand
TYPES OF UNCERTAINTY
Level 1 : past predictive, trend analysis
Predicting the demand

UNCERTAINTY TYPES COMPARED…
Pizza demand
Technology possibilities
Product plan
Election
UNCERTAINTY TYPES COMPARED…
Pizza demand
Technology possibilities
Product plan
Election
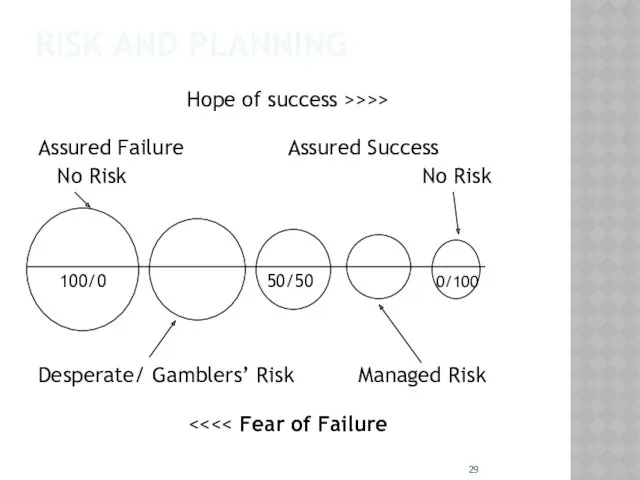
RISK AND PLANNING
Hope of success >>>>
Assured Failure Assured Success
No Risk
RISK AND PLANNING
Hope of success >>>>
Assured Failure Assured Success
No Risk
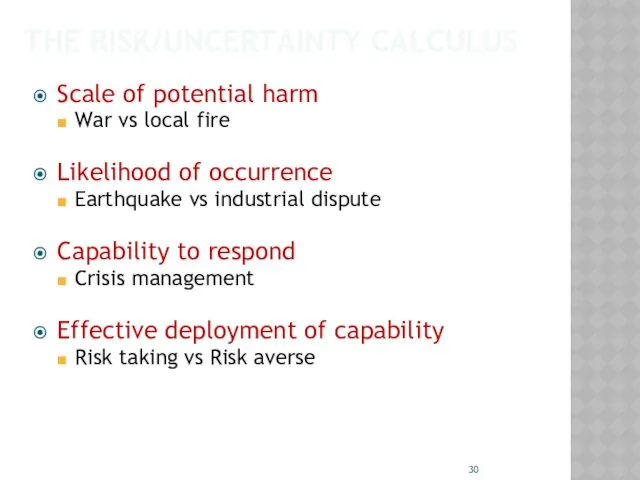
THE RISK/UNCERTAINTY CALCULUS
Scale of potential harm
War vs local fire
Likelihood of occurrence
Earthquake
THE RISK/UNCERTAINTY CALCULUS
Scale of potential harm
War vs local fire
Likelihood of occurrence
Earthquake

RISK, UNCERTAINTY AND REWARD
Risk is the strategist’s best friend
The degree of
RISK, UNCERTAINTY AND REWARD
Risk is the strategist’s best friend
The degree of
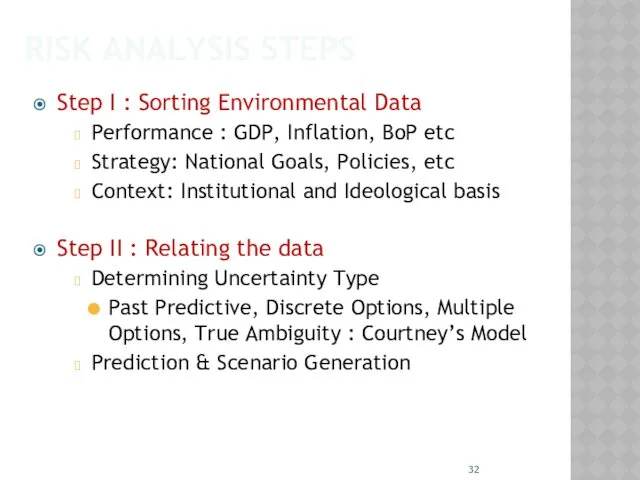
RISK ANALYSIS STEPS
Step I : Sorting Environmental Data
Performance : GDP, Inflation,
RISK ANALYSIS STEPS
Step I : Sorting Environmental Data
Performance : GDP, Inflation,

FOCUS POINTS
You should be aware that risk is a normal part
FOCUS POINTS
You should be aware that risk is a normal part

TOPIC 3: INTERNATIONAL TRADE
TOPIC 3: INTERNATIONAL TRADE
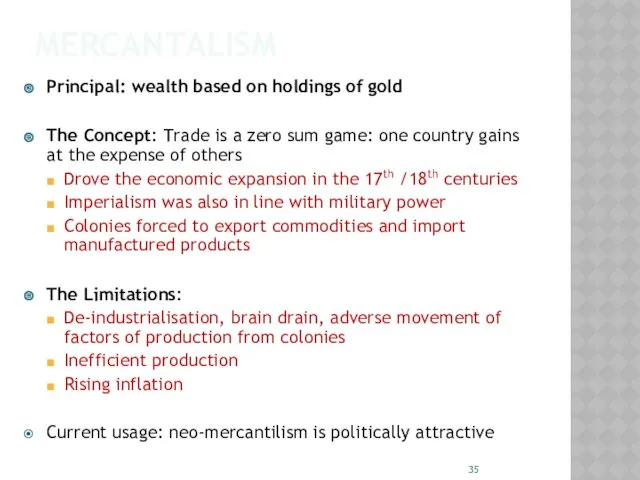
MERCANTALISM
Principal: wealth based on holdings of gold
The Concept: Trade is
MERCANTALISM
Principal: wealth based on holdings of gold
The Concept: Trade is
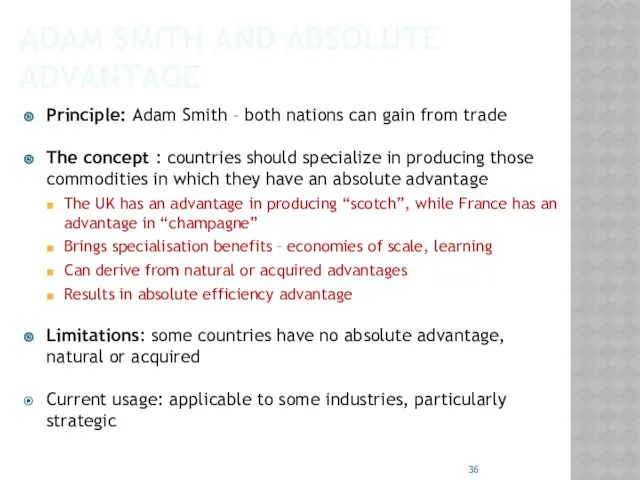
ADAM SMITH AND ABSOLUTE ADVANTAGE
Principle: Adam Smith – both nations can
ADAM SMITH AND ABSOLUTE ADVANTAGE
Principle: Adam Smith – both nations can

COMPARATIVE ADVANTAGE
Principle: Ricardo (1817) – even a country with all absolute
COMPARATIVE ADVANTAGE
Principle: Ricardo (1817) – even a country with all absolute
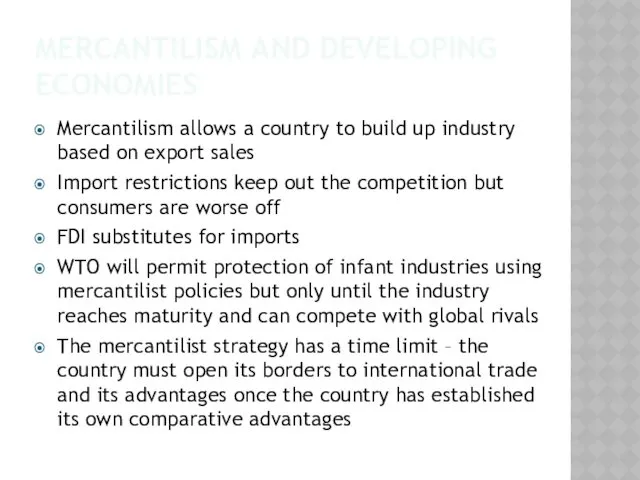
MERCANTILISM AND DEVELOPING ECONOMIES
Mercantilism allows a country to build up industry
MERCANTILISM AND DEVELOPING ECONOMIES
Mercantilism allows a country to build up industry

FOCUS POINTS
Familiarise yourself with the temptations of mercantilism and how countries
FOCUS POINTS
Familiarise yourself with the temptations of mercantilism and how countries

TOPIC 4: FIVE FORCES MODEL
TOPIC 4: FIVE FORCES MODEL

PORTER’S PERSPECTIVE
Asserted that industry attractiveness is not a function of specific
PORTER’S PERSPECTIVE
Asserted that industry attractiveness is not a function of specific

THE 5 FORCES MODEL
All forces work together to shape the competitive
THE 5 FORCES MODEL
All forces work together to shape the competitive
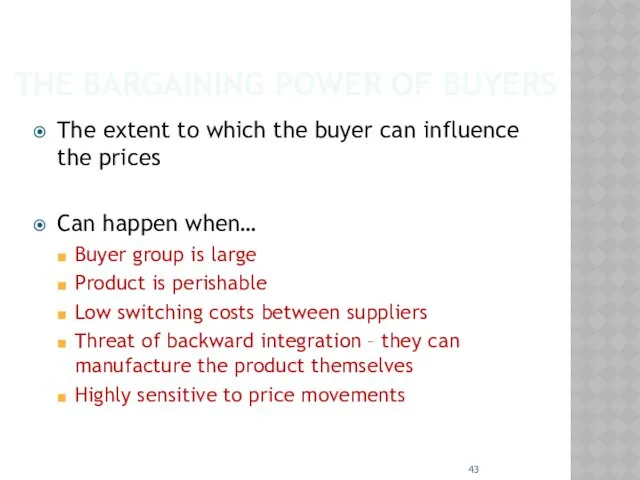
THE BARGAINING POWER OF BUYERS
The extent to which the buyer can
THE BARGAINING POWER OF BUYERS
The extent to which the buyer can
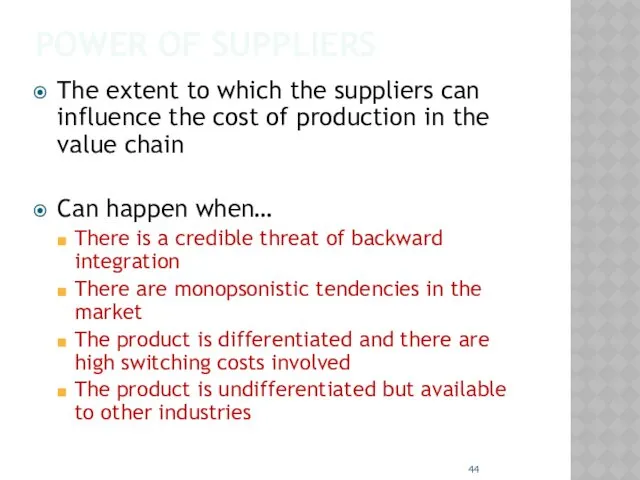
POWER OF SUPPLIERS
The extent to which the suppliers can influence the
POWER OF SUPPLIERS
The extent to which the suppliers can influence the
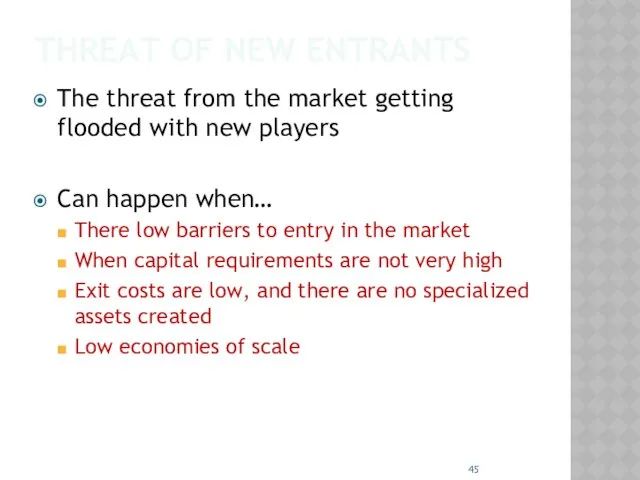
THREAT OF NEW ENTRANTS
The threat from the market getting flooded with
THREAT OF NEW ENTRANTS
The threat from the market getting flooded with

THREAT OF SUBSTITUTES
The ability to use another product for similar use
Can
THREAT OF SUBSTITUTES
The ability to use another product for similar use
Can
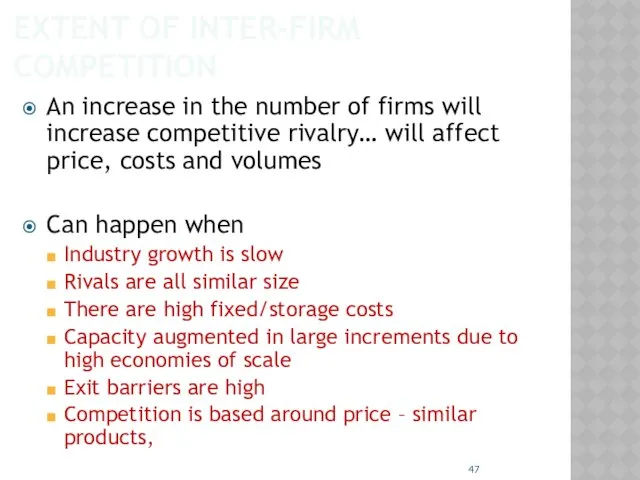
EXTENT OF INTER-FIRM COMPETITION
An increase in the number of firms
EXTENT OF INTER-FIRM COMPETITION
An increase in the number of firms

FACTORS NOT FORCES
The competitive forces impact on profitability – some items
FACTORS NOT FORCES
The competitive forces impact on profitability – some items

ANDREW GROVE: SIX FORCES MODEL
Model adds role of complementors to the
ANDREW GROVE: SIX FORCES MODEL
Model adds role of complementors to the

FOCUS POINTS
Consider case studies that don’t just illustrate how the model
FOCUS POINTS
Consider case studies that don’t just illustrate how the model

TOPIC 5: INTERNATIONAL MARKETING
TOPIC 5: INTERNATIONAL MARKETING

KOTLER: THE 4 PS
Product
Value of the product to the consumer
Adaptations
New product
KOTLER: THE 4 PS
Product
Value of the product to the consumer
Adaptations
New product
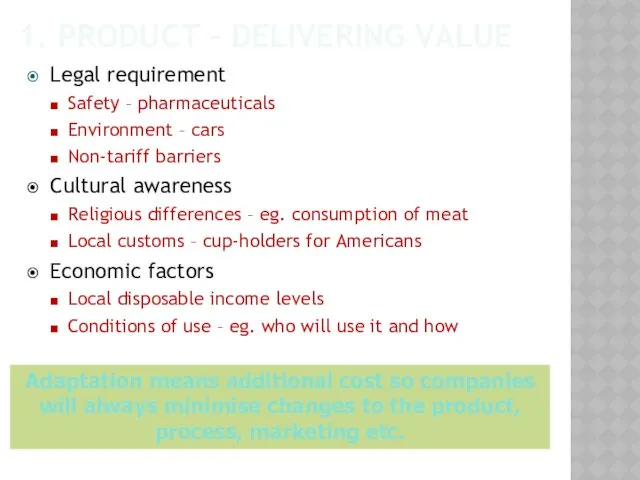
1. PRODUCT – DELIVERING VALUE
Legal requirement
Safety – pharmaceuticals
Environment – cars
Non-tariff barriers
Cultural
1. PRODUCT – DELIVERING VALUE
Legal requirement
Safety – pharmaceuticals
Environment – cars
Non-tariff barriers
Cultural
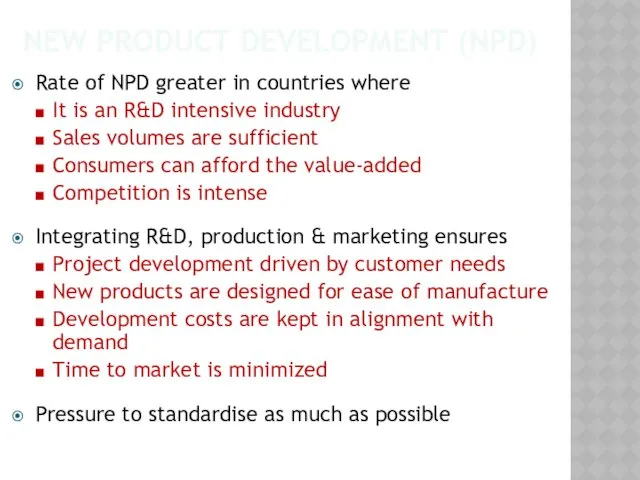
NEW PRODUCT DEVELOPMENT (NPD)
Rate of NPD greater in countries where
It is
NEW PRODUCT DEVELOPMENT (NPD)
Rate of NPD greater in countries where
It is

2: PRICE – INTERNATIONAL ISSUES
Government controls
Minimum and maximum prices
Prohibition against dumping
Taxation
Market
2: PRICE – INTERNATIONAL ISSUES
Government controls
Minimum and maximum prices
Prohibition against dumping
Taxation
Market

PRICING RISK
Inflation
A “paper profit” may be pumped up by inflation on
PRICING RISK
Inflation
A “paper profit” may be pumped up by inflation on

3: PROMOTION
Push strategy
Emphasizes personal selling within the distribution chain
Requires intense
3: PROMOTION
Push strategy
Emphasizes personal selling within the distribution chain
Requires intense

4: PLACE
Different distribution systems due to
Country-specific differences
Consumer spending habits
Retail concentration
Choosing the
4: PLACE
Different distribution systems due to
Country-specific differences
Consumer spending habits
Retail concentration
Choosing the
3 MORE PS
Service industries have intangible aspects that need marketing
Kotler felt
3 MORE PS
Service industries have intangible aspects that need marketing
Kotler felt
FOCUS POINTS
You need to do more than illustrate how the 4Ps
FOCUS POINTS
You need to do more than illustrate how the 4Ps
TOPIC 6: STRATEGIC ALLIANCES
TOPIC 6: STRATEGIC ALLIANCES

STRATEGIC ALLIANCES TYPES
Joint Venture - JV
Partners create a separate firm
The joint
STRATEGIC ALLIANCES TYPES
Joint Venture - JV
Partners create a separate firm
The joint

1: JOINT VENTURE
Definition
The term “joint venture” tends to describe the purpose
1: JOINT VENTURE
Definition
The term “joint venture” tends to describe the purpose
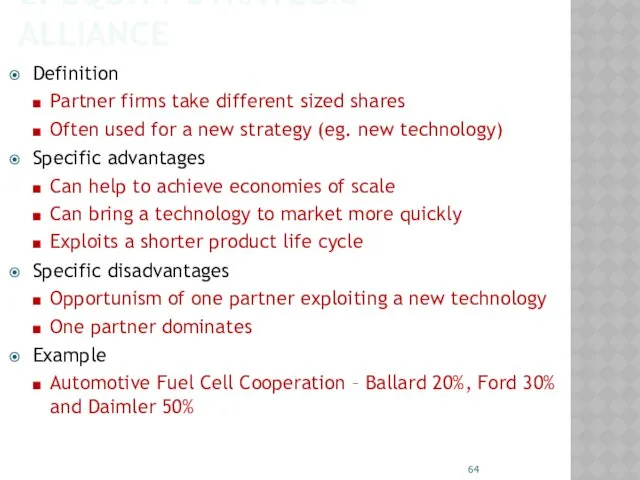
2: EQUITY STRATEGIC ALLIANCE
Definition
Partner firms take different sized shares
Often used for
2: EQUITY STRATEGIC ALLIANCE
Definition
Partner firms take different sized shares
Often used for
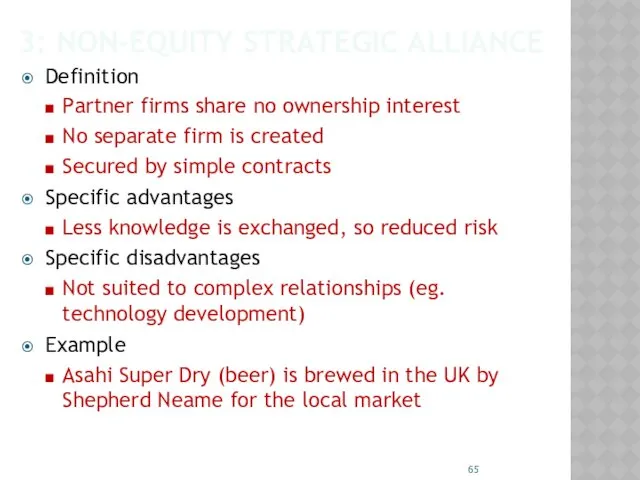
3: NON-EQUITY STRATEGIC ALLIANCE
Definition
Partner firms share no ownership interest
No separate firm
3: NON-EQUITY STRATEGIC ALLIANCE
Definition
Partner firms share no ownership interest
No separate firm
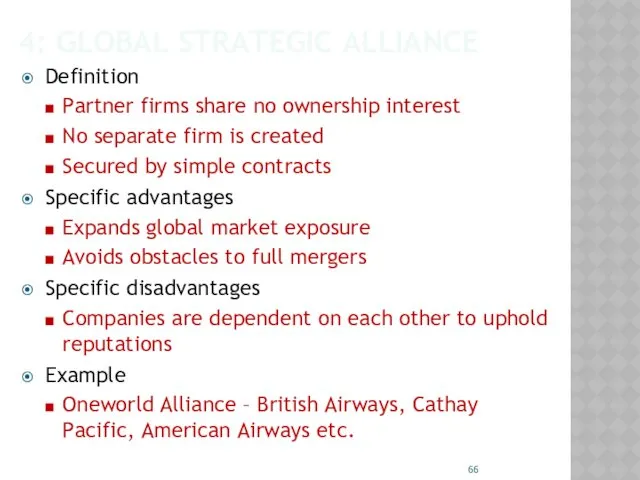
4: GLOBAL STRATEGIC ALLIANCE
Definition
Partner firms share no ownership interest
No separate firm
4: GLOBAL STRATEGIC ALLIANCE
Definition
Partner firms share no ownership interest
No separate firm
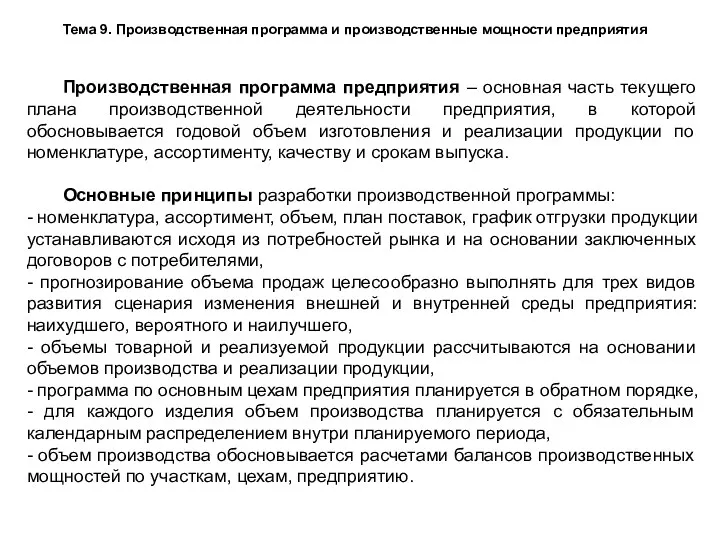 Производственная программа и производственные мощности предприятия. Тема 9
 Отчет о работе администрации Двуреченского сельского поселения за 2018 год и план работы на 2019 год
 Карл Маркс. Экономическая теория - марксизм
 О государственной поддержке малых форм хозяйствования агропромышленного комплекса Хабаровского края
 Территориальное планирование сельского поселения Утевка муниципального района Нефтегорский Самарской области
 Характеристика рыночного хозяйства Франции
 Эконометрика
 Сущность теории предельной полезности. Закон убывающей предельной полезности
 Рынок и рыночный механизм. Спрос и предложение
 Государственное регулирование кризисных ситуаций в экономике
 Теория фирмы. Теория поведения производителя
 Возможности территории опережающего социально-экономического развития (ТОСЭР) Благовещенск
 Технико-экономическое обоснование энергосберегающих мероприятий для электрических сетей 10-110 кВ
 Оңтүстік өңірдегі мал шаруашылығынан түскен өнімдер республика нарығында қаншалықты маңызды
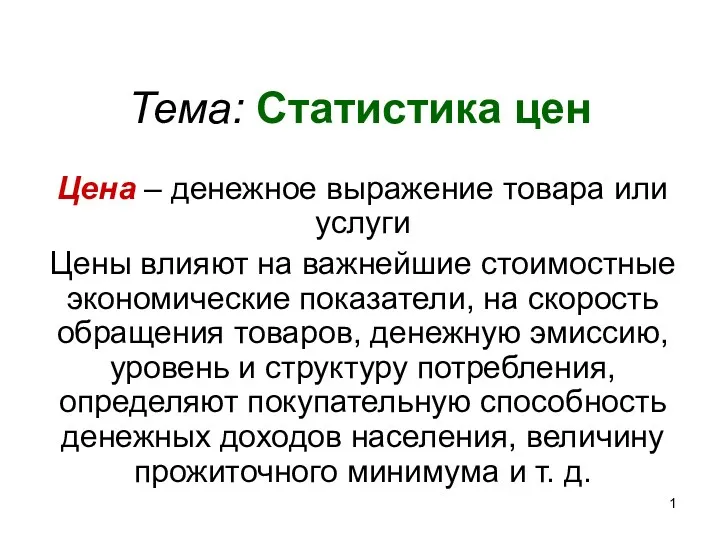 Статистика цен
 Разработка водного тура
 Мастер-класс от SATTAROVFAMILY. Обществознание. Разбор второй части варианта ЕГЭ
 How tax cuts stimulate the economy
 Лекция № 5. Вмешательство государства и общественное благосостояние
 Повышение эффективности предпринимательской деятельности малого предприятия на примере ООО Росстандарт
 Планирование труда
 Формирование и распределение доходов в рыночной экономике
 Порядок организации экспортного контроля
 Глобальні проблеми людства
 Кредитно-банковская система Объединенных Арабских Эмиратов (ОАЭ)
 Мировая экономика и международные экономические отношения
 Устойчивое развитие Тверской области
 Теории эластичности спроса и предложения