- International Trade: Theory and Policy Lecture 14

Содержание
- 2. Topics 9-11. International economic integration. International production factor migration. Lecture 13 International economic integration. International production
- 3. (3.1.) FDI: empirical evidence Figure 1: Inflow of Foreign Direct Investment, 1980-2009 (billions of dollars) Source:
- 4. FDI in transition countries of Central and Eastern Europe (CEEs) – comparison with the other countries
- 5. Enterprise performance: the role of foreign firms Literature: theory and empirics FDI: direct effects and productivity
- 6. Enterprise performance: the role of foreign firms Literature: empirics FDI may enhance productivity in the industry;
- 7. (3.2.) OLI-paradigm and MNC strategies (John Dunning) OLI paradigm (John Dunning) O – ownership advantages L
- 8. MNC strategies Market seeking (поиск рынка) Efficiency seeking (поиск эффективности ) Asset seeking (поиск активов )
- 9. (3.3.) The model of multi-plant firm: the choice between export an FDI (James Markusen) The ‘O’
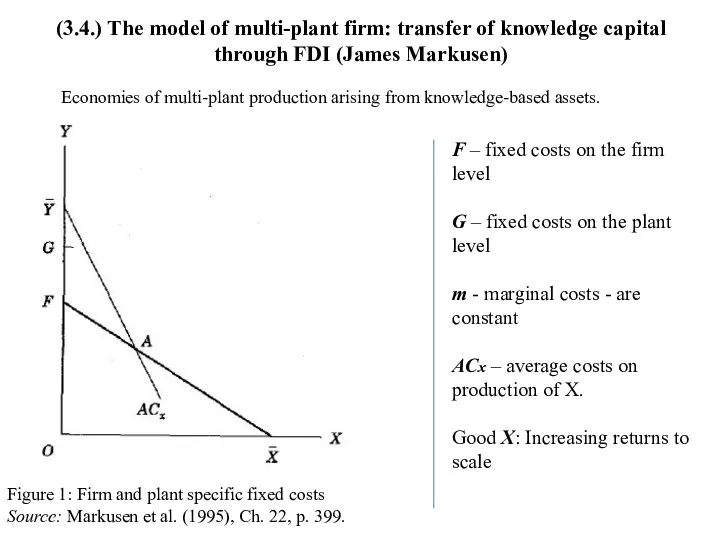
- 10. (3.4.) The model of multi-plant firm: transfer of knowledge capital through FDI (James Markusen) Figure 1:
- 11. Figure 2: Host country welfare Source: Markusen et al. (1995), Ch. 22, p. 401 ‘MNC has
- 12. Conclusions on the FDI effects Conclusions based on the model considered above FDI improves welfare in
- 13. Figure 3: FDI inflows in the Commonwealth of Independent States, including Russian Federation, 1990-2012 Source: World
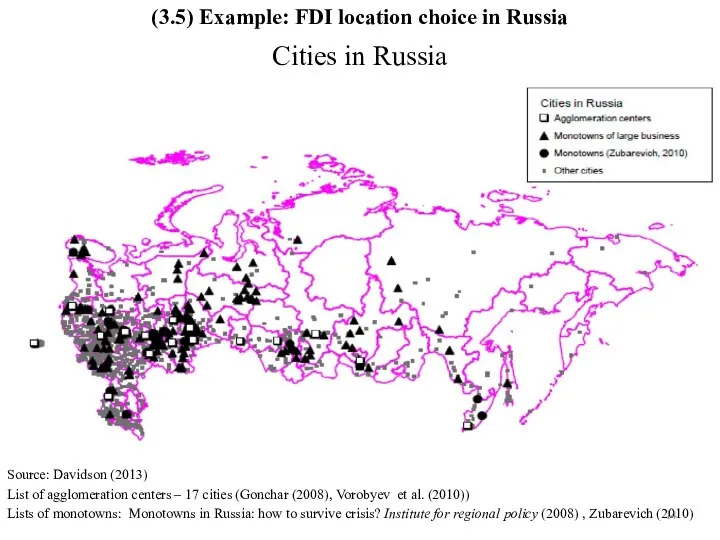
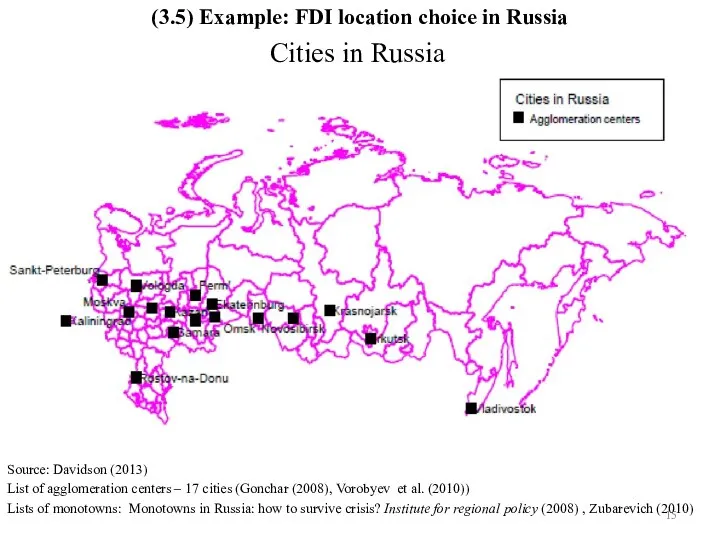
- 14. Source: Davidson (2013) List of agglomeration centers – 17 cities (Gonchar (2008), Vorobyev et al. (2010))
- 15. Cities in Russia Source: Davidson (2013) List of agglomeration centers – 17 cities (Gonchar (2008), Vorobyev
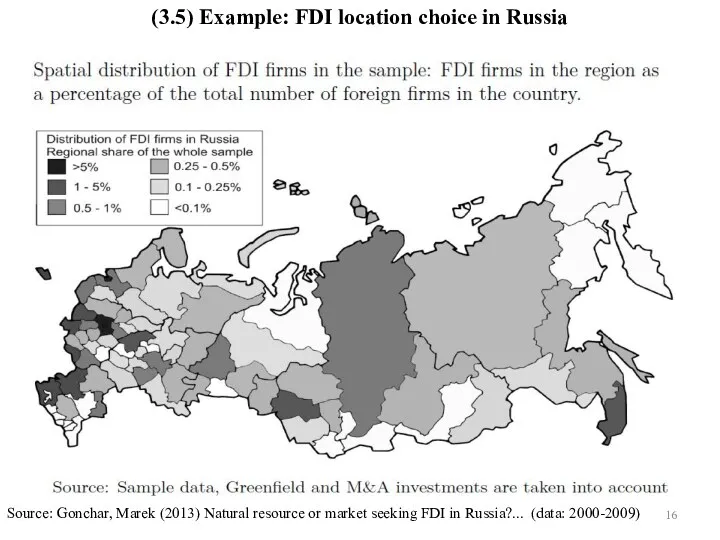
- 16. Source: Gonchar, Marek (2013) Natural resource or market seeking FDI in Russia?... (data: 2000-2009) (3.5) Example:
- 17. Location choice of enterprises in Russia
- 18. Source: Gonchar, Marek (2013) Natural resource or market seeking FDI in Russia?... (3.5) Example: FDI location
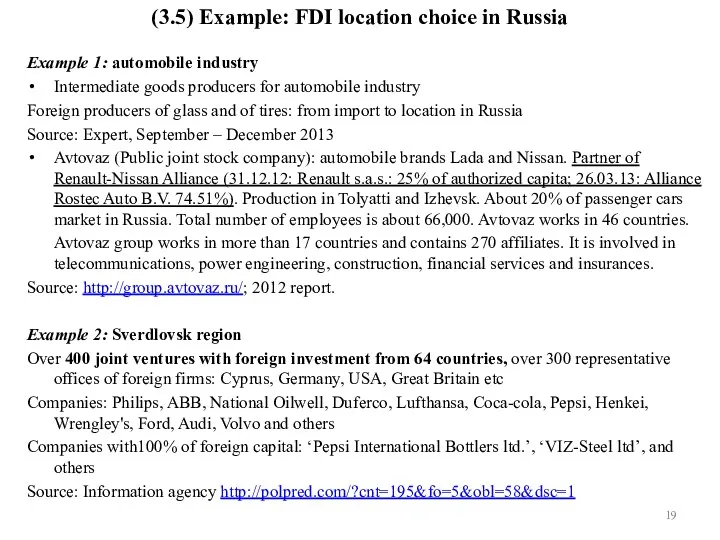
- 19. Example 1: automobile industry Intermediate goods producers for automobile industry Foreign producers of glass and of
- 20. Start revising for the exam. Office hours: Upon agreement (i.e. if you need additional consultation, tell
- 22. Скачать презентацию
Topics 9-11. International economic integration. International production factor migration.
Lecture 13
International
Topics 9-11. International economic integration. International production factor migration.
Lecture 13
International
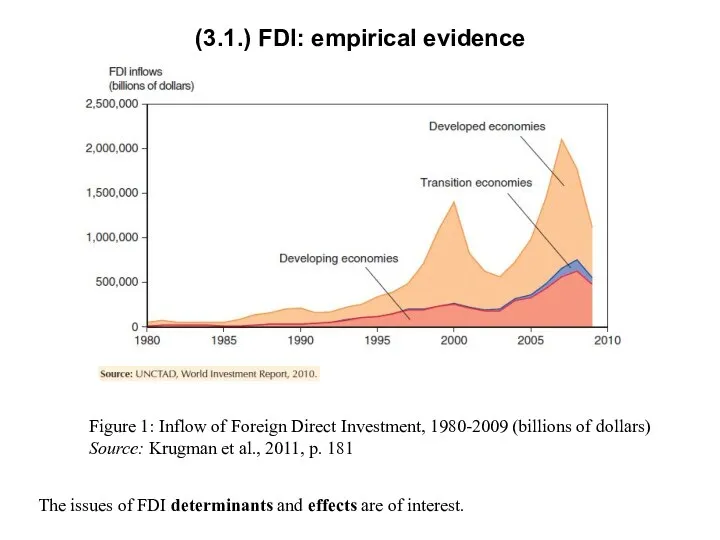
(3.1.) FDI: empirical evidence
Figure 1: Inflow of Foreign Direct Investment,
(3.1.) FDI: empirical evidence
Figure 1: Inflow of Foreign Direct Investment,
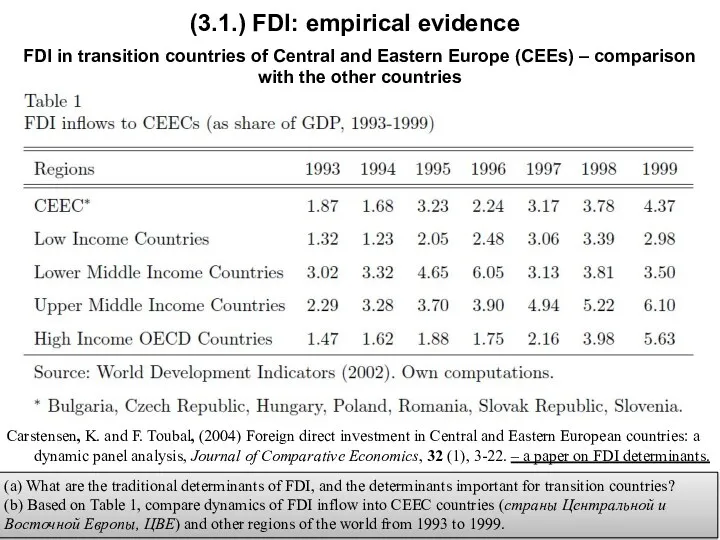
FDI in transition countries of Central and Eastern Europe (CEEs) –
FDI in transition countries of Central and Eastern Europe (CEEs) –
Enterprise performance: the role of foreign firms
Literature: theory and empirics
FDI: direct
Enterprise performance: the role of foreign firms
Literature: theory and empirics
FDI: direct
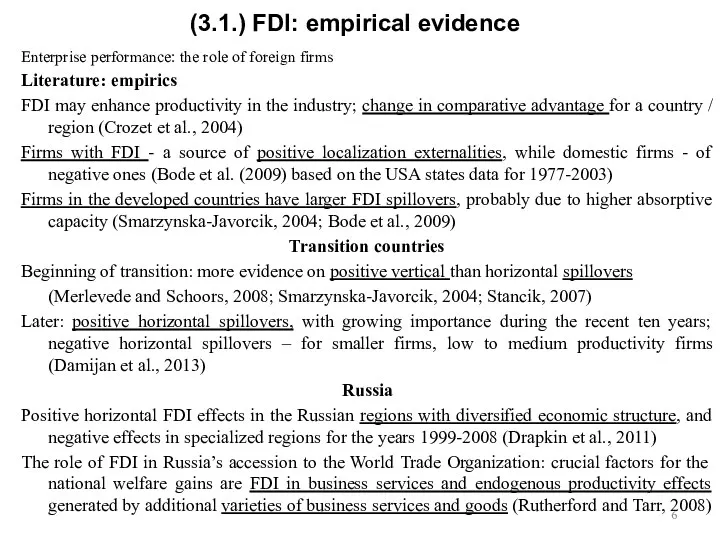
Enterprise performance: the role of foreign firms
Literature: empirics
FDI may enhance productivity
Enterprise performance: the role of foreign firms
Literature: empirics
FDI may enhance productivity
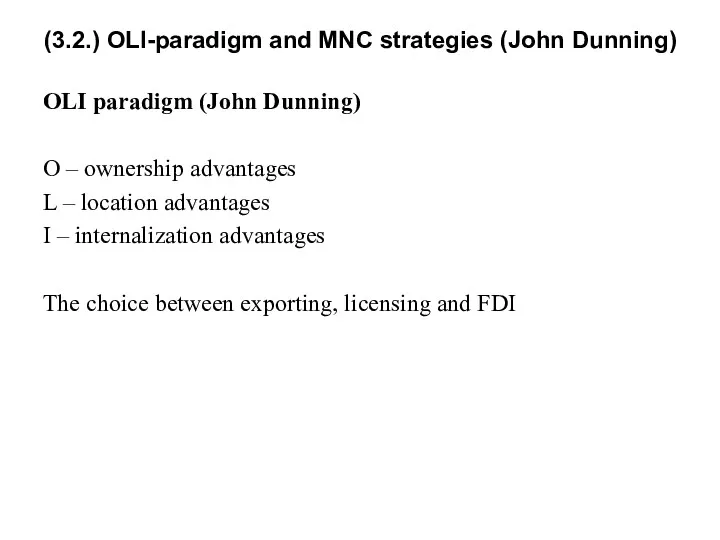
(3.2.) OLI-paradigm and MNC strategies (John Dunning)
OLI paradigm (John Dunning)
O –
(3.2.) OLI-paradigm and MNC strategies (John Dunning)
OLI paradigm (John Dunning)
O –
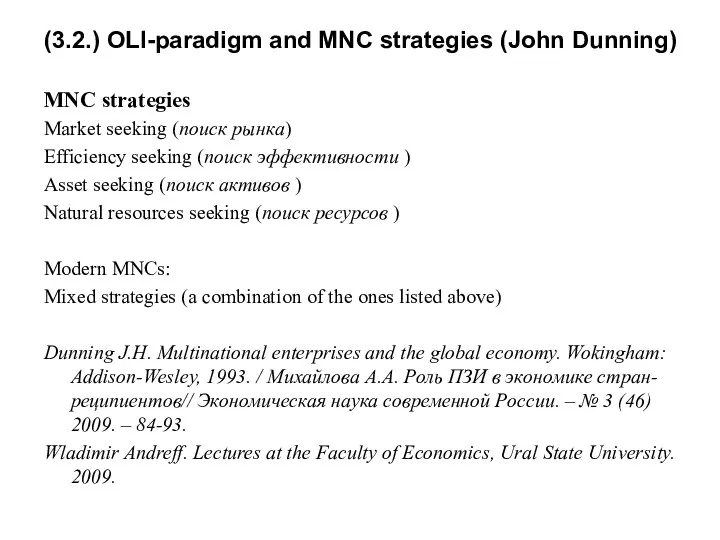
MNC strategies
Market seeking (поиск рынка)
Efficiency seeking (поиск эффективности )
Asset seeking (поиск
MNC strategies
Market seeking (поиск рынка)
Efficiency seeking (поиск эффективности )
Asset seeking (поиск
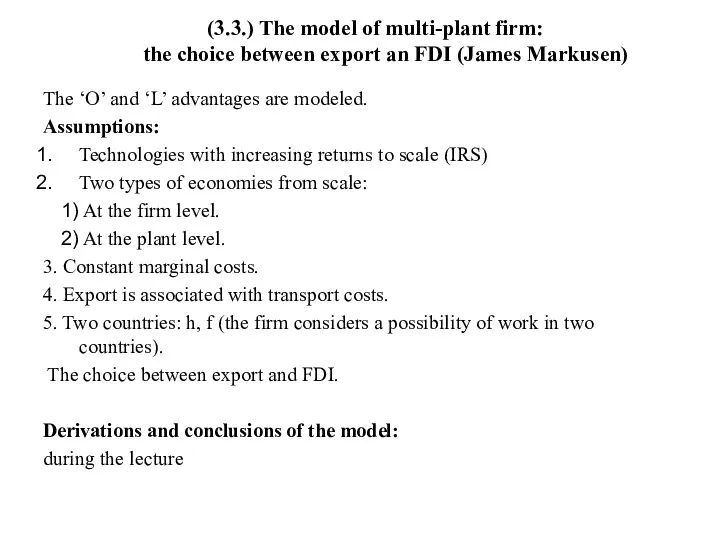
(3.3.) The model of multi-plant firm:
the choice between export an
(3.3.) The model of multi-plant firm: the choice between export an
(3.4.) The model of multi-plant firm: transfer of knowledge capital through
(3.4.) The model of multi-plant firm: transfer of knowledge capital through

Figure 2: Host country welfare
Source: Markusen et al. (1995), Ch. 22,
Figure 2: Host country welfare
Source: Markusen et al. (1995), Ch. 22,
Conclusions on the FDI effects
Conclusions based on the model considered above
FDI
Conclusions on the FDI effects
Conclusions based on the model considered above
FDI
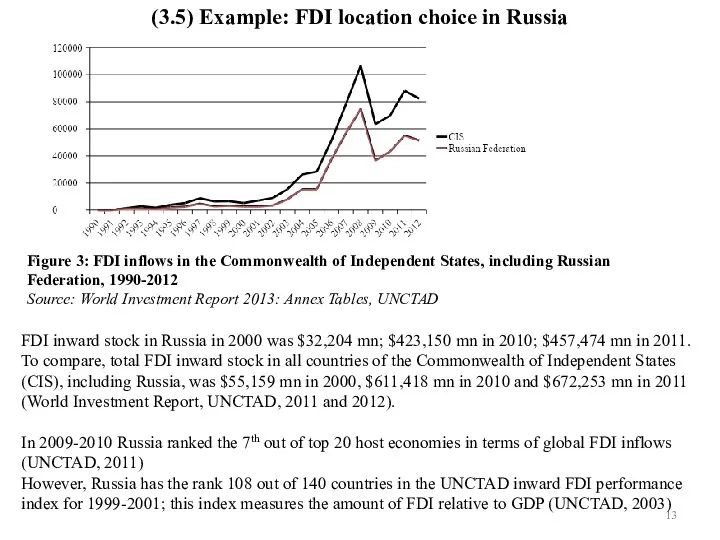
Figure 3: FDI inflows in the Commonwealth of Independent States, including
Figure 3: FDI inflows in the Commonwealth of Independent States, including
Source: Davidson (2013)
List of agglomeration centers – 17 cities (Gonchar (2008),
Source: Davidson (2013)
List of agglomeration centers – 17 cities (Gonchar (2008),
Cities in Russia
Source: Davidson (2013)
List of agglomeration centers – 17 cities
Cities in Russia
Source: Davidson (2013)
List of agglomeration centers – 17 cities
Source: Gonchar, Marek (2013) Natural resource or market seeking FDI in
Source: Gonchar, Marek (2013) Natural resource or market seeking FDI in
Location choice of enterprises in Russia
Location choice of enterprises in Russia

Source: Gonchar, Marek (2013) Natural resource or market seeking FDI in
Source: Gonchar, Marek (2013) Natural resource or market seeking FDI in
Example 1: automobile industry
Intermediate goods producers for automobile industry
Foreign producers of
Example 1: automobile industry
Intermediate goods producers for automobile industry
Foreign producers of
Start revising for the exam.
Office hours: Upon agreement (i.e. if you
Office hours: Upon agreement (i.e. if you
 Инфляция и антиинфляционная политика
 Фирма. Издержки производства и доход
 Инвестиционные проекты Костанайского района
 Развитие малого бизнеса в России: история и современность
 Восточное городское поселение Омутнинского района Кировской области
 Современная система ценообразования в энергетике. Оптовый рынок электроэнергии (мощности)
 Модели олигополии и их проявление в современной экономике
 Экономические кризисы в США
 Прогнозирование сезонных процессов
 Анализ эффективности деятельности предприятия
 Человек в мире экономических отношений
 Охрана труда. Социально-экономическое значение охраны труда. (Тема 1)
 Экономикалық өсудің жаңа классикалық және жаңа кейнcшілдік үлгілері
 Совокупный спрос и совокупное предложение. Модель AD-AS
 Действие основных экономических законов на фармацевтическом рынке
 Введение в дисциплину Географические основы управления
 Ұлттық экономикадағы қаржы және ақша-несие жүйесі
 Устойчивый экономический рост. Дивный новый мир
 Товарооборот, как основной показатель деятельности организации. Тема 2.2
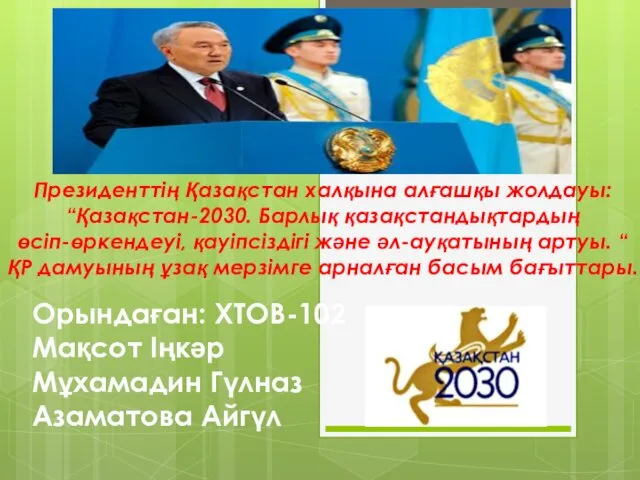 Қазақстан-2030
 Венчурные фирмы и их деятельность
 Организация, планирование и управление производством
 Основные макроэкономические показатели
 Тема 9_Открытая экономика при несовершенной мобильности капитала
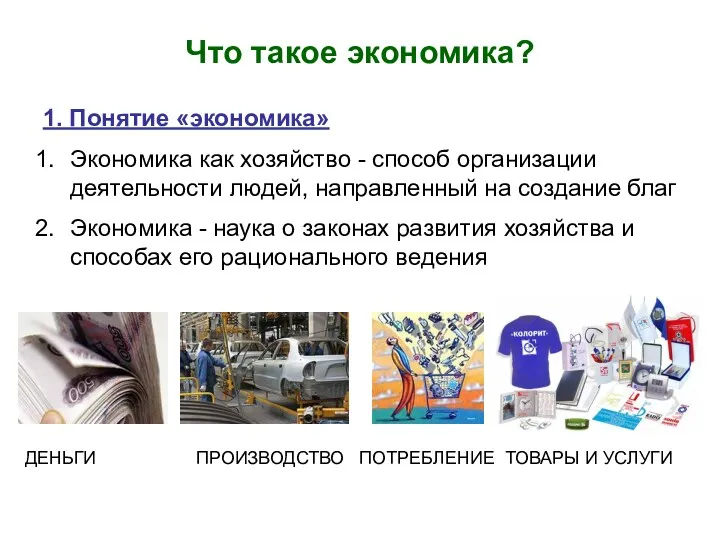 Понятие экономика
 Less developed countries rural development policy formation and process
 Сметное дело в строительстве. Модуль 1. Основы сметного дела
 Рынок ресурсов