- Macroeconomics N. Gregory Mankiw

Содержание
- 2. IN THIS CHAPTER, YOU WILL LEARN: . . . the meaning and measurement of the most
- 3. Gross Domestic Product: Expenditure and Income Two definitions: Total expenditure on domestically produced final goods and
- 4. The Circular Flow Income Labor Households Firms Goods Expenditure ($)
- 5. Value added Value added: The value of output minus the value of the intermediate goods used
- 6. NOW YOU TRY Identifying value added A farmer grows a bushel of wheat and sells it
- 7. Final goods, value added, and GDP GDP = value of final goods produced = sum of
- 8. The expenditure components of GDP consumption, C investment, I government spending, G net exports, NX An
- 9. Consumption (C) Definition: The value of all goods and services bought by households. Includes: Durable goods
- 10. U.S. Consumption, 2014 12,002 68.2 1,320 7.5 2,691 15.3 7,990 45.4 Consumption Durables Nondurables Services CHAPTER
- 11. Investment (I) Spending on capital, a physical asset used in future production Includes: Business fixed investment
- 12. U.S. Investment, 2014 Investment 2,905 16.5 Business fixed 2,244 12.8 Residential 566 3.2 94 0.5 Inventory
- 13. Investment vs. capital Note: Investment is spending on new capital. Example (assumes no depreciation): 1/1/2016: Economy
- 14. Stocks vs. Flows A stock is a quantity measured at a point in time. E.g., “The
- 15. Stocks vs. Flows: Examples CHAPTER 2 The Data of Macroeconomics
- 16. NOW YOU TRY Stock or Flow? The balance on your credit card statement How much time
- 17. Government spending (G) G includes all government spending on goods and services. G excludes transfer payments
- 18. U.S. Government Spending, 2014 CHAPTER 2 The Data of Macroeconomics
- 19. Net exports (NX) NX = exports – imports Exports: the value of goods and services sold
- 20. U.S. Net Exports, 2014 CHAPTER 2 The Data of Macroeconomics
- 21. Y = C + I + G + NX value of total output aggregate expenditure CHAPTER
- 22. NOW YOU TRY An expenditure-output puzzle? Suppose a firm: produces $10 million worth of final goods
- 23. Why output = expenditure Unsold output goes into inventory, and is counted as “inventory investment” .
- 24. GDP: An important and versatile concept We have now seen that GDP measures: total income total
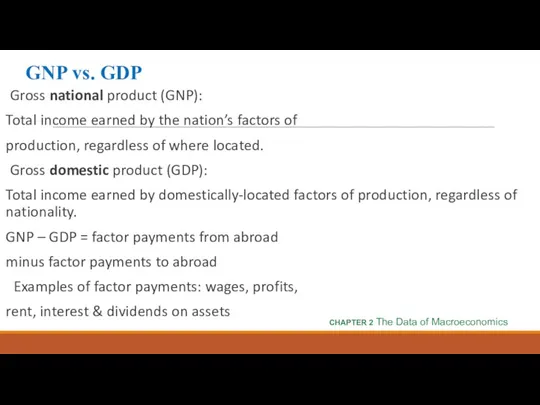
- 25. GNP vs. GDP Gross national product (GNP): Total income earned by the nation’s factors of production,
- 26. GNP vs. GDP Gross national product (GNP): Total income earned by the nation’s factors of production,
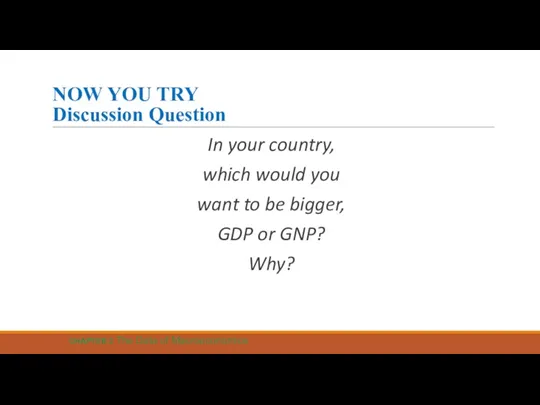
- 27. NOW YOU TRY Discussion Question In your country, which would you want to be bigger, GDP
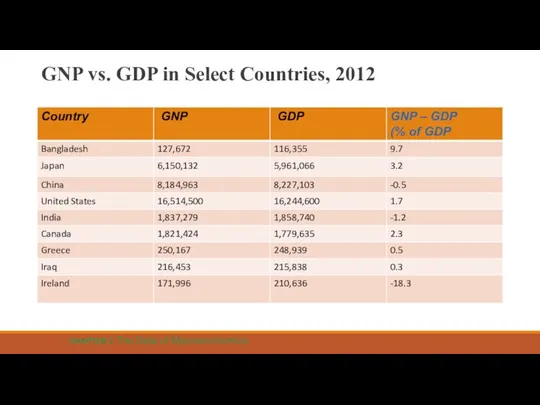
- 28. GNP vs. GDP in Select Countries, 2012 CHAPTER 2 The Data of Macroeconomics
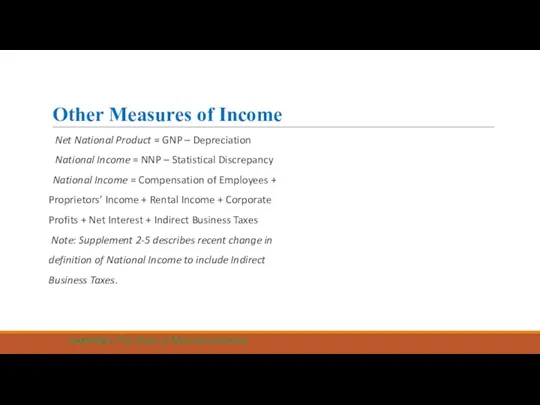
- 29. Other Measures of Income Net National Product = GNP – Depreciation National Income = NNP –
- 30. Components of National Income, 2014 CHAPTER 2 The Data of Macroeconomics Indirect Business Taxes and Other
- 31. Other Measures of Income Personal Income = National Income - Indirect Business Taxes - Corporate Profits
- 32. Real vs. nominal GDP GDP is the value of all final goods and services produced. Nominal
- 33. Solve the problem ???? Compute nominal GDP in each year. Compute real GDP in each year
- 34. Solution Nominal GDP is Ps × Qs the same year 2006: $46,200 = $30 × 900
- 35. Real GDP controls for inflation Changes in nominal GDP can be due to: changes in prices
- 36. U.S. Nominal and Real GDP, 1950-2006 CHAPTER 2 The Data of Macroeconomics Real GDP( in price
- 37. GDP deflator CHAPTER 2 The Data of Macroeconomics
- 38. Practice problem, part 2 Use your previous answers to compute the GDP deflator in each year.
- 39. Answers to practice problem, part 2 CHAPTER 2 The Data of Macroeconomics
- 40. Understanding the GDP deflator Example with 3 goods For good i = 1, 2, 3 Pit
- 41. Understanding the GDP deflator The GDP deflator is a weighted average of prices. The weight on
- 42. Working with percentage changes EX: If your hourly wage rises 5% and you work 7% more
- 43. Working with percentage changes EX: GDP deflator = 100 × NGDP/RGDP. If NGDP rises 9% and
- 44. Chain-weighted Real GDP Over time, relative prices change, so the base year should be updated periodically.
- 45. Consumer Price Index (CPI) A measure of the overall level of prices Published by the Bureau
- 46. How the BLS constructs the CPI Surveys consumers to determine composition of the typical consumer’s “basket”
- 47. Exercise: Compute the CPI The basket contains 20 pizzas and 10 compact discs. prices: pizza CDs
- 48. answers: cost of inflation basket CPI rate 2002 $350 100.0 n.a. 2003 370 105.7 5.7% 2004
- 49. The composition of the CPI’s “basket” CHAPTER 2 The Data of Macroeconomics
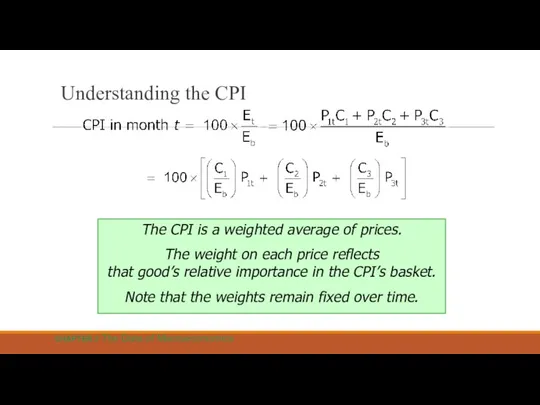
- 50. Understanding the CPI Example with 3 goods For good i = 1, 2, 3 Ci =
- 51. Understanding the CPI The CPI is a weighted average of prices. The weight on each price
- 52. Reasons why the CPI may overstate inflation Substitution bias: The CPI uses fixed weights, so it
- 53. The CPI’s bias The Boskin Panel’s “best estimate”: The CPI overstates the true increase in the
- 54. Discussion topic: If your grandmother receives Social Security, how is she affected by the CPI’s bias?
- 55. CPI vs. GDP deflator prices of capital goods included in GDP deflator (if produced domestically) excluded
- 56. Two measures of inflation 16 14 12 10 8 6 4 2 0 - 2 Percentage
- 57. Categories of the population employed working at a paid job unemployed not employed but looking for
- 58. Two important labor force concepts unemployment rate percentage of the labor force that is unemployed labor
- 59. Exercise: Compute labor force statistics U.S. adult population by group, May 2003 Number employed = 137.5
- 60. Answers: data: E = 137.5, U = 9.0, POP = 220.8 labor force L = E
- 61. Exercise: Compute percentage changes in labor force statistics Suppose the population increases by 1% the labor
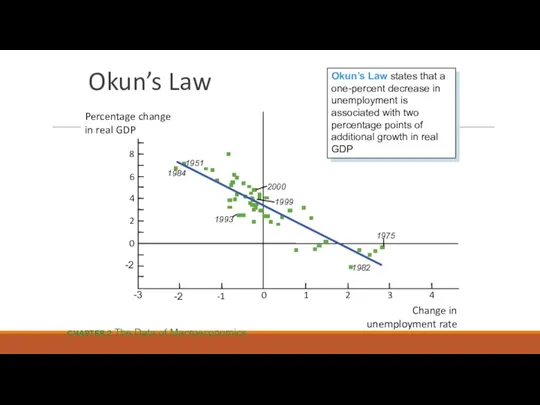
- 62. Employed workers help produce GDP, while unemployed workers do not. So one would expect a negative
- 63. Okun’s Law 1951 1984 1999 2000 1993 1982 1975 Change in unemployment rate 10 Percentage change
- 64. Chapter Summary Gross Domestic Product (GDP) measures both total income and total expenditure on the economy’s
- 66. Скачать презентацию
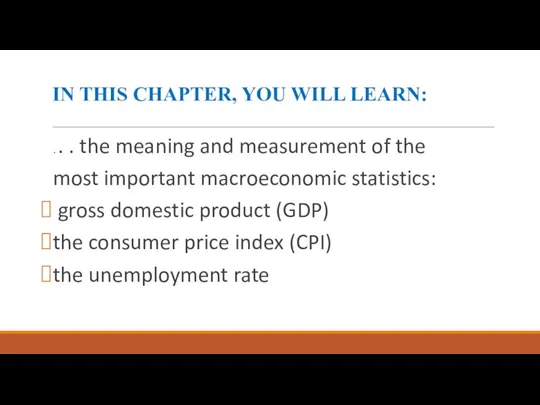
IN THIS CHAPTER, YOU WILL LEARN:
. . . the meaning and
IN THIS CHAPTER, YOU WILL LEARN:
. . . the meaning and
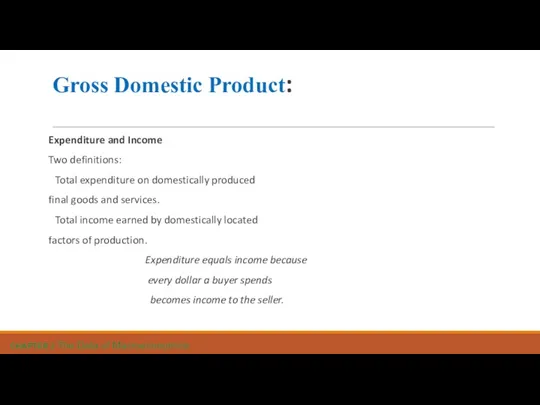
Gross Domestic Product:
Expenditure and Income
Two definitions:
Total expenditure on domestically produced
final
Gross Domestic Product:
Expenditure and Income
Two definitions:
Total expenditure on domestically produced
final
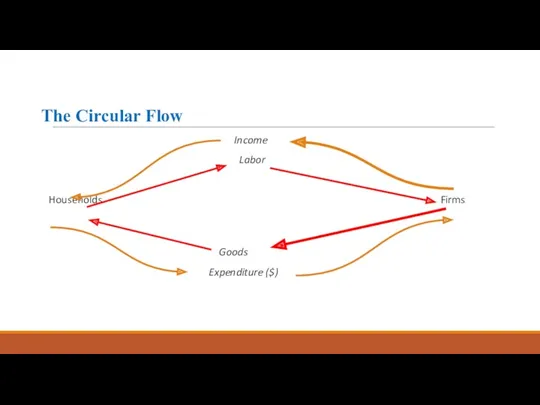
The Circular Flow
Income
Labor
Households Firms
Goods
Expenditure ($)
The Circular Flow
Income
Labor
Households Firms
Goods
Expenditure ($)
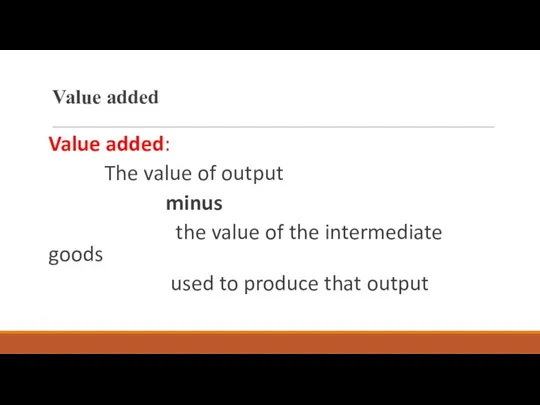
Value added
Value added:
The value of output
minus
the value
Value added
Value added:
The value of output
minus
the value
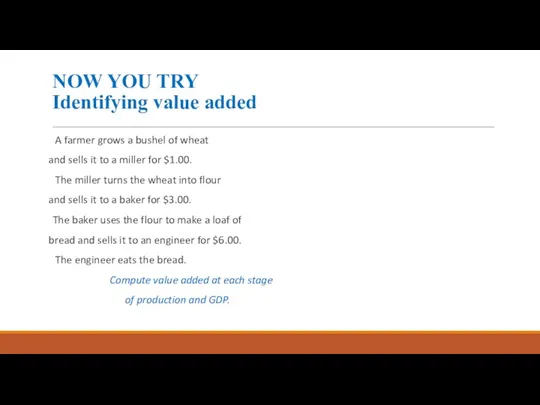
NOW YOU TRY
Identifying value added
A farmer grows a bushel of
NOW YOU TRY
Identifying value added
A farmer grows a bushel of
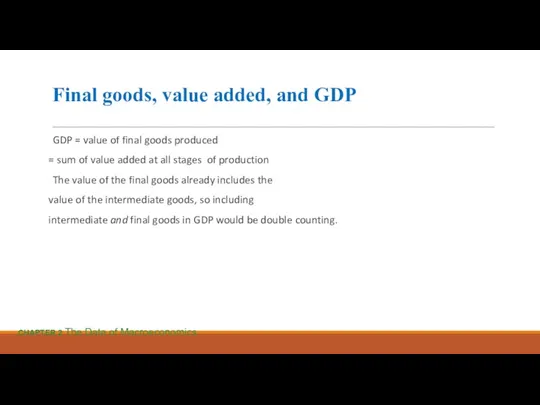
Final goods, value added, and GDP
GDP = value of final goods
Final goods, value added, and GDP
GDP = value of final goods
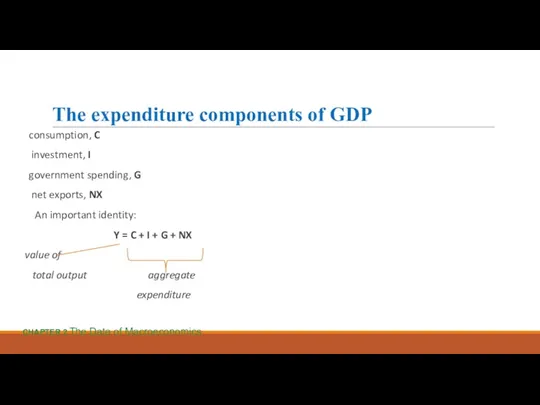
The expenditure components of GDP
consumption, C
investment, I
government spending, G
net
The expenditure components of GDP
consumption, C
investment, I
government spending, G
net
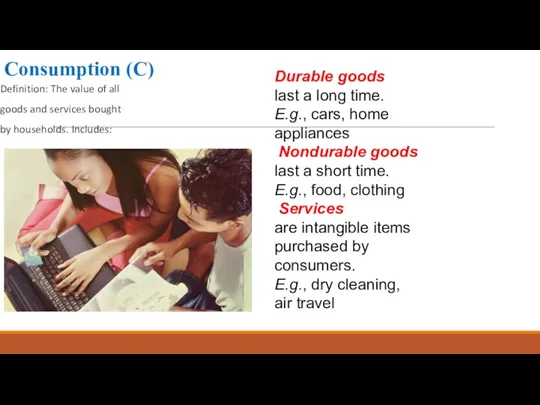
Consumption (C)
Definition: The value of all
goods and services bought
by households. Includes:
Durable
Consumption (C)
Definition: The value of all
goods and services bought
by households. Includes:
Durable
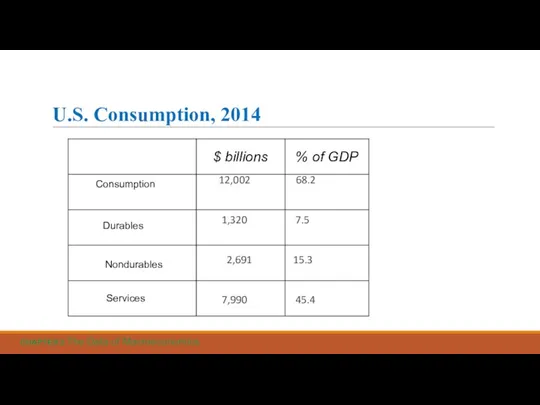
U.S. Consumption, 2014
12,002 68.2
1,320 7.5
2,691 15.3
7,990 45.4
Consumption
Durables
Nondurables
Services
CHAPTER
U.S. Consumption, 2014
12,002 68.2
1,320 7.5
2,691 15.3
7,990 45.4
Consumption
Durables
Nondurables
Services
CHAPTER
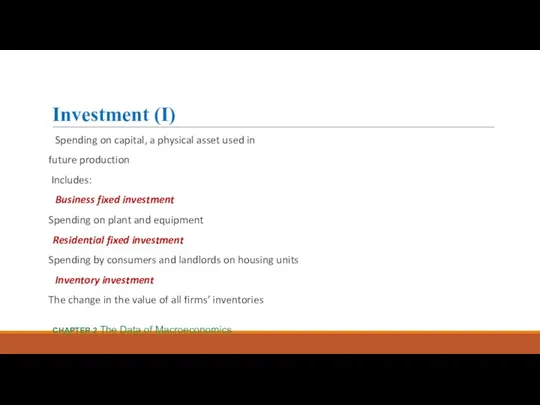
Investment (I)
Spending on capital, a physical asset used in
future production
Investment (I)
Spending on capital, a physical asset used in
future production
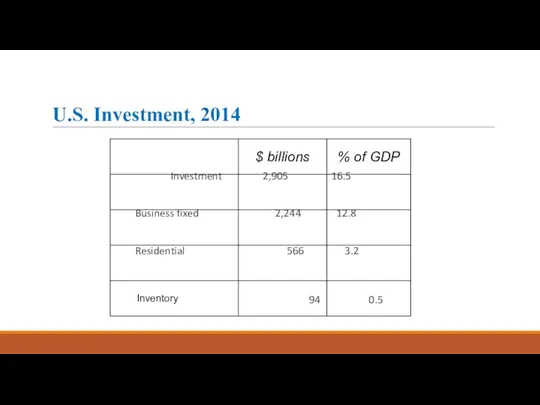
U.S. Investment, 2014
Investment 2,905 16.5
Business fixed 2,244 12.8
U.S. Investment, 2014
Investment 2,905 16.5
Business fixed 2,244 12.8
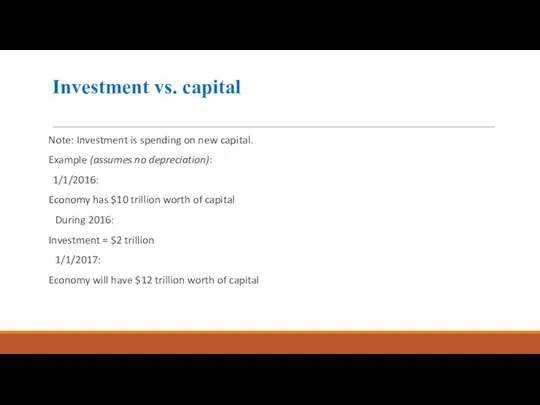
Investment vs. capital
Note: Investment is spending on new capital.
Example (assumes no
Investment vs. capital
Note: Investment is spending on new capital.
Example (assumes no
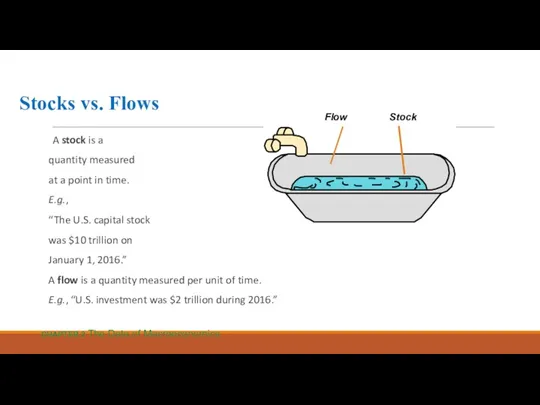
Stocks vs. Flows
A stock is a
quantity measured
at a point in time.
E.g.,
“The
Stocks vs. Flows
A stock is a
quantity measured
at a point in time.
E.g.,
“The
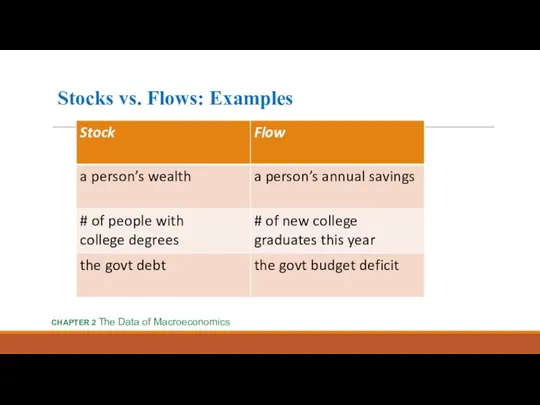
Stocks vs. Flows: Examples
CHAPTER 2 The Data of Macroeconomics
Stocks vs. Flows: Examples
CHAPTER 2 The Data of Macroeconomics
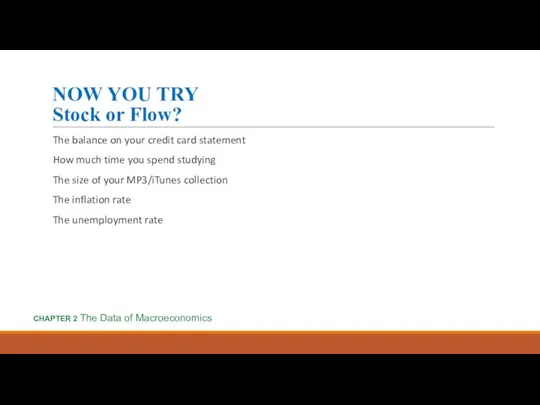
NOW YOU TRY
Stock or Flow?
The balance on your credit card statement
How
NOW YOU TRY
Stock or Flow?
The balance on your credit card statement
How
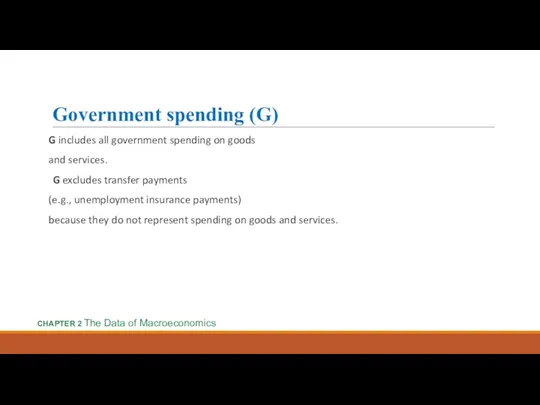
Government spending (G)
G includes all government spending on goods
and services.
G excludes
Government spending (G)
G includes all government spending on goods
and services.
G excludes
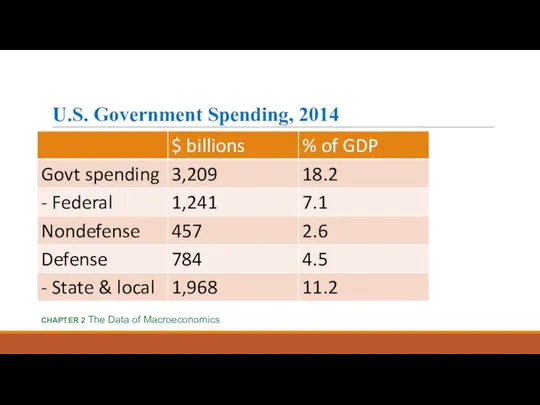
U.S. Government Spending, 2014
CHAPTER 2 The Data of Macroeconomics
U.S. Government Spending, 2014
CHAPTER 2 The Data of Macroeconomics
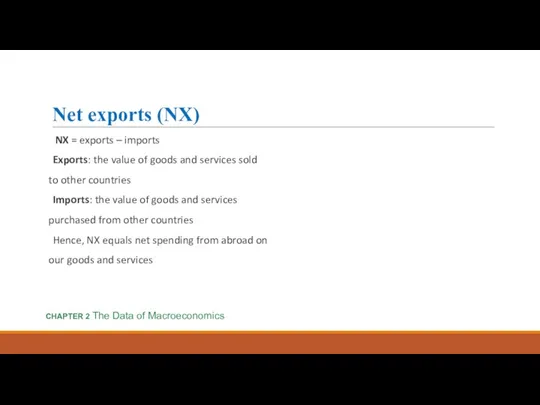
Net exports (NX)
NX = exports – imports
Exports: the value of
Net exports (NX)
NX = exports – imports
Exports: the value of
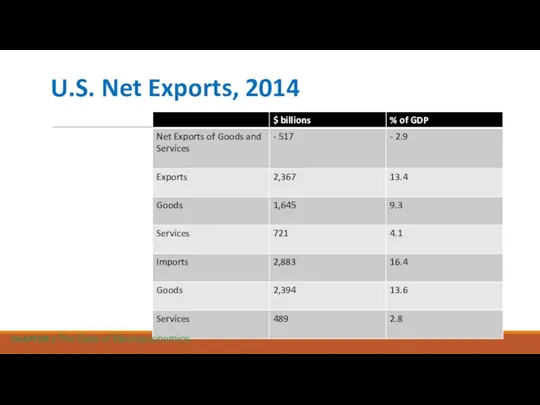
U.S. Net Exports, 2014
CHAPTER 2 The Data of Macroeconomics
U.S. Net Exports, 2014
CHAPTER 2 The Data of Macroeconomics
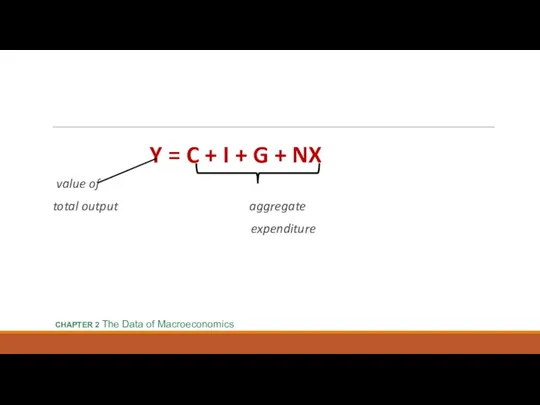
Y = C + I + G + NX
value
Y = C + I + G + NX
value
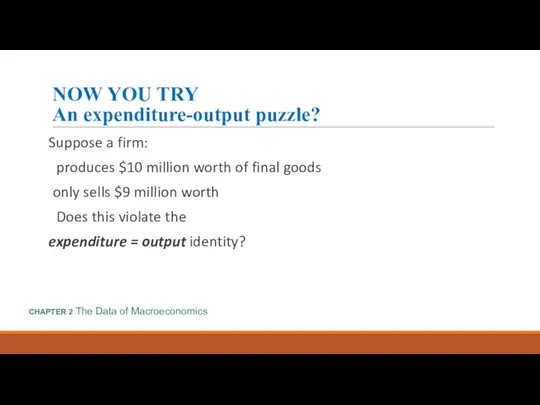
NOW YOU TRY
An expenditure-output puzzle?
Suppose a firm:
produces $10 million worth
NOW YOU TRY
An expenditure-output puzzle?
Suppose a firm:
produces $10 million worth
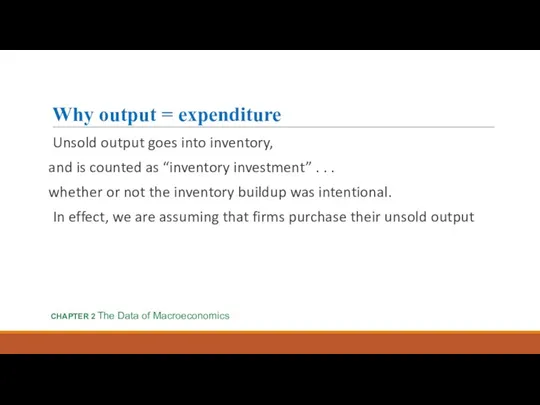
Why output = expenditure
Unsold output goes into inventory,
and is counted as
Why output = expenditure
Unsold output goes into inventory,
and is counted as
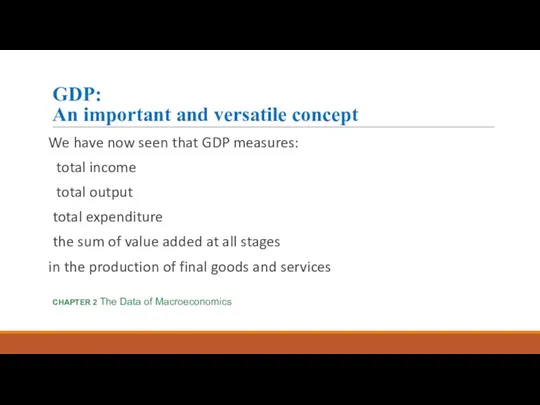
GDP:
An important and versatile concept
We have now seen that GDP measures:
GDP:
An important and versatile concept
We have now seen that GDP measures:
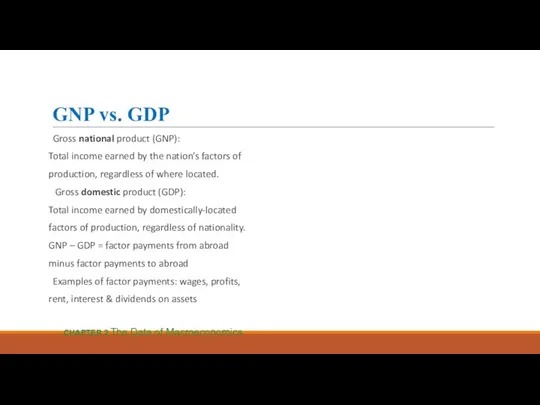
GNP vs. GDP
Gross national product (GNP):
Total income earned by the nation’s
GNP vs. GDP
Gross national product (GNP):
Total income earned by the nation’s
GNP vs. GDP
Gross national product (GNP):
Total income earned by the nation’s
GNP vs. GDP
Gross national product (GNP):
Total income earned by the nation’s
NOW YOU TRY
Discussion Question
In your country,
which would you
want to be bigger,
GDP
NOW YOU TRY
Discussion Question
In your country,
which would you
want to be bigger,
GDP
GNP vs. GDP in Select Countries, 2012
CHAPTER 2 The Data of
GNP vs. GDP in Select Countries, 2012
CHAPTER 2 The Data of
Other Measures of Income
Net National Product = GNP – Depreciation
Other Measures of Income
Net National Product = GNP – Depreciation
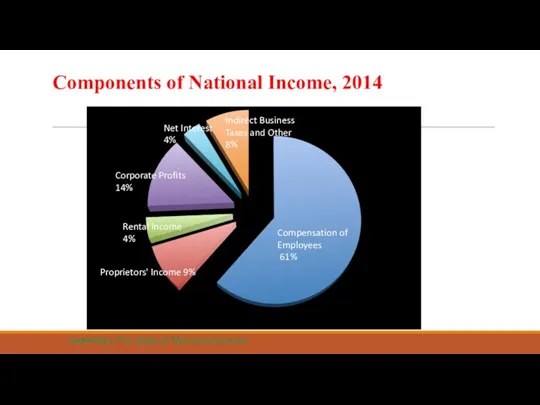
Components of National Income, 2014
CHAPTER 2 The Data of Macroeconomics
Indirect Business
Taxes
Components of National Income, 2014
CHAPTER 2 The Data of Macroeconomics
Indirect Business
Taxes
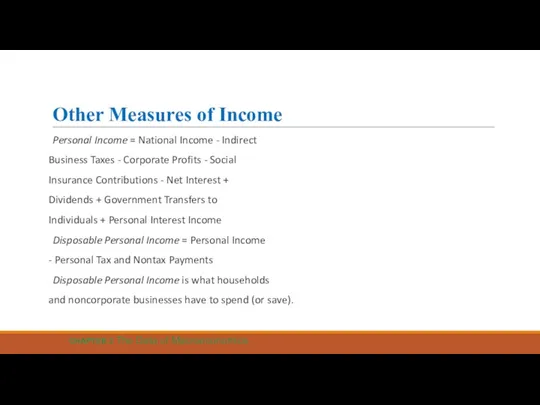
Other Measures of Income
Personal Income = National Income - Indirect
Business Taxes
Other Measures of Income
Personal Income = National Income - Indirect
Business Taxes
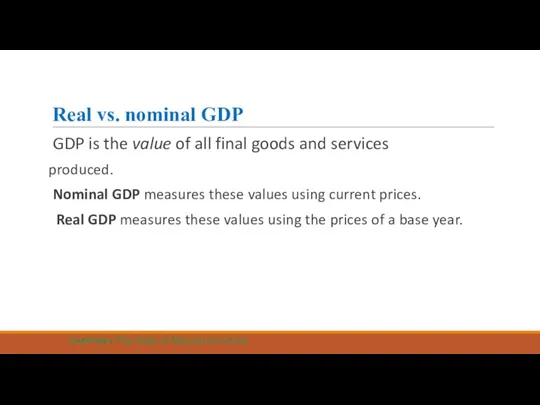
Real vs. nominal GDP
GDP is the value of all final goods
Real vs. nominal GDP
GDP is the value of all final goods
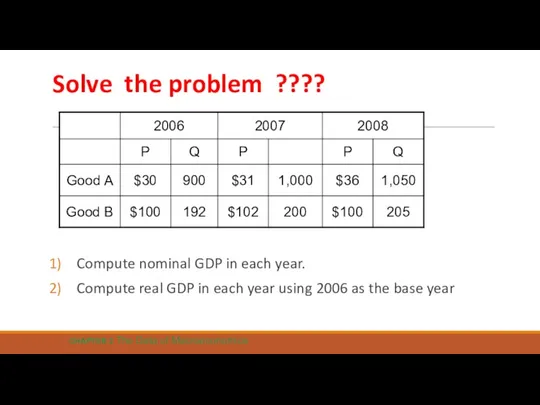
Solve the problem ????
Compute nominal GDP in each year.
Compute real GDP
Solve the problem ????
Compute nominal GDP in each year.
Compute real GDP
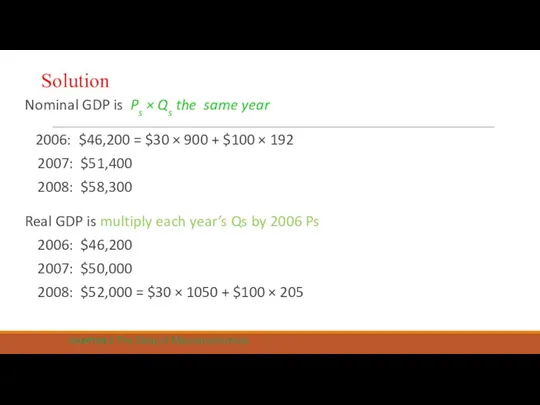
Solution
Nominal GDP is Ps × Qs the same year
2006: $46,200
Solution
Nominal GDP is Ps × Qs the same year
2006: $46,200
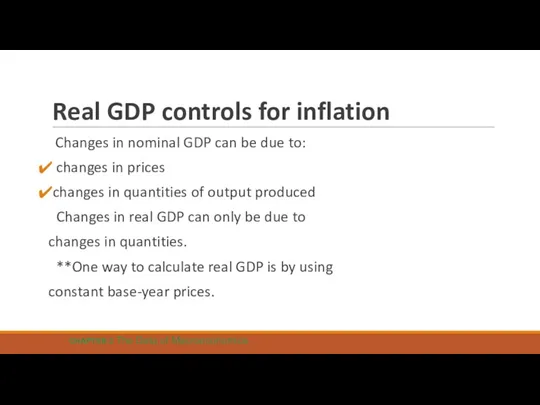
Real GDP controls for inflation
Changes in nominal GDP can be
Real GDP controls for inflation
Changes in nominal GDP can be
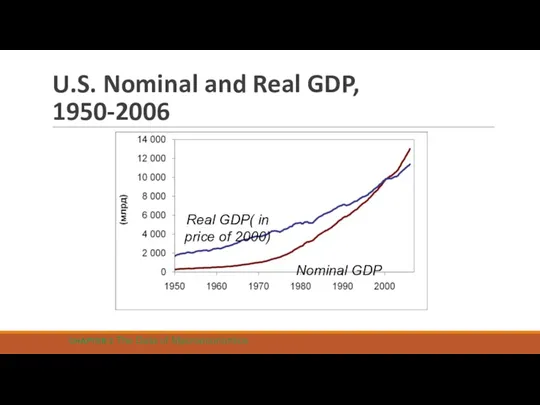
U.S. Nominal and Real GDP,
1950-2006
CHAPTER 2 The Data of Macroeconomics
Real GDP(
U.S. Nominal and Real GDP,
1950-2006
CHAPTER 2 The Data of Macroeconomics
Real GDP(
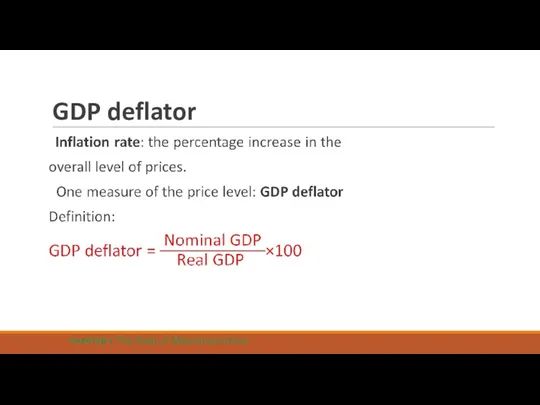
GDP deflator
CHAPTER 2 The Data of Macroeconomics
GDP deflator
CHAPTER 2 The Data of Macroeconomics
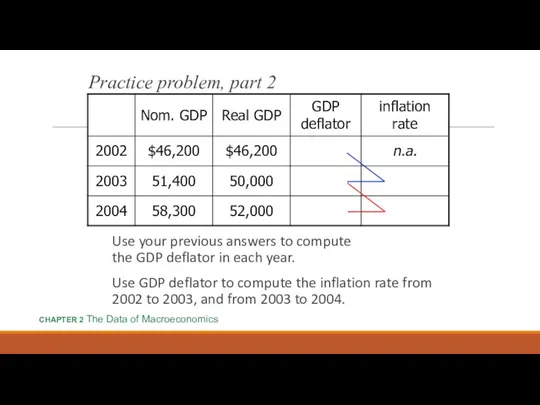
Practice problem, part 2
Use your previous answers to compute
the GDP
Practice problem, part 2
Use your previous answers to compute the GDP
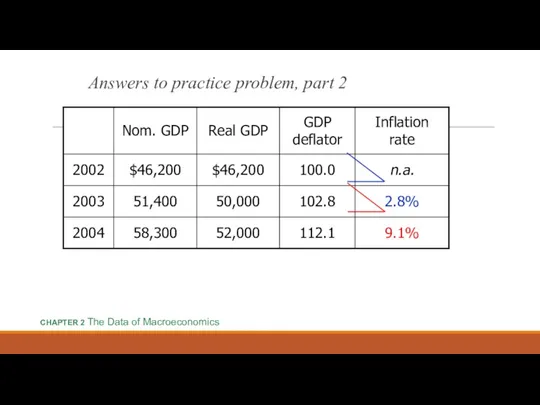
Answers to practice problem, part 2
CHAPTER 2 The Data of Macroeconomics
Answers to practice problem, part 2
CHAPTER 2 The Data of Macroeconomics
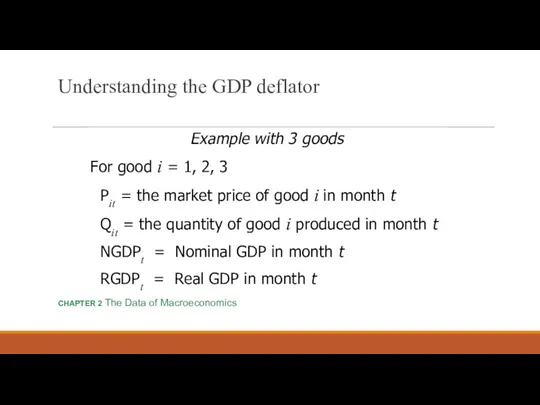
Understanding the GDP deflator
Example with 3 goods
For good i =
Understanding the GDP deflator
Example with 3 goods
For good i =
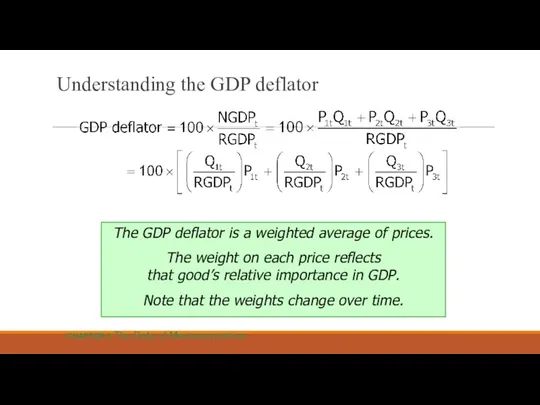
Understanding the GDP deflator
The GDP deflator is a weighted average of
Understanding the GDP deflator
The GDP deflator is a weighted average of
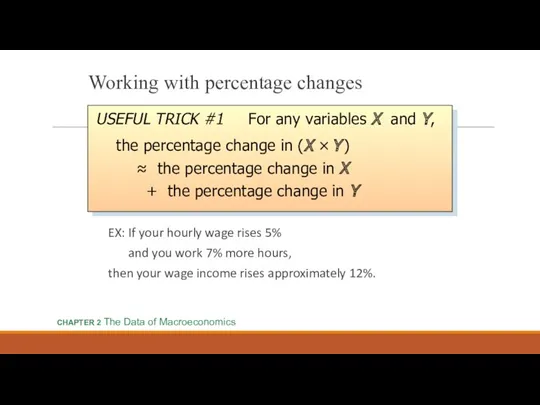
Working with percentage changes
EX: If your hourly wage rises 5%
and you
Working with percentage changes
EX: If your hourly wage rises 5% and you
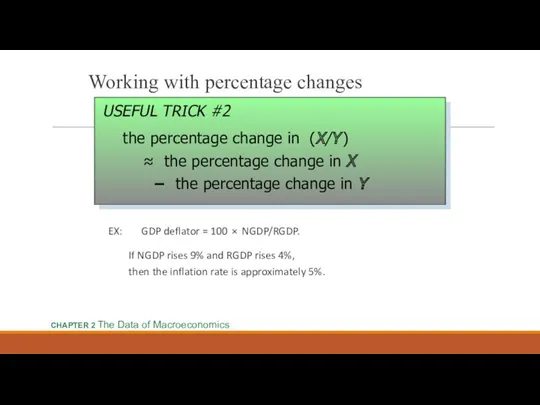
Working with percentage changes
EX: GDP deflator = 100 × NGDP/RGDP.
If NGDP
Working with percentage changes
EX: GDP deflator = 100 × NGDP/RGDP.
If NGDP
Chain-weighted Real GDP
Over time, relative prices change, so the base year
Chain-weighted Real GDP
Over time, relative prices change, so the base year
Consumer Price Index (CPI)
A measure of the overall level of prices
Consumer Price Index (CPI)
A measure of the overall level of prices
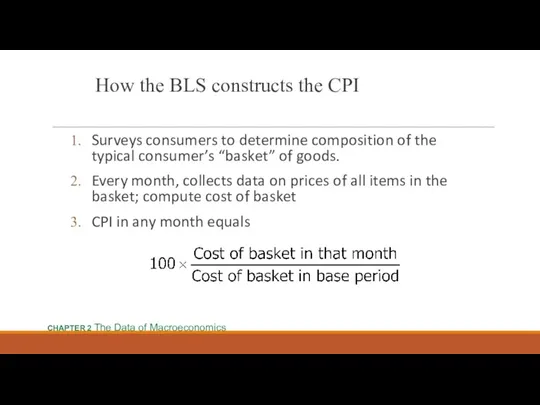
How the BLS constructs the CPI
Surveys consumers to determine composition of
How the BLS constructs the CPI
Surveys consumers to determine composition of
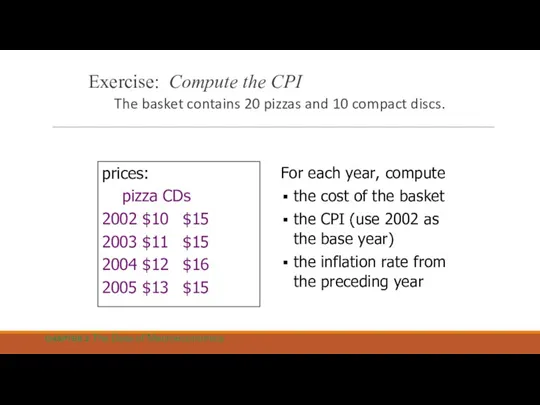
Exercise: Compute the CPI
The basket contains 20 pizzas and 10 compact
Exercise: Compute the CPI
The basket contains 20 pizzas and 10 compact
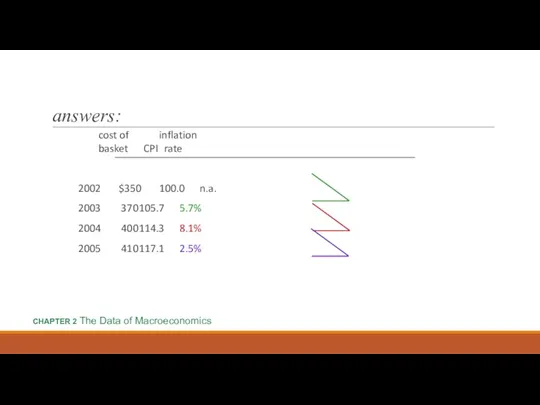
answers:
cost of inflation
basket CPI rate
2002 $350 100.0 n.a.
2003 370 105.7 5.7%
2004 400 114.3 8.1%
2005 410 117.1 2.5%
CHAPTER 2 The Data
answers:
cost of inflation
basket CPI rate
2002 $350 100.0 n.a.
2003 370 105.7 5.7%
2004 400 114.3 8.1%
2005 410 117.1 2.5%
CHAPTER 2 The Data
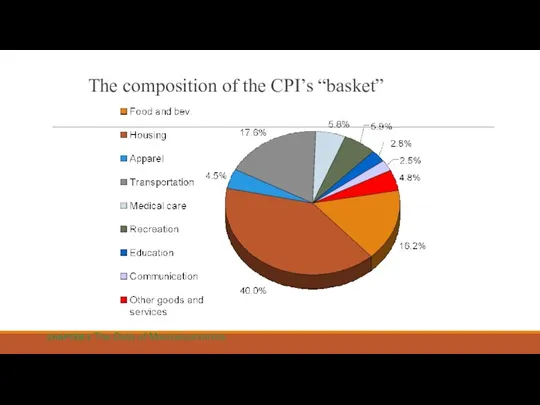
The composition of the CPI’s “basket”
CHAPTER 2 The Data of Macroeconomics
The composition of the CPI’s “basket”
CHAPTER 2 The Data of Macroeconomics
Understanding the CPI
Example with 3 goods
For good i = 1,
Understanding the CPI
Example with 3 goods
For good i = 1,
Understanding the CPI
The CPI is a weighted average of prices.
The
Understanding the CPI
The CPI is a weighted average of prices.
The
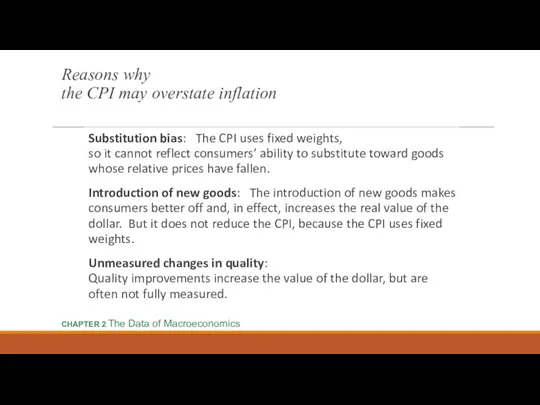
Reasons why
the CPI may overstate inflation
Substitution bias: The CPI uses
Reasons why
the CPI may overstate inflation
Substitution bias: The CPI uses
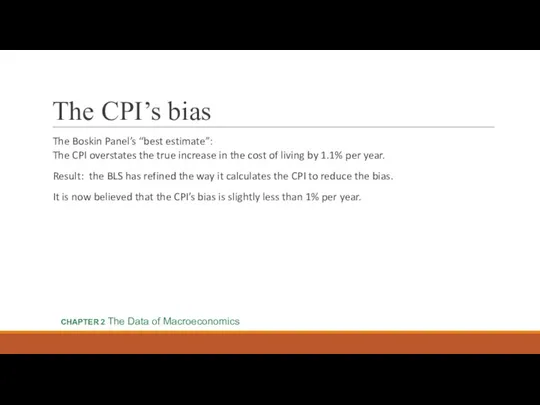
The CPI’s bias
The Boskin Panel’s “best estimate”:
The CPI overstates the true
The CPI’s bias
The Boskin Panel’s “best estimate”: The CPI overstates the true
Discussion topic:
If your grandmother receives Social Security, how is she affected
Discussion topic:
If your grandmother receives Social Security, how is she affected
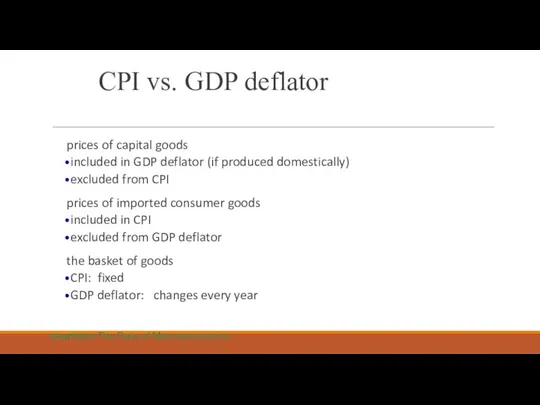
CPI vs. GDP deflator
prices of capital goods
included in GDP deflator (if
CPI vs. GDP deflator
prices of capital goods
included in GDP deflator (if
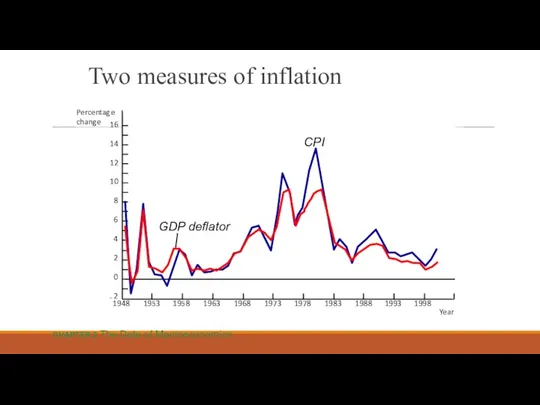
Two measures of inflation
16
14
12
10
Two measures of inflation
16
14
12
10
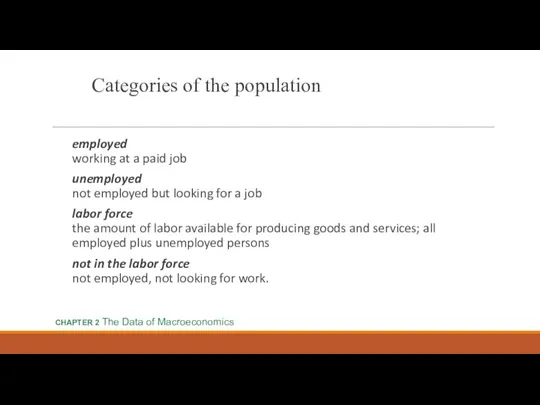
Categories of the population
employed
working at a paid job
unemployed
not
Categories of the population
employed
working at a paid job
unemployed
not
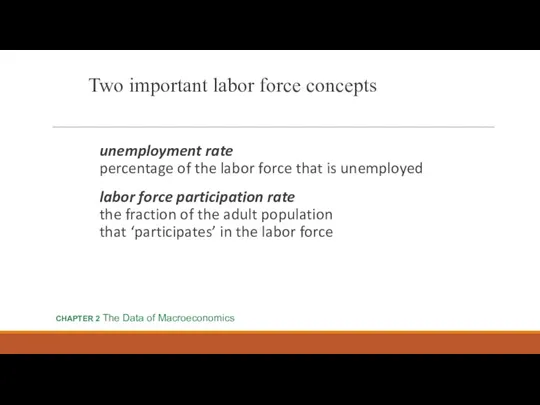
Two important labor force concepts
unemployment rate
percentage of the labor force
Two important labor force concepts
unemployment rate percentage of the labor force
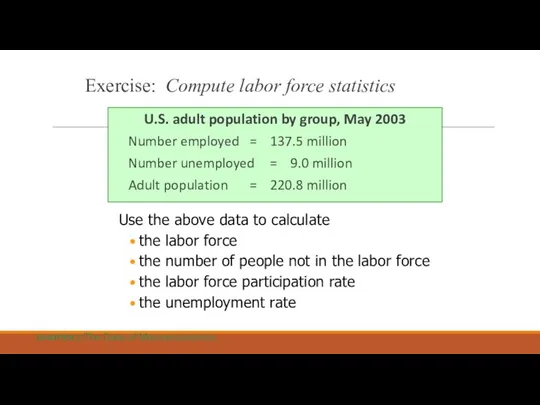
Exercise: Compute labor force statistics
U.S. adult population by group, May 2003
Number
Exercise: Compute labor force statistics
U.S. adult population by group, May 2003
Number
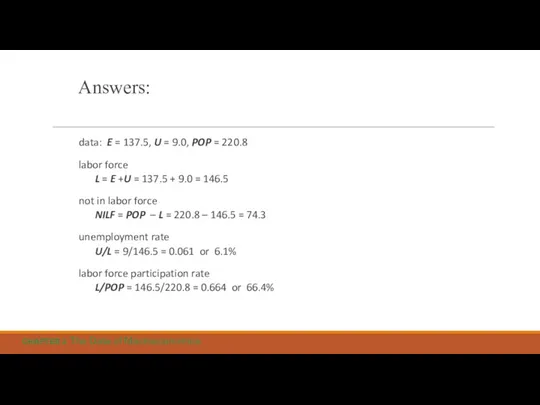
Answers:
data: E = 137.5, U = 9.0, POP = 220.8
labor force
L
Answers:
data: E = 137.5, U = 9.0, POP = 220.8
labor force
L
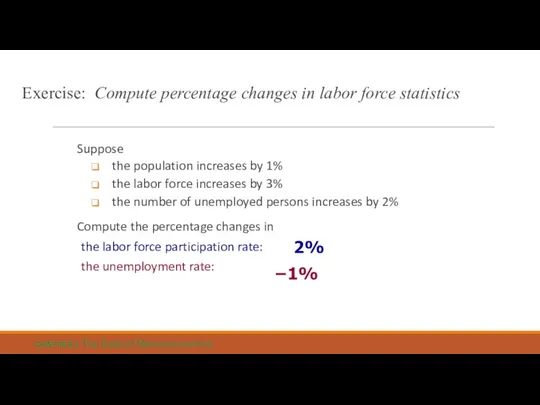
Exercise: Compute percentage changes in labor force statistics
Suppose
the population increases
Exercise: Compute percentage changes in labor force statistics
Suppose
the population increases
Employed workers help produce GDP, while unemployed workers do not.
So
Employed workers help produce GDP, while unemployed workers do not. So
Okun’s Law
1951
1984
1999
2000
1993
1982
1975
Change in
unemployment rate
10
Percentage change
in real GDP
Okun’s Law
Okun’s Law
1951
1984
1999
2000
1993
1982
1975
Change in
unemployment rate
10
Percentage change
in real GDP
Okun’s Law
Chapter Summary
Gross Domestic Product (GDP) measures both total income and total
Chapter Summary
Gross Domestic Product (GDP) measures both total income and total
 Международная миграция рабочей силы
 Введение в социально-экономическую статистику (СЭС)
 Великие географические открытия. Часть 1
 Концепции построения ЛС при управлении запасами
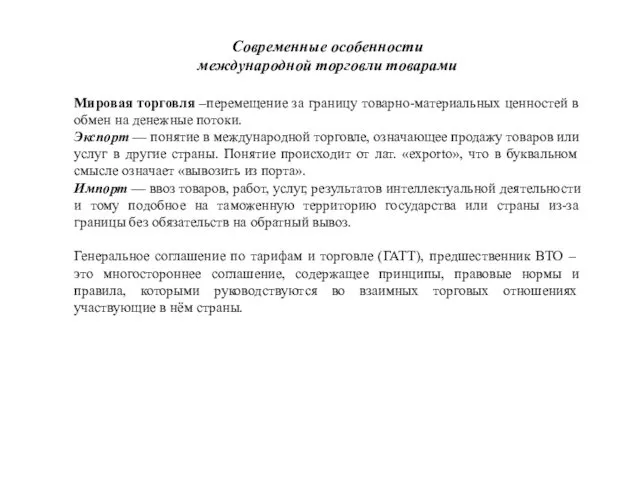 Современные особенности международной торговли товарами
 Государственная промышленная и научнотехническая политика, как инструменты регулирования экономики
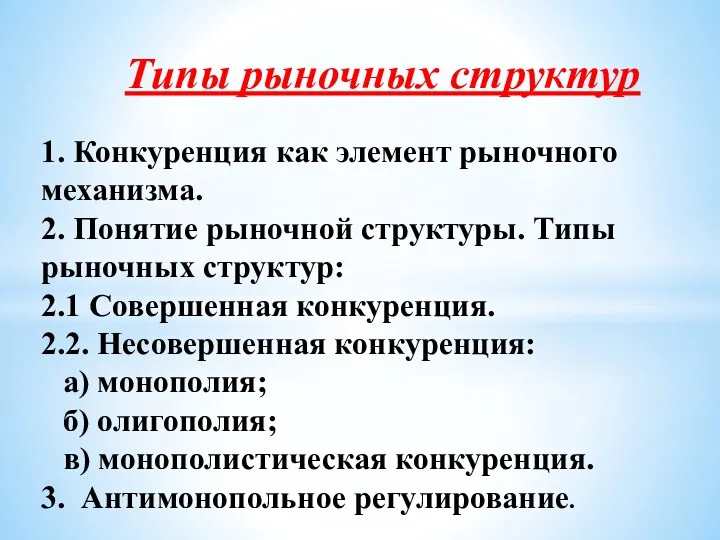 Типы рыночных структур
 Поведение потребителя
 Эндогенные теории экономического роста
 Потребности и ресурсы. Проблема выбора в экономике
 Экономические и математически методы экономического анализа
 Современное рыночное хозяйство
 Сетевые технологии планирования и управления в условиях неопределённости
 Принятие решений как особый вид человеческой деятельности
 Исламдық қаржы орталықтары
 Статистика национального богатства. Валовой внутренний продукт
 Личные финансы: сущность и особенности. (Лекция 3)
 Мировая экономика и международные экономические отношения
 Основы поведения субъектов рыночной экономики.Общая и предельная полезность. Закон убывающей предельной полезности. Кривые безразличия
 Методика и техника изучения затрат рабочего времени. Хронометраж, фотографии рабочего времени
 Стратегическое планирование в Республике Казахстан
 Фармакоэкономический анализ и его методы
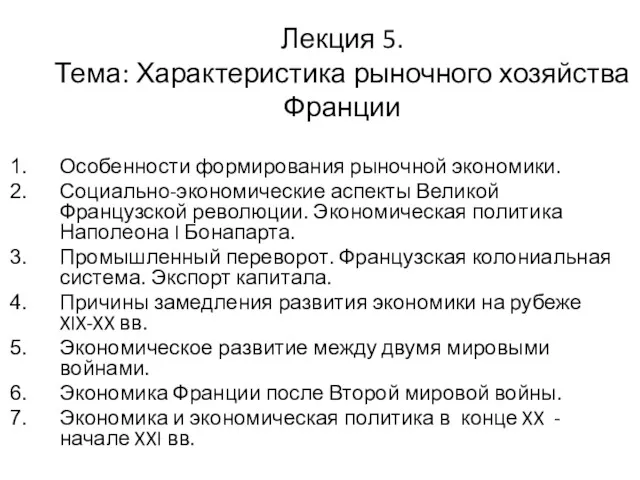 Характеристика рыночного хозяйства Франции
 Цели устойчивого развития
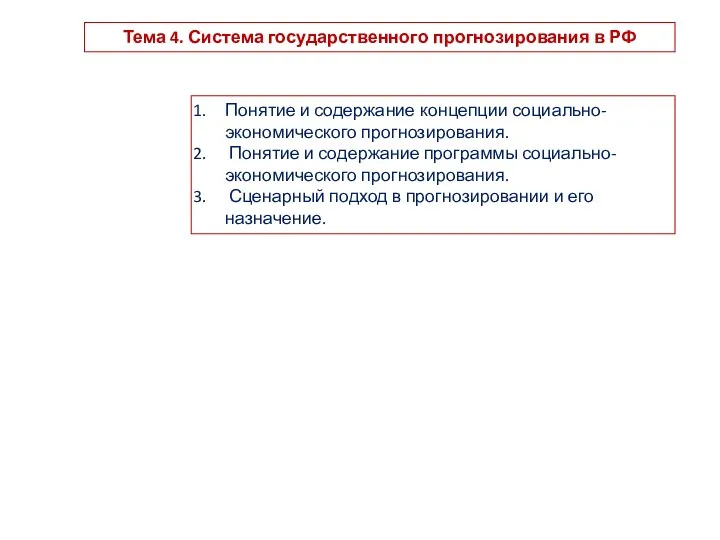 Система государственного прогнозирования в РФ
 Итоговое собрание АСП Атополе Мото Кудрово. Итоги января 2023
 Моделі соціального інвестування розвинутих країн світу
 ИСО-ның ұйымдастырушылық құрылымы